. 2025 Apr 21;21(4):e1012990.
doi: 10.1371/journal.pcbi.1012990. eCollection 2025 Apr.

Statistical signature of subtle behavioral changes in large-scale assays

Affiliations

Statistical signature of subtle behavioral changes in large-scale assays

Alexandre Blanc et al. PLoS Comput Biol. .

Abstract

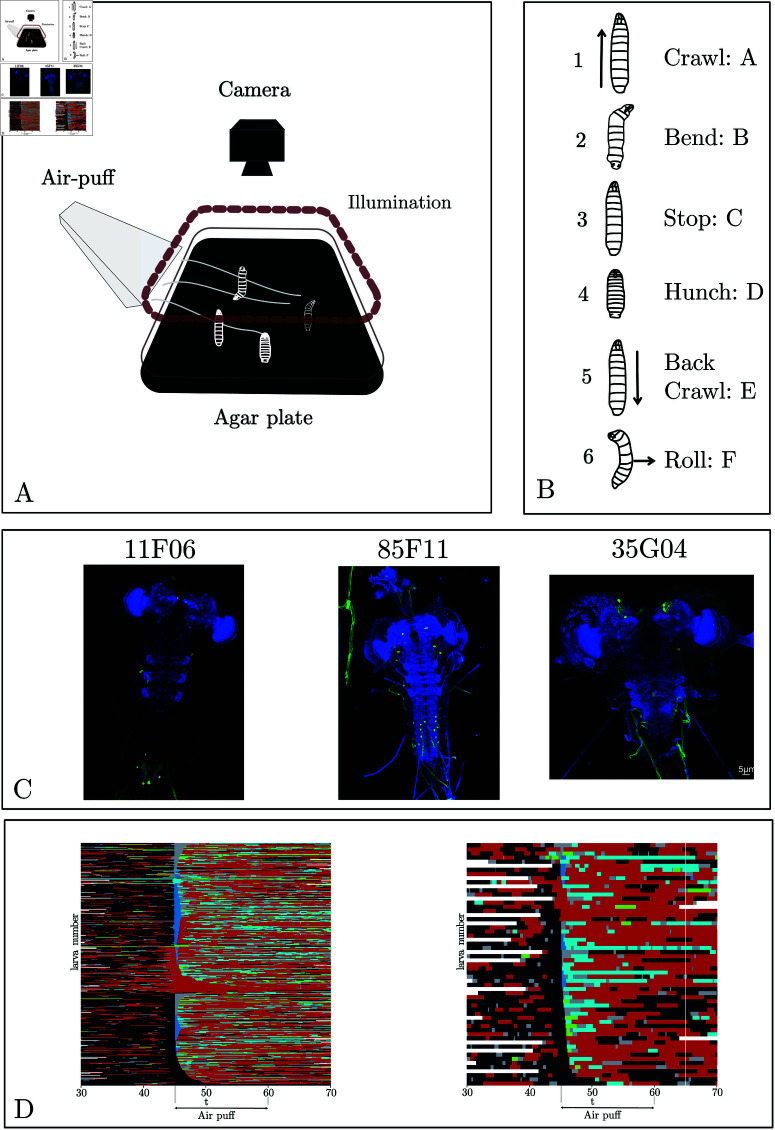
The central nervous system can generate various behaviors, including motor responses, which we can observe through video recordings. Recent advances in gene manipulation, automated behavioral acquisition at scale, and machine learning enable us to causally link behaviors to their underlying neural mechanisms. Moreover, in some animals, such as the Drosophila melanogaster larva, this mapping is possible at the unprecedented scale of single neurons, allowing us to identify the neural microcircuits generating particular behaviors. These high-throughput screening efforts, linking the activation or suppression of specific neurons to behavioral patterns in millions of animals, provide a rich dataset to explore the diversity of nervous system responses to the same stimuli. However, important challenges remain in identifying subtle behaviors, including immediate and delayed responses to neural activation or suppression, and understanding these behaviors on a large scale. We here introduce several statistically robust methods for analyzing behavioral data in response to these challenges: 1) A generative physical model that regularizes the inference of larval shapes across the entire dataset. 2) An unsupervised kernel-based method for statistical testing in learned behavioral spaces aimed at detecting subtle deviations in behavior. 3) A generative model for larval behavioral sequences, providing a benchmark for identifying higher-order behavioral changes. 4) A comprehensive analysis technique using suffix trees to categorize genetic lines into clusters based on common action sequences. We showcase these methodologies through a behavioral screen focused on responses to an air puff, analyzing data from 280 716 larvae across 569 genetic lines.


Conflict of interest statement

The authors have declared that no competing interests exist.

Figures

Fig 1
Fig 1. (A) Behavioral set-up.
The larvae move freely on an agar plate, and their movement is recorded with an infrared camera equipped with a high-throughput closed-loop tracker. The stimulus was an air puff (or illumination for training data). (B) The six stereotypical actions [8, 9] associated with the larva for this experimental paradigm. (C) Example of Neuronal expression patterns in three example lines: 11F06, 85F22, and 35G04. (D) Ethogram of larva behavior in response to an air-puff at 45s based on automated behavior detection. Each line corresponds to one larva, with the control line (attP2) on the left and R35G04 on the right. Colors correspond to the following actions: black for crawl, red for bend, blue for stop, deep blue for hunch, and cyan for back. Note that no rolls were observed in these lines.
Fig 2
Fig 2. (A) Noisy, tracked contour of a larva in gray and regularized contour in orange.
The head is indicated by a red point and the tail by a black. (B) 1. Close-up of six points of the larva contour. Vectors between these points represent the contour. The jth point is denoted Mj, its tangent vector tj, and the curvature at this point θj. 2. Two larval outlines at time t and t  +  dt; the vectors show the movement of two selected points during the time-lapse dt. 3. Change of the contour points after the surface energy is minimized. (C) Results of the algorithm applied to two different larvae at four different time steps with the tracked contour in black and the inferred one in orange. The larva’s trajectory is drawn in black, and its center of mass is indicated by a red dot (see also S1 Video).
Fig 3
Fig 3. (A) Architecture of the self-supervised predictive autoencoder.
The encoder consists of multiple convolutions with ReLU activations alternating between the spatial and temporal axes of the data, followed by a fully connected linear layer. The decoder consists of an upsampling linear layer matching the internal representation to the desired shape, followed by alternating convolutions with ReLU activations. (B) Visualization of the latent space. The 10D latent space is projected into 2D using UMAP [50]. The colors correspond to the discrete behavior dictionary (black: crawl, red: bend, green: stop, blue: hunch, cyan: back, and yellow: roll) (C) Transition probability from one discrete state to another as a function of the position in the latent space: here, between run and bend. (D–F) Highlights of the behavior geometry in the latent space (represented in 2D using UMAP). In D run vs. bend, in E run vs. roll, and in F hunch vs. back. (G) Cross-validated confusion matrix of random forest classifiers using the latent representation to infer the usual discrete behavior dictionary.
Fig 4
Fig 4. (A) Illustration of our phenotyping modeling strategy for each genotype.
From left to right: The behavior evolution on the experimental setup is reduced to the five tracked points of the larva; the extraction of a temporal window (shown in purple on the ethogram as an illustration) usually after the onset of the stimuli (shown as a vertical green line), the projection of the temporal window on the latent space using the encoder shown in Fig 3 and reduced here to a yellow box, each point in the latent space corresponds to one larval behavior during the selected time window, and the phenotype of the genotype is the distribution of all the points in the latent space regularized by a Gaussian kernel. (B) Illustration of the correspondence between statistical testing procedures based on discrete behavior categories with chi-squared tests and testing procedures based on continuous behavior with MMD. (C) Latent distributions of behavior (regularized by a Gaussian kernel): (C.1) of the reference line attP2 and (C.2) of the line 10A11. (C.3) Witness function between these two latent distributions, highlighting the main behavioral differences between the lines.
Fig 5
Fig 5. (A) Graphical representation of the probabilistic generative model, showing the temporally inhomogeneous Poisson model pi(Δt|t), the distribution of action amplitudes pi(S|Tb,t), and transition probabilities to the other actions.
(B) characterization of behavioral responses to an air puff with the prediction of the generative model for two lines. At the top: time evolution of the larva’s actions; thin lines represent the experimental recording, and thick lines are the generative model. At the bottom, a circular plot of the z-scores between the action sequences of the generative model and the experimental recordings. Darker blue colors indicate larger values. The two lines are R41D01 on top and R38H09 on the bottom.
Fig 6
Fig 6. A. Illustrative example of a suffix tree obtained from three larvae performing three different sequences.
Larva 1: ABA, Larva 2: BAC, Larva 3: BD, the seven paths from the root to the leaves correspond to the seven suffixes: A, BA, ABA, AC, BAC, D and BD. Each node shared by at least two larvae is shown in circles: A, B and BA. B. Hierarchical clustering based on the cosine similarity between the suffix tree vectors of each genetic line. Each color is associated with a different cluster. C. Distance matrix representing the squared MMD between all lines from the inactivation screen, computed in a 10D learned latent space for a 2-second time window. D. 2D representation of the geometric relationships between lines, obtained using supervised UMAP [63], encoded by the distance matrix. The bar plot associated with each cluster represents the average variation of behavior during the 2-second window in the six actions behavior dictionary. The thickness of the lines linking two clusters is associated with the coupling between the clusters. E. The z-score distributions’ standard deviation normalises average z-scores between data and generated sequences. We display only the 30 highest values. F. The 17 sequences of nodes with the highest frequency of occurrence for each of the eight clusters.
Fig 7
Fig 7. Samples of genetic lines of interest, “Hits”, with their characterization.
These lines lead to subtle modifications in behavior and were not detected by previous approaches. We present four new hits: two hits associated with complex alterations of the learned latent space and two lines associated with significant sequence deviations from the generative model and the reference. The columns correspond to 1. control line attP2, 2. R68B06, 3. R57F07, 4. R18A10, 5. R38H09. Row A: Light microscopy images of larval brains expressing the selected GAL4 line. Note that there is no picture for attP2, as it is the reference and thus labels no neurons. Row B: Proportions of each stereotypical action evoked during the 2 seconds after stimulis. Row C: Latent distribution of behaviors of the lines, during the 2 seconds after stimulus, with the distribution of the reference line shown in red and the distribution of the hit lines shown in blue. Row D: Witness function between latent distributions of the hit and reference lines, highlighting the main sources of behavioral differences. Note the complex patterns in the latent space, showing these hits do not stem from simple variations in one action. Row E: Z-scores of sequences of three actions between the generative model and experimental sequences. Row F: Position of the reference and hit lines in the 2D representation of the geometric relationships between lines encoded by the distance matrix (shown in Fig 6D,E). Row G: Position of the line in the hierarchical clustering tree (shown here in circular form).
Fig 8
Fig 8. Two genetic lines of interest, each subjected to two different stimulus intensities: high intensity as previously illustrated, and low intensity, involving a less powerful air puff.
We provide characterizations of each line and protocol. The columns correspond to (1) the control line, (2) R68B05 and (3) R20F11. Row A displays light microscopy images of larval brains expressing the selected GAL4 lines. In Row B, the proportions of each stereotypical action during the 2 seconds following the stimulus, with high intensity in plain color and low intensity in dashed lines. Row C, witness function between latent distributions, highlighting the main sources of behavioral differences between the two protocols for the control and the two lines. Row D, the position of high intensity in red and low intensity in blue in the 2D representation of the geometric relationships between lines, encoded by the distance matrix (as shown in Fig 6B, C). Row E, the positions of high intensity (red) and low intensity (blue) displayed in the hierarchical clustering tree (presented here in circular form)

Similar articles

Cited by

References

    1. Robie AA, Hirokawa J, Edwards AW, Umayam LA, Lee A, Phillips ML, et al.. Mapping the neural substrates of behavior. Cell. 2017;170(2):393–406.e28. doi: 10.1016/j.cell.2017.06.032 - DOI - PubMed
    1. Vogelstein JT, Park Y, Ohyama T, Kerr RA, Truman JW, Priebe CE, et al.. Discovery of brainwide neural-behavioral maps via multiscale unsupervised structure learning. Science. 2014;344(6182):386–92. doi: 10.1126/science.1250298 - DOI - PubMed
    1. Winding M, Pedigo BD, Barnes CL, Patsolic HG, Park Y, Kazimiers T, et al.. The connectome of an insect brain. Science. 2023;379(6636):eadd9330. doi: 10.1126/science.add9330 - DOI - PMC - PubMed
    1. Dorkenwald S, Matsliah A, Sterling AR, Schlegel P, Yu Sc, McKellar CE, et al. Neuronal wiring diagram of an adult brain; 2023. - PMC - PubMed
    1. Scheffer LK, Xu CS, Januszewski M, Lu Z, Takemura S-Y, Hayworth KJ, et al.. A connectome and analysis of the adult Drosophila central brain. eLife. 2020;9:e57443. doi: 10.7554/eLife.57443 - DOI - PMC - PubMed

LinkOut - more resources