. 2025 Apr 21;16(1):3748.
doi: 10.1038/s41467-025-59093-7.

Targeted immunotherapy rescues pulmonary fibrosis by reducing activated fibroblasts and regulating alveolar cell profile

Affiliations

Targeted immunotherapy rescues pulmonary fibrosis by reducing activated fibroblasts and regulating alveolar cell profile

Jing Yan et al. Nat Commun. .

Abstract

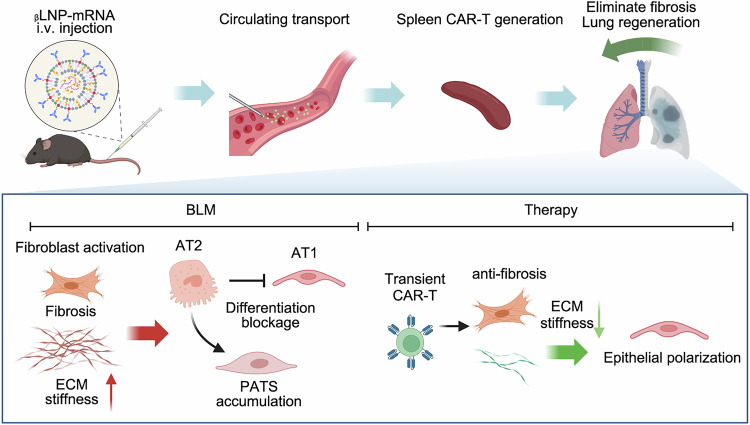
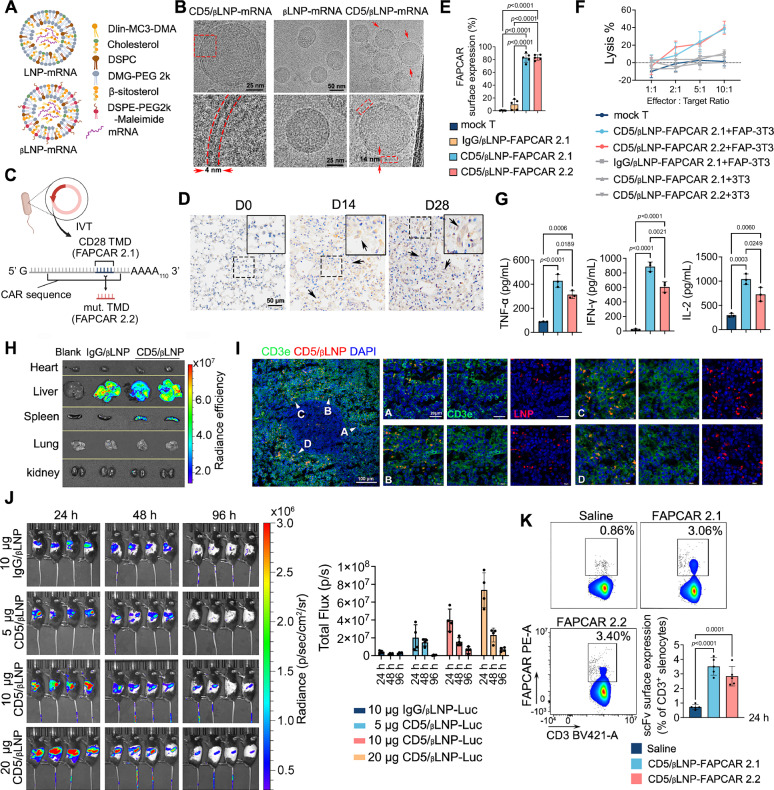
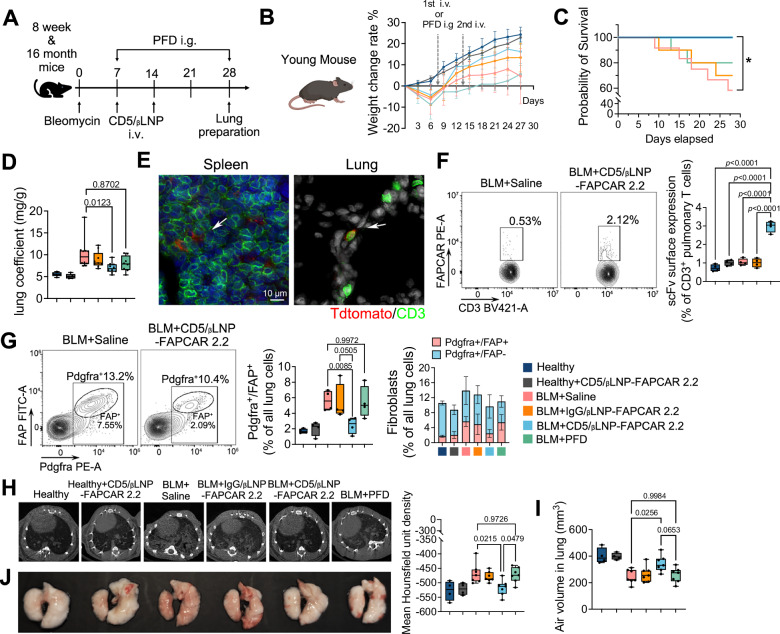
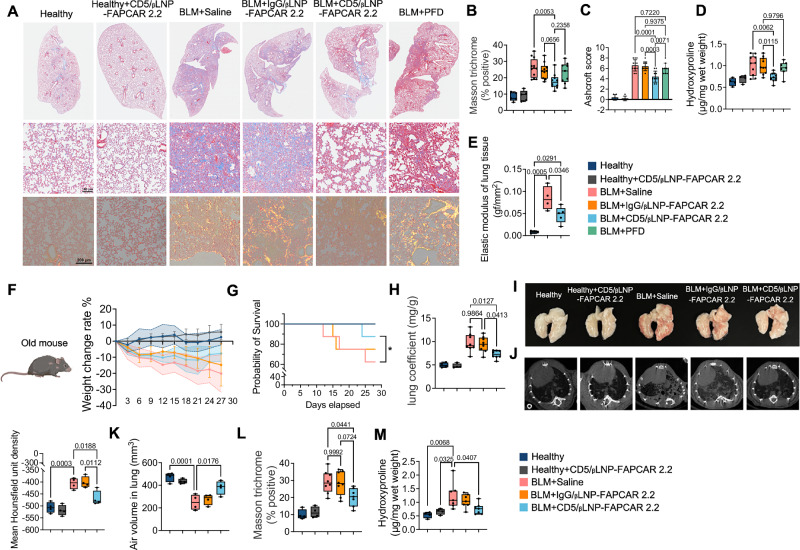
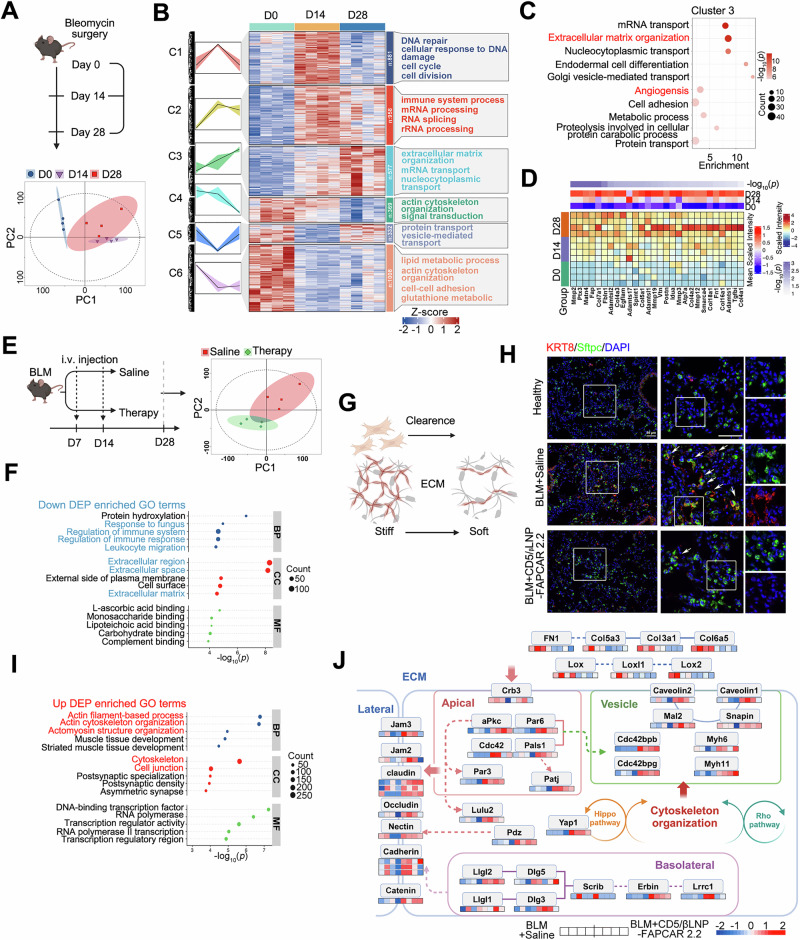
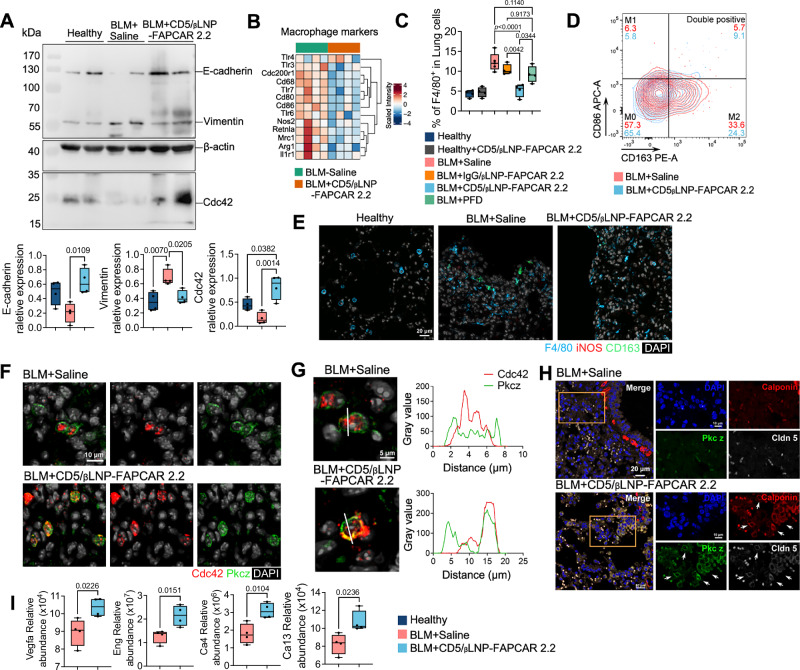
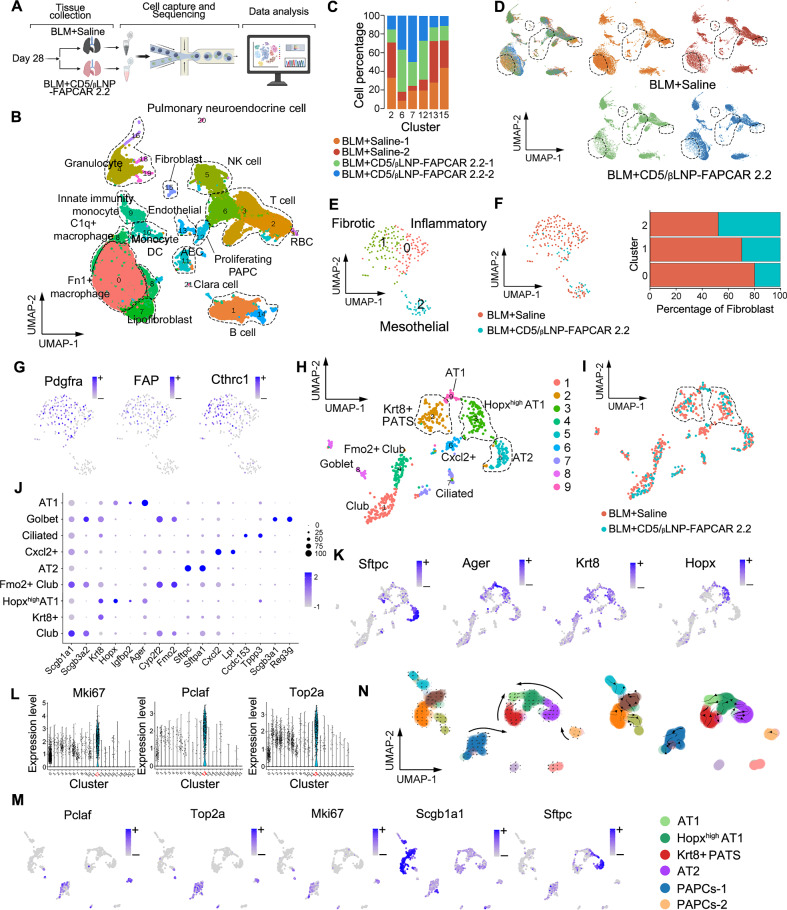
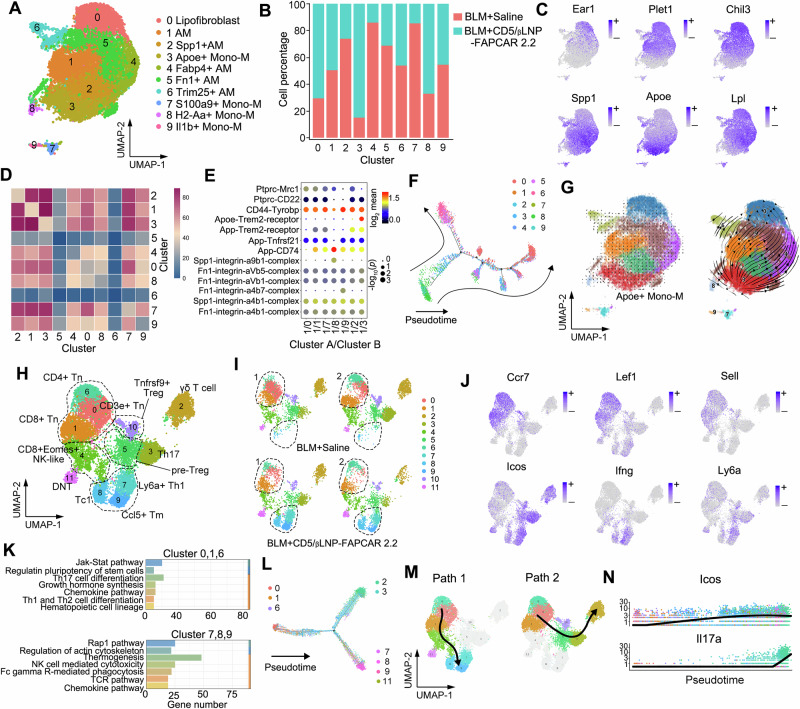
Idiopathic pulmonary fibrosis (IPF) is a severe lung disease occurring throughout the world; however, few clinical therapies are available for treating this disorder. Overactivated fibroblasts drive abnormal fibrosis accumulation to maintain dynamic balance between inflammation and extracellular matrix (ECM) stiffness. Given pulmonary cell can regenerate, the lung may possess self-repairing abilities if fibrosis is removed via clearance of overactivated fibroblasts. The aim of this study was to evaluate the therapeutic activity of transient antifibrotic chimeric antigen receptor (CAR) T cells (generated via a novelly-designed lipid nanoparticle-messenger RNA (LNP-mRNA) system) and explore the regeneration mechanisms of lung in a male mouse model of bleomycin-induced pulmonary fibrosis. Here we found that fibrosis-induced ECM stiffening impaired alveolar epithelial cell compensation. The proposed LNP-mRNA therapy eliminated overactivated fibroblasts to rescue pulmonary fibrosis. The restored ECM environment regulated the cellular profile. The elevated plasticity of AT2 and Pclaf+ cells increased AT1 cell population via polarization. Apoe+ macrophages and increased numbers of effector T cells were shown to reestablish pulmonary immunity. Hence, LNP-mRNA treatment for fibrosis can restore pulmonary structure and function to similar degrees to those of a healthy lung. This therapy is a potential treatment for IPF patients.


Conflict of interest statement

Competing interests: The authors declare no competing interests.

Figures

Fig. 1
Fig. 1. LNP-mRNA treatment for pulmonary fibrosis and relevant mechanisms.
Overactivated fibroblasts induce pulmonary fibrosis and increase ECM stiffness, which hinders AT2 to AT1 differentiation resulting in PATS accumulation and fibrosis progression. Transient FAPCAR-T cells generated in vivo via LNP-mRNA can eliminate overactivated fibroblasts and promote lung regeneration via alveolar epithelial polarization. (BLM: bleomycin; LNP: lipid nanoparticle; ECM: extracellular matrix; AT1/2: alveolar epithelial type I/II; PATS: pre-alveolar type I transitional cell state). Created in BioRender.
Fig. 2
Fig. 2. Generation of FAPCAR-T cells in vivo and vitro.
A Schematic diagram of traditional and β-sitosterol modified targetable LNP (βLNP) structures. B STEM images of membrane structure of βLNP and βLNP with CD5 surface modification (Scale bar: 25 and 50 nm). C Diagram of FAPCAR 2.1 and 2.2 IVT mRNA. Optimized TMD replaced CD28 TMD in FAPCAR 2.2 sequence. D IHC staining for FAP of mouse lung at 0, 14 and 28 days after BLM modeling. (Scale bar: 50 μm) arrow: FAP-positive overactivated fibroblasts. E FAPCAR 2.1 and FAPCAR 2.2 receptor expression on mouse T cell surface after 24 h incubation with IgG/βLNP or CD5/βLNP (n = 5). F Targeted lysis assay after 36 h co-culturing transient CAR-T with 3T3 cells (n = 3). G Cytokine production after 48 h co-culturing FAPCAR-T with FAP-3T3 cells (effector: target ratio=10: 1; n = 3). H PKH26 labeled CD5/βLNP accumulated in both spleen and liver and IgG/βLNP in the liver only. I Colocalization of CD5/βLNPs (PKH26 marked in red) and CD3e positive T cells (green) in the spleen for 24 h after i.v. injection (Scale bar: 100 and 20 μm). J Dose- and time-dependent distribution and expression changes of luciferase mRNA delivered by βLNPs in mice (n = 4). K Flow cytometry assay and quantification of FAPCAR 2.1 and 2.2 mRNA expressions for 24 h after CD5/βLNPs injection (10 μg) compared with saline injection (n = 5). ‘n’ means independent biological replications. The values are means ± SDs. *P < 0.05. P-value determined by one-way ANOVA followed by Tukey’s multiple comparisons test (E, G, K). (CAR: chimeric antigen receptor; IVT: in vitro transcription; TMD: transmembrane domain; IHC: immunohistochemistry; ORF: open reading frame; FAP: fibroblast activation protein; STEM: scanning transmission electron microscopy). Source data are provided as a Source Data file.
Fig. 3
Fig. 3. CD5/βLNP-FAPCAR 2.2 therapy rescued pulmonary fibrosis via FAP-fibroblast clearance.
A Schematic diagram of fibrosis model establishment and treatment strategy in young or aged mice. B, C Young mouse BW changes (B) and survival curve (C) of control and BLM groups treated with IgG/βLNP-FAPCAR 2.2, CD5/βLNP-FAPCAR 2.2 (10 μg) and saline (n = 10). The survival rate was analyzed using the log-rank (Mantel-Cox) test. D Lung coefficients (lung weight (mg)/BW (g)) (n = 5,5,10,10,10,7). E tdTomato reporter gene expressed in T cells of spleen and lung at 24 h after the second CD5/βLNP-FAPCAR 2.2 injection (Scar bar: 10 μm). F Flow cytometry plots for FAPCAR expression in CD3+ pulmonary T cells of BLM+Saline and CD5/βLNP-FAPCAR 2.2 treatment groups and the ratio of FAPCAR expression to CD3+ pulmonary T cells (n = 4). G Flow cytometry analysis of FAP+Pdgfra+ fibroblasts in BLM+Saline and CD5/βLNP-FAPCAR 2.2 treatment groups, ratio of FAP+Pdgfra+ fibroblasts to all lung cells, and ratio of Pdgfra+ fibroblasts (both FAP+ and FAP) to all lung cells (n = 4). H, I Representative micro-CT images and mean HU density (H), and lung air volume (mm3) (I) computed according to CT results at postoperative 28 days (n = 4,4,7,7,7,7). J Digital photos of lung tissue. ‘n’ means independent biological replications. The values are the means ± SDs. *P < 0.05. P-value determined by one-way ANOVA followed by Tukey’s multiple comparisons test (D, F, H, I) and two tailed unpaired Student’s t-test (G). (BW: body weight; HU: Hounsfield unit). Source data are provided as a Source Data file. Created in BioRender (AB).
Fig. 4
Fig. 4. Fibrosis was reduced after CD5/βLNP-FAPCAR 2.2 therapy in young and aged mice.
A Masson and picrosirius red staining of fibrotic areas (Scale bar: 100 and 200 μm). B, C Quantified changes of fibrotic areas (B) and Ashcroft scale (C) (n = 5,5,12,10,10,9). D Hydroxyproline (HYP) assay for quantification of collagen content. (n = 4,4,10,10,10,7). E Elasticity modulus assay of the entire lung tissue in healthy, fibrotic, and treatment groups by the Mechanical Testing System (n = 4,4,5). FH CD5/βLNP-FAPCAR 2.2 anti-fibrotic assay in the fibrotic model of aged (16 month) mice: BW (F), survival rate (G), and lung coefficients (H) (n = 4,4,8,8,8). The survival rate was analyzed using the log-rank (Mantel-Cox) test. I–M Digital photos (I), micro-CT images (J, K) (n = 4), quantification of fibrosis area using the Masson staining (L) (n = 4,4,8,8,7) and HYP assay (M) (n = 4,4,7,7,7) showing the significant reduction of fibrosis after CD5/βLNP-FAPCAR 2.2 therapy. ‘n’ means independent biological replications. The values are the means ± SDs. *P < 0.05. P-value determined by one-way ANOVA followed by Tukey’s multiple comparisons test (BE, H, I, KM). Source data are provided as a Source Data file. Created in BioRender (F).
Fig. 5
Fig. 5. Protein expression of pulmonary fibrosis before and after treatment.
A Proteomic strategies of fibrotic tissues at postoperative day 0, 14 and 28 after BLM administration and PCA analysis of three time instances in BLM mice (n = 4, 4, 4). BD Protein clusters obtained from K-means algorithm and showed in heatmap, in which 4126 DEPs were enriched into 6 clusters. Cluster annotation obtained from GOBP results (B); Dot plot showing top-10 GOBP terms enriched in proteins of cluster 3 (C); and ECM relevant proteins (D) at BLM postoperative day 0, 7 and 14. E Proteomic strategies of saline or CD5/βLNP-FAPCAR 2.2 treatment for BLM mice. PCA analysis showed the significant difference between BLM+Saline and BLM + CD5/βLNP groups (n = 4, 4). F Dot plot showing the top-5 GOBP, GOCC and GOMF enriched terms of downregulated DEPs corresponding to Fig. (E). G Schematic diagram of fibroblast clearance and ECM stiffness regulation. H Representative immunofluorescence images of PATS (Red: KRT8; Green: Sftpc; Blue: DAPI) (Scar bar: 50 μm). I Dot plot of GO enrichment from upregulated DEPs corresponding to Fig. (E). J Network projection of epithelial polarization pathways. ‘n’ means independent biological replications. P-value determined by Fisher’s exact test (C, F, I) and one-way ANOVA (D). (DEP: differentially expressed protein; BP: biological process; CC: cellular component; MF: molecular function). Created in BioRender (A, E, G) .
Fig. 6
Fig. 6. Epithelial polarization after CD5/βLNP-FAPCAR 2.2 therapy.
A Western blot images and quantification of EMT marker genes and Cdc42 protein expressions (n = 4). B Proteomic heatmap for macrophage markers. C Flow cytometry analysis for percentages of macrophage (marked by F4/80) in lung cells (n = 4). D Flow cytometry plot for a comparison of M1/M2 phenotypes between BLM+Saline and CD5/βLNP groups. CD86: marker for M1 phenotype; CD163: marker for M2 phenotype. E Representative immunofluorescence images of macrophages in lung tissue. (Cyan: F4/80; Red: iNOS; Green: CD163; White: DAPI) (Scar bar:20 μm). F, G Representative immunofluorescence images showing the position of polarization factors, Cdc42 and Pkcz(aPKC) in cells (Red: Cdc42; Green: Pkcz; White: DAPI) (Scar bar: 10 μm and 5 μm). H Representative immunofluorescence images of key molecules in regulating epithelial polarization. (Blue: DAPI; Red: Calponin; Green: Pkcz zeta; White: Cldn 5) (Scale bar: 20 μm and 10 μm). I Relative abundance of proteins relevant to angiogenesis (Vegfa, Eng) and carbon dioxide regulation (Ca4, Ca13) (n = 4). ‘n’ means independent biological replications. The values are the means ± SDs. *P < 0.05. P-value determined by one-way ANOVA followed by Tukey’s multiple comparisons test (A, C) and two-tailed unpaired Student’s t-test (I). (EMT: epithelial-mesenchymal transformation). Source data are provided as a Source Data file.
Fig. 7
Fig. 7. Plasticity of alveolar cell for lung regeneration.
A Study design for mouse lung single-cell sequencing (n = 2, independent biological replicates). B Uniform manifold approximation and projection (UMAP) plot for clusters and annotation of impartial captured lung cells. C, D A comparison of cluster components (BLM+Saline vs. BLM + CD5/βLNP-FAPCAR 2.2) (C) and sample distribution of significantly changed clusters (D). E UMAP embedding of fibroblast clusters. F A comparison of fibroblast cell clusters (BLM+Saline vs. BLM + CD5/βLNP-FAPCAR 2.2). G Expression projection of fibrotic and overactivated fibroblast marker genes on UMAP. H, I UMAP plot and annotation for re-clustered alveolar cells (H) and a comparison of cluster states (BLM+Saline vs. BLM + CD5/βLNP-FAPCAR 2.2) (I). J Dot plot showing representative markers for each alveolar cell cluster. K Expression projection of specific alveolar epithelial cell markers. L, M PAPCs marker genes in the entire pulmonary cell clusters (L) and highlighted PAPCs marker genes in UMAP plots that re-clustered with alveolar cells (M). N RNA velocity analysis for clusters including alveolar cells and PAPCs. (PAPCs: proliferating alveolar progenitor cells). Created in BioRender (A).
Fig. 8
Fig. 8. Apoe+ macrophages and effector T cells reconstituted pulmonary immunity.
A UMAP plot for re-clustered macrophage clusters (n = 2, independent biological replicates). B Cell percentages in different clusters. C Highlighted marker genes of alveolar, fibrotic and lipid associated macrophages. D CellphoneDB analysis between macrophage cluster pairs. E The significantly changed receptor-ligand pairs in the cluster 1/3 communication. P-value determined by Bimod test. F, G Pseudotime (F) and RNA velocity (G) analysis for developmental rate of Apoe+ mono-macrophages. HJ UMAP plots for re-clustered T cell clusters (n = 2): clusters annotation (H), a comparison of two groups (BLM+Saline vs. BLM + CD5/βLNP-FAPCAR 2.2) (I) and characteristic gene expression (J). K KEGG enrichment results for a combination of clusters 0,1,6 and a combination of clusters 7,8,9. L, M Pseudotime (L) and Slingshot (M) analysis of differentiation pathways starting from Tn cells. N Expression level of inducible T-Cell costimulatory (Icos) and interleukin-17a (Il17a), which increased with developmental trajectories. (AM: alveolar macrophages; Mono-M: monocyte-derived macrophages; Tn: naïve T cell; DNT: double negative T cell; Tm: memory T cell; Tc: cytotoxic T cell; Th: T helper cell; Treg: regulatory T cells).

Similar articles

Cited by

References

    1. Al-Tamari, H. M. et al. FoxO3 an important player in fibrogenesis and therapeutic target for idiopathic pulmonary fibrosis. EMBO Mol. Med. 10, 276–293 (2018). - PMC - PubMed
    1. Sgalla, G., Biffi, A. & Richeldi, L. Idiopathic pulmonary fibrosis: Diagnosis, epidemiology and natural history. Respirology21, 427–437 (2016). - PubMed
    1. Wolters, P. J., Collard, H. R. & Jones, K. D. Pathogenesis of idiopathic pulmonary fibrosis. Annu Rev. Pathol.9, 157–179 (2014). - PMC - PubMed
    1. Richeldi, L., Collard, H. R. & Jones, M. G. Idiopathic pulmonary fibrosis. Lancet389, 1941–1952 (2017). - PubMed
    1. Parimon, T. et al. Potential mechanisms for lung fibrosis associated with COVID-19 infection. QJM116, 487–492 (2013). - PMC - PubMed

MeSH terms