. 2025 Apr 21;16(1):3531.
doi: 10.1038/s41467-025-58512-z.

Age-related divergence of circulating immune responses in patients with solid tumors treated with immune checkpoint inhibitors

Affiliations

Age-related divergence of circulating immune responses in patients with solid tumors treated with immune checkpoint inhibitors

Chester Kao et al. Nat Commun. .

Abstract

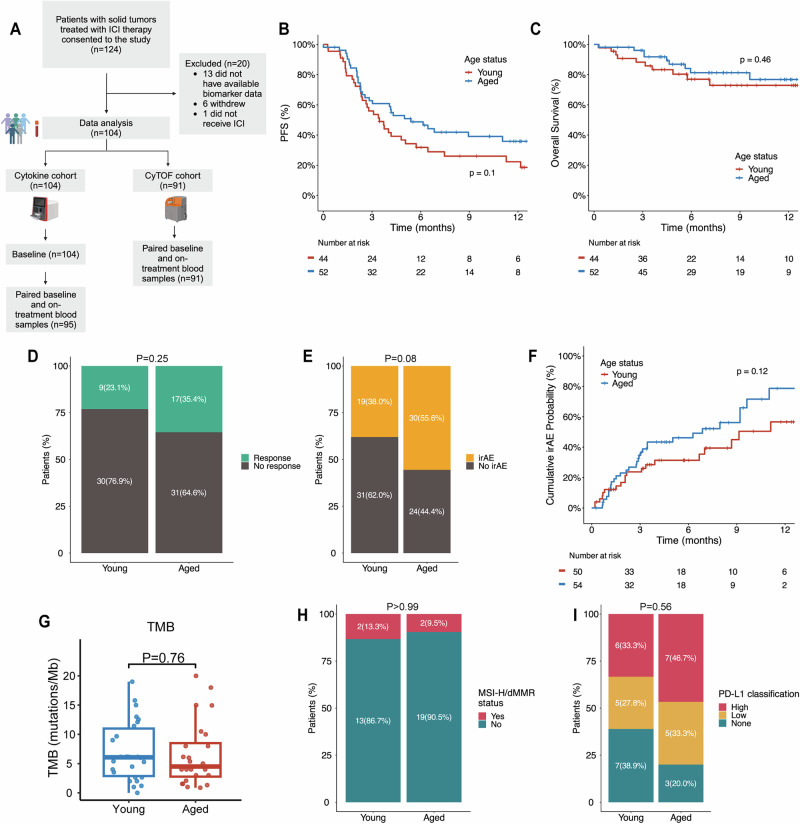
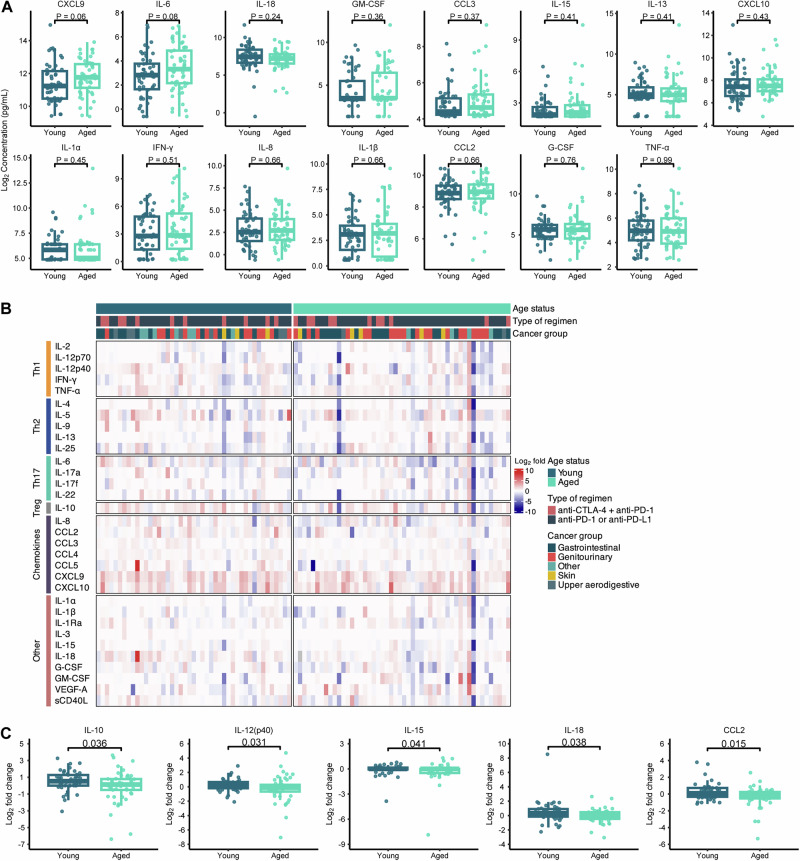
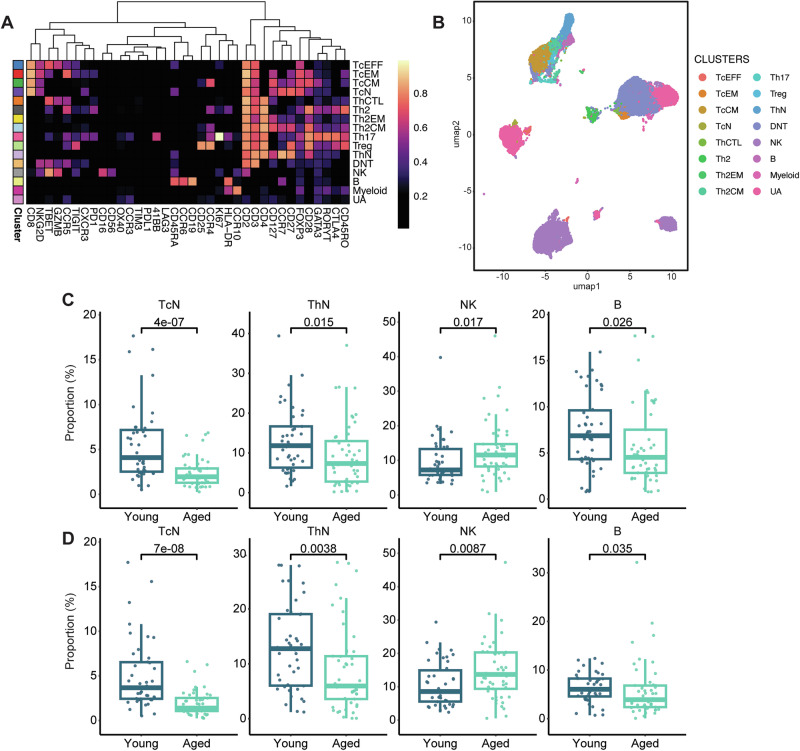
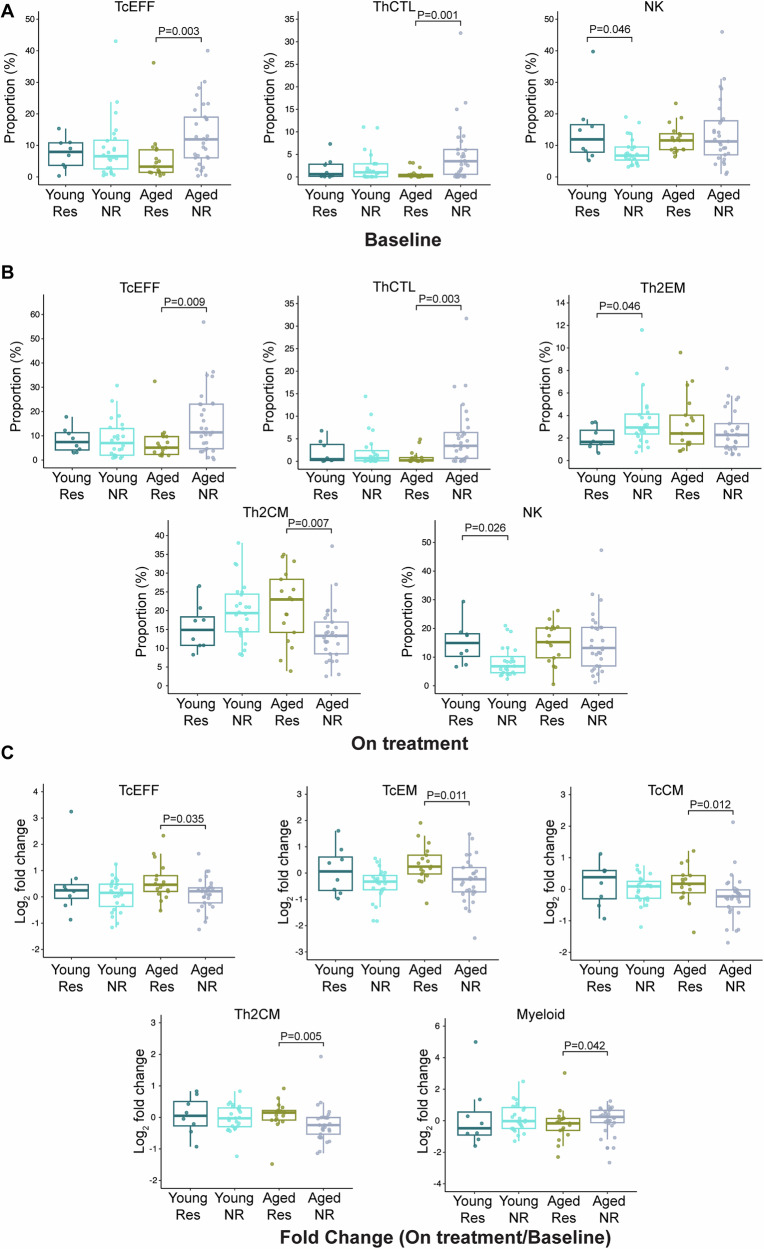
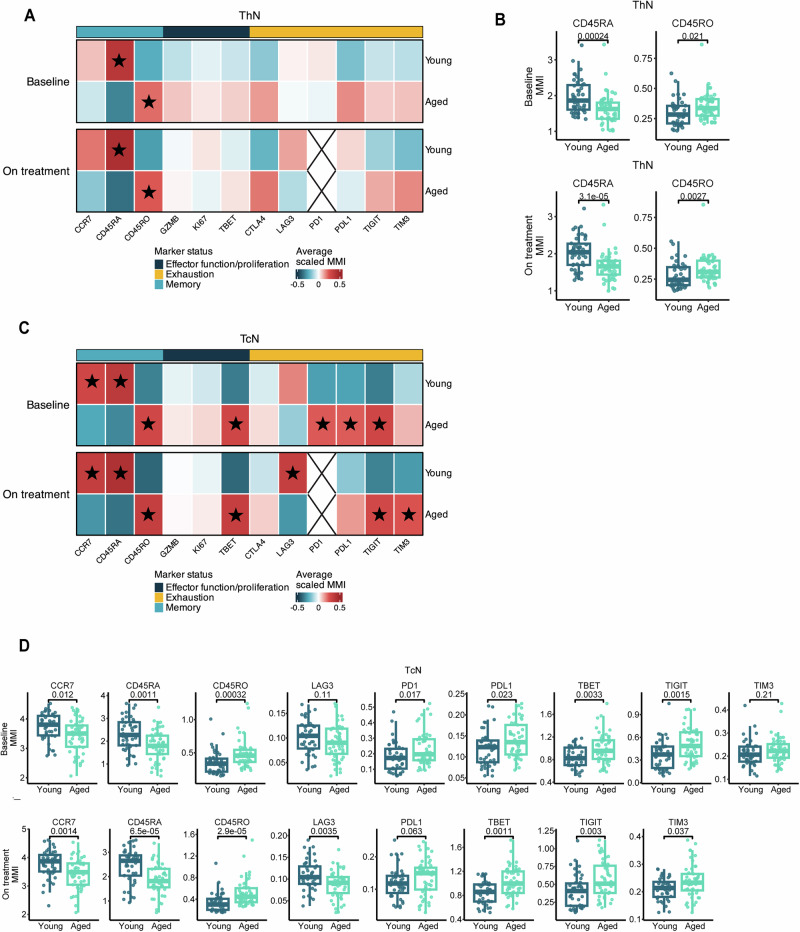
Most new cancer diagnoses occur in patients over the age of 65. The composition and function of the immune system changes with age, but how the aged immune system affects responses to immune checkpoint inhibitor (ICI) cancer therapies remains incompletely understood. Here, using multiplex cytokine assay and high-parameter mass cytometry, we analyze prospectively collected blood samples from 104 cancer patients receiving ICIs. We find aged patients ( ≥ 65-years-old; n = 54) derive similar clinical outcomes as younger patients (n = 50). However, aged, compared to young, patients have divergent immune phenotypes at baseline that persist during ICI therapy, including diminished cytokine responses, reduced pools of naïve T cells with increased relative expression of immune checkpoint molecules, and more robust effector T cell expansion in responders compared to non-responders. Our study provides insights into age-stratified mechanisms of ICI effects while also implying the utility of age-tailored immunotherapeutic approaches.


Conflict of interest statement

Competing interests: E.J.L. reports the following: Consultant/Advisor: Agenus, Bristol-Myers Squibb, CareDx, Eisai, Genentech, HUYA Bioscience International, Immunocore, Instil Bio, IO Biotech, Lyvgen, Merck, Merck KGaA, Natera, Nektar, Novartis, OncoSec, Pfizer, Rain Therapeutics, Regeneron, Replimune, Sanofi-Aventis, Sun Pharma, Syneos Health. Institutional Research Funding: 1104Health, Bristol-Myers Squibb, Haystack Oncology, Merck, Regeneron, Sanofi. Stock: Iovance. E.J.L is supported by Bloomberg~Kimmel Institute for Cancer Immunotherapy, the Marilyn and Michael Glosserman Fund for Basal Cell Carcinoma and Melanoma Research, the Barney Family Foundation, and the Laverna Hahn Charitable Trust. M.B. reports Grant/Research Support (paid to Johns Hopkins): Merck and Consulting: Exelixis, Incyte, AstraZeneca. E.M.J. reports other support from Abmeta and Adventris, personal fees from Dragonfly, Neuvogen, Surge Tx, Mestag, HDTbio, and grants from Lustgarten, Genentech, BMS, NeoTx, and Break Through Cancer. Dr. Elizabeth Jaffee is a founder of and holds equity in Adventris Pharmaceuticals. She also serves as a consultant to the entity. Further, Adventris Pharmaceuticals has licensed a technology described in this study from the Johns Hopkins University. As a result of that agreement, Dr. Jaffee and the University are entitled to royalty distributions related to technology described in the study discussed in this publication. This arrangement has been reviewed and approved by the Johns Hopkins University in accordance with its conflict of interest policies. G.S.C. is an employee and stockholder of Roche. G.S.C. received support for preparation of this manuscript and corresponding travel from Roche. G.S.C. is a co-inventor on patents filed by Genentech/Roche that are related to atezolizumab use. R.M. is an employee and stockholder of F. Hoffman-La Roche, Ltd. R.M. is a co-inventor on patents filed by Genentech/Roche that are related to atezolizumab use. W.J.H. reports patent royalties from Rodeo/Amgen; grants from Sanofi, NeoTX, and Riboscience; speaking/travel honoraria from Exelixis and Standard BioTools. M.Y. has received grant/research support (to Johns Hopkins) from Bristol-Myers Squibb, Incyte and Genentech/Roche; has received honoraria from Genentech/Roche, Exelixis, AstraZeneca, Replimune, Hepion, and Lantheus; and is a cofounder with equity of Adventris. D.J.Z. reports grant support (to Johns Hopkins) and travel from Roche/Genentech, and honoraria from Omni Health Media, Sermo, Atheneum, Escientiq, Deerfield Institute, ZoomRx, and NeuCore Bio. The remaining authors declare no competing interests.

Figures

Fig. 1
Fig. 1. Clinical outcomes, toxicity, and biomarker distribution in young and aged patients with solid malignancies.
A Consort diagram showing study enrollment and downstream data analysis. B Progression free survival (PFS) and (C) overall survival (OS) based on age group in patients with advanced/metastatic disease (n = 96). D Best objective response based on age group in patients with Response Evaluation Criteria in Solid Tumors (RECIST) assessable advanced/metastatic disease (n = 87). E Proportion of patients who developed immune-related adverse events (irAE), divided by age group. F Cumulative irAE for time to first irAE onset, incorporating follow up time, in the total cohort (n = 104). Distribution of three biomarkers: G Tumor mutation burden (TMB) in mutations/megabase (mut/Mb) (n = 50) according to age group. H Proportion of patients with microsatellite instability high/mismatch repair deficient (MSI-H/dMMR) tumors in the young and aged cohorts (n = 36). I PD-L1 classification (n = 33) for patients with available biomarker data. In (G), the box and whisker plot shows the median, interquartile range (IQR), minimum/maximum values, and outliers. Time to event analyses were visualized with Kaplan-Meier curves for PFS and OS and reverse-Kaplan Meier curves for time to irAE onset, and statistical comparisons were performed utilizing two-sided log-ranked test. Statistical comparisons between quantitative measurements were performed using two-sided Wilcoxon rank-sum test and Fisher’s exact test for categorical variables. Portions of this figure were created in BioRender. Leatherman, J. (2025) https://BioRender.com/x33d053. Source data are provided as a Source Data file.
Fig. 2
Fig. 2. Baseline and cytokine responses in aged patients after ICI exposure is unique from young patients.
A Senescence associated secretory phenotype (SASP)-related cytokines at baseline (aged, n = 54; young, n = 50). B Heatmap visualization of log2 transformed fold change of 32 cytokines for patients stratified by age group after start of immune checkpoint inhibitor (ICI) treatment (aged, n = 50; young, n = 45). C Cytokines with statistically different levels between age groups for log2 transformed fold change after ICI treatment (aged, n = 50; young, n = 45). In (A, C), the box and whisker plots show the median, interquartile range (IQR), minimum/maximum values, and additional marking of outliers. Statistical comparisons between quantitative measurements were performed using a two-sided Wilcoxon rank-sum test without adjustment for multiple comparisons. Source data are provided as a Source Data file.
Fig. 3
Fig. 3. Aged patients have a diminished pool of naïve T and B cells and higher NK cells pre- and post-treatment compared to young patients.
A Heatmap showing scaled expression of each cluster identified after CyTOF was performed on pre and post-treatment peripheral blood mononuclear cell (PBMC) samples with a 37-marker panel. A FlowSOM algorithm was used to generate metaclusters which were annotated into a final 15 clusters (immune groups). Scaled expression profile for each cluster is shown. B UMAP plots visualizing the annotated clusters (500 cells per sample). Proportion of the total cells selected major immune groups at (C) baseline and (D) on treatment (total n = 91, aged n = 49, young n = 42). In (C, D), the box and whisker plots show the median, interquartile range (IQR), minimum/maximum values, and additional marking of outliers. Statistical comparisons between quantitative measurements were performed using a two-sided Wilcoxon rank-sum test without adjustment for multiple comparisons. Source data are provided as a Source Data file.
Fig. 4
Fig. 4. Aged patients have a lower effective pool of adaptive immune compartments but an increase in effector/memory T cell compartments in immune checkpoint inhibitor responders.
The significantly different proportions of immune clusters between responders (Res) and non-responders (NR) within each age group at (A) baseline (B) on treatment. (C) Log2 transformed fold change of immune cluster proportion between responders and non-responders within each age group. In total, n = 78 patients had advanced/metastatic and RECIST assessable disease which consisted of aged responders (n = 17), aged non-responders (n = 29), young responders (n = 8), and young non-responders (n = 24). Box and whisker plots show the median, interquartile range (IQR), minimum/maximum values, and additional marking of outliers. Statistical comparisons between quantitative measurements were performed using a two-sided Wilcoxon rank-sum test without adjustment for multiple comparisons. Source data are provided as a Source Data file.
Fig. 5
Fig. 5. Naïve T cells in aged patients have a unique phenotype compared to young patients before and after ICI treatment.
Heatmaps were generated for the average scaled mean metal intensity (MMI) between aged (n = 49) and young patients (n = 42) for 12 markers of interest related to T cell memory, effector/proliferation function, and exhaustion for 15 unique immune clusters at baseline and on treatment. Scaled MMIs were calculated for each individual marker within each immune cluster as defined from the annotation clustering from Fig. 3A. Scaling was performed for visualization purposes to highlight the most divergent markers by age group, and formal statistical comparisons were performed with a two-sided Wilcoxon rank-sum test on non-scaled MMIs without adjustment for multiple comparisons, with statistically significant comparisons (P < 0.05) indicated on the heatmaps with a star in the box of the more highly expressed marker along with absolute MMIs on box and whisker plots showing the median, interquartile range (IQR), minimum/maximum values, and additional marking of outliers. Results for ThN (A, B) and TcN (C, D) are presented. Analysis of PD-1 (PD1) expression in post-treatment samples was not included due to use of a competitive antibody as described in the methods. represents naïve immune clusters as labeled. Source data are provided as a Source Data file.
Fig. 6
Fig. 6. Analysis of integrated cytokine and cellular immune profiles in young and aged patients treated with ICI therapy.
Principal component (PC) analysis of low-dimensional representations of immune profiles performed by integrating available cytokine and immune cell type abundance data on a per patient basis across the clinical cohort (n = 17 aged responders, 29 aged non-responders, 8 young responders, 24 young non-responders for (A, B) and n = 17 aged responders, 28 aged non-responders, 8 young responders, and 24 young non-responders for (C, D). Patients without annotated clinical responses were not included in this analysis. Differences in average component scores were evaluated to identify the two principal axes that best facilitated comparisons based on age or response. Plots are presented baseline (A, B) and first on treatment (C, D) and for PCs for either age (left side) or immune checkpoint inhibitor (ICI) response status (right side). Source data are provided as a Source Data file.

Similar articles

Cited by

References

    1. Cancer of Any Site - Cancer Stat Facts. SEERhttps://seer.cancer.gov/statfacts/html/all.html.
    1. Pallis, A. G. et al. EORTC elderly task force position paper: Approach to the older cancer patient. Eur. J. Cancer46, 1502–1513 (2010). - PubMed
    1. Berger, N. A. et al. Cancer in the Elderly. Trans. Am. Clin. Climatol. Assoc.117, 147–156 (2006). - PMC - PubMed
    1. Baltussen, J. C. et al. Chemotherapy-Related Toxic Effects and Quality of Life and Physical Functioning in Older Patients. JAMA Netw. Open6, e2339116 (2023). - PMC - PubMed
    1. Repetto, L. Greater risks of chemotherapy toxicity in elderly patients with cancer. J. Support. Oncol.1, 18–24 (2003). - PubMed

LinkOut - more resources