. 2025 Apr 21;15(1):13687.
doi: 10.1038/s41598-025-97269-9.

Integrated multiomics analysis identifies potential biomarkers and therapeutic targets for autophagy associated AKI to CKD transition

Affiliations

Integrated multiomics analysis identifies potential biomarkers and therapeutic targets for autophagy associated AKI to CKD transition

Yaojun Wang et al. Sci Rep. .

Abstract

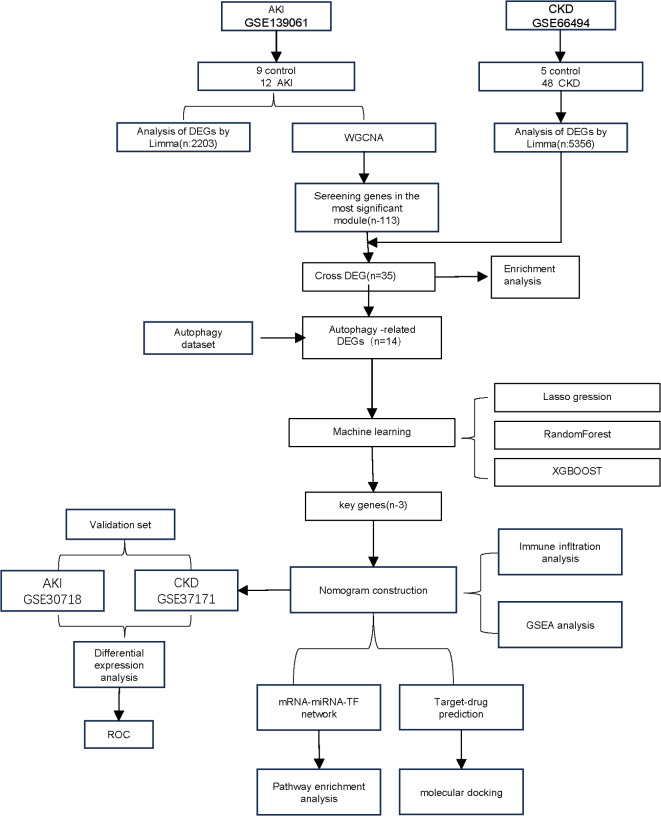
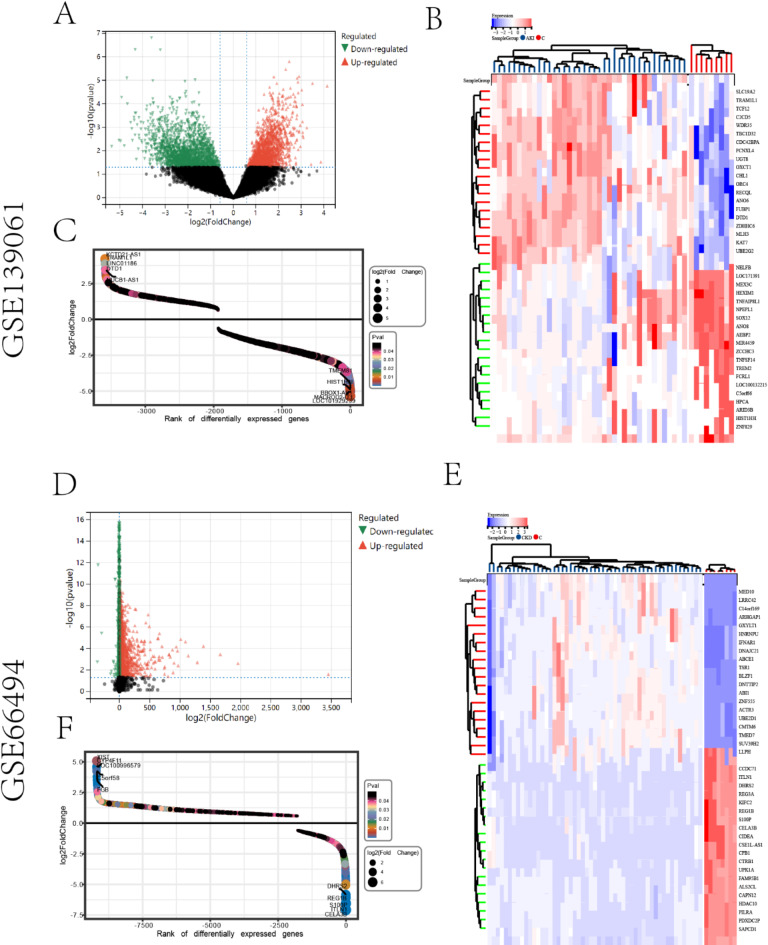
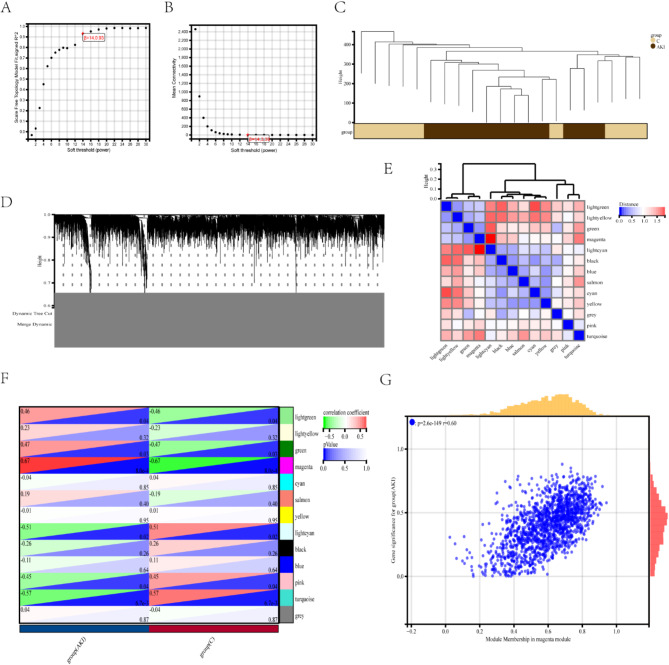
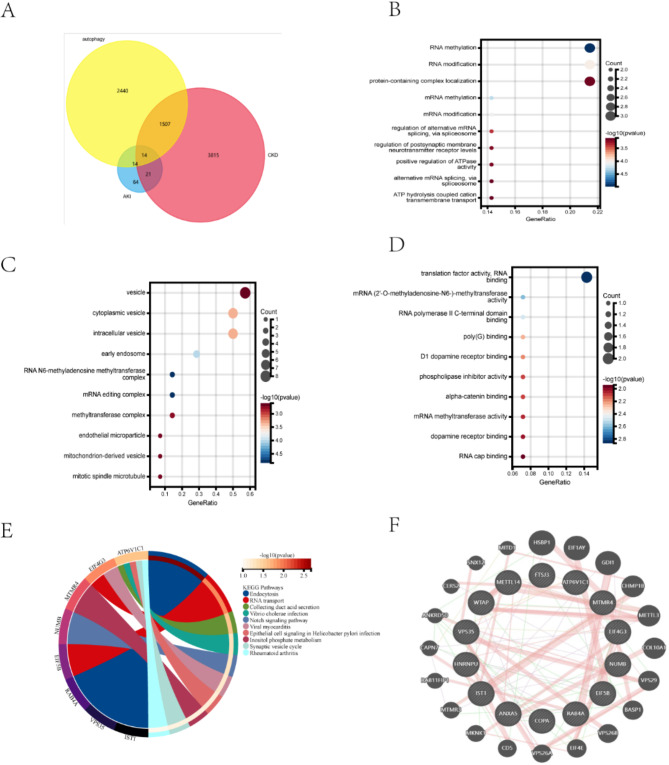
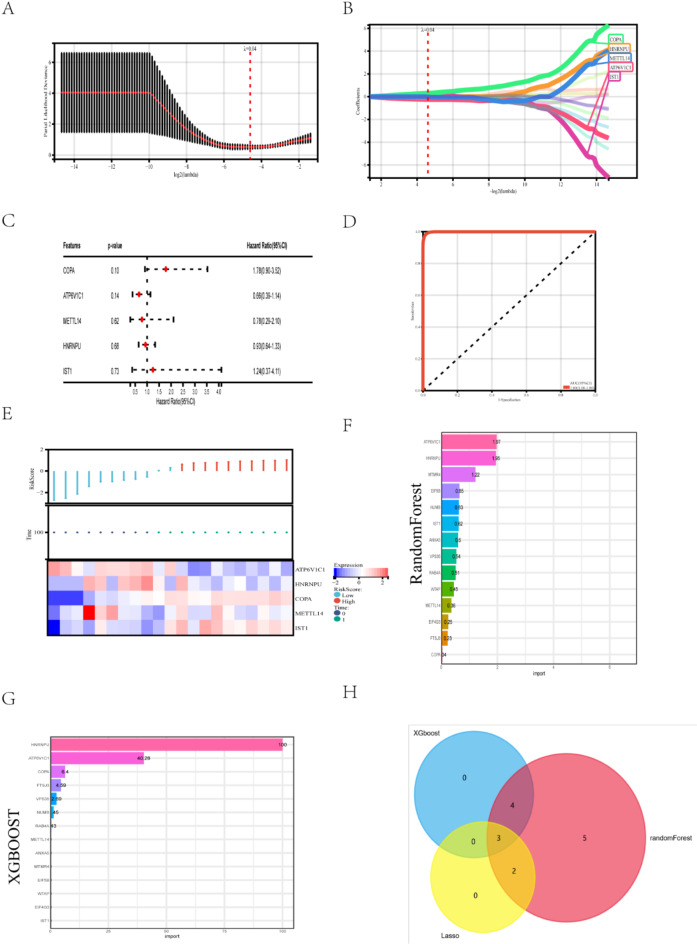
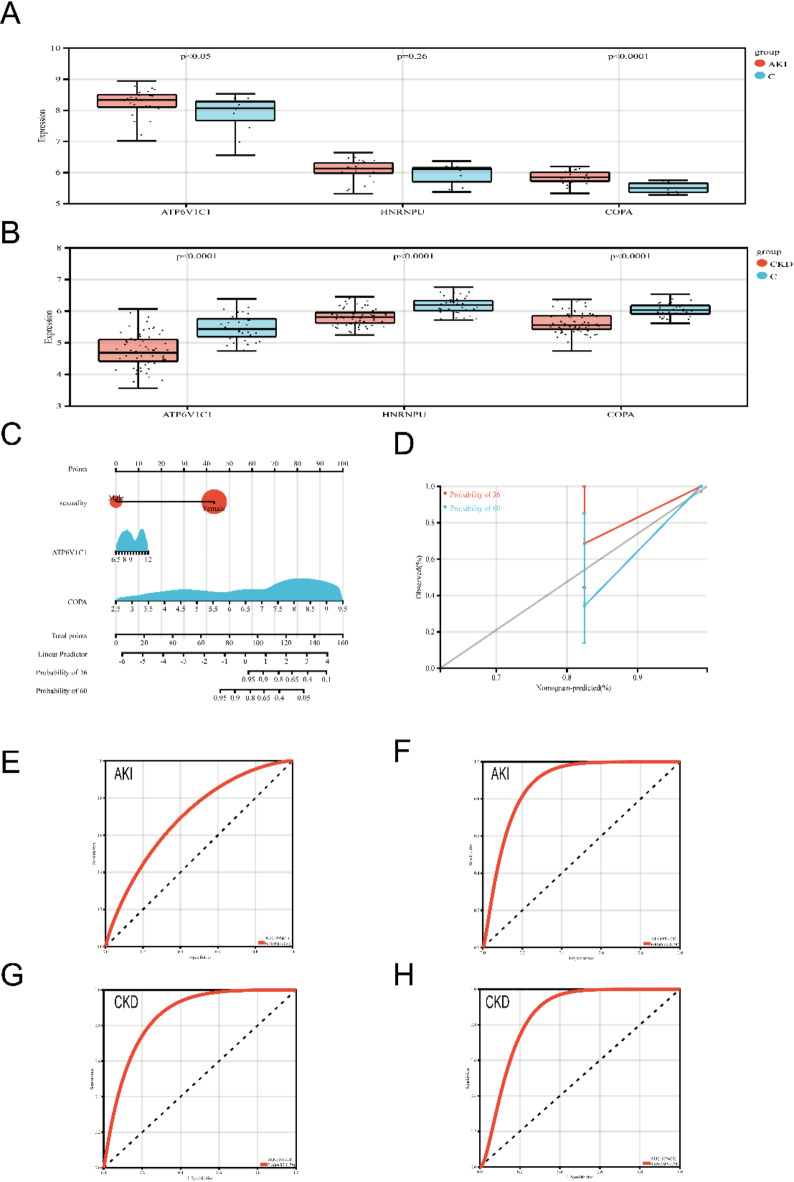
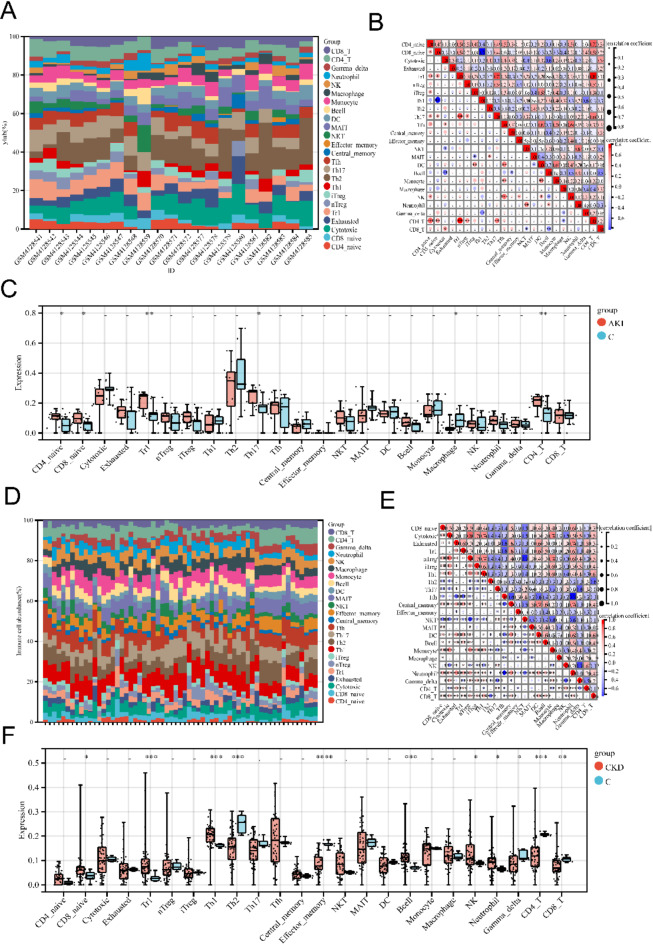
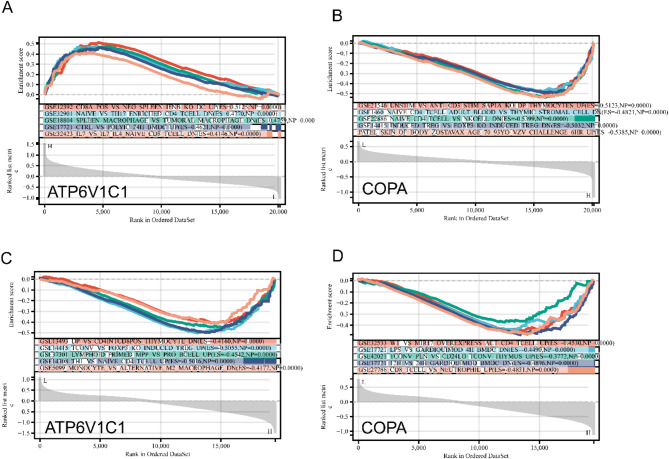
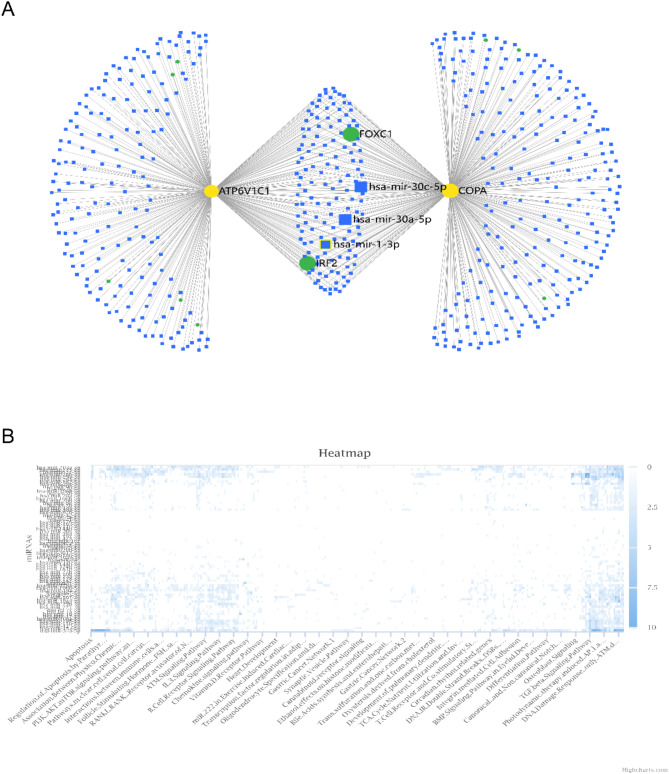
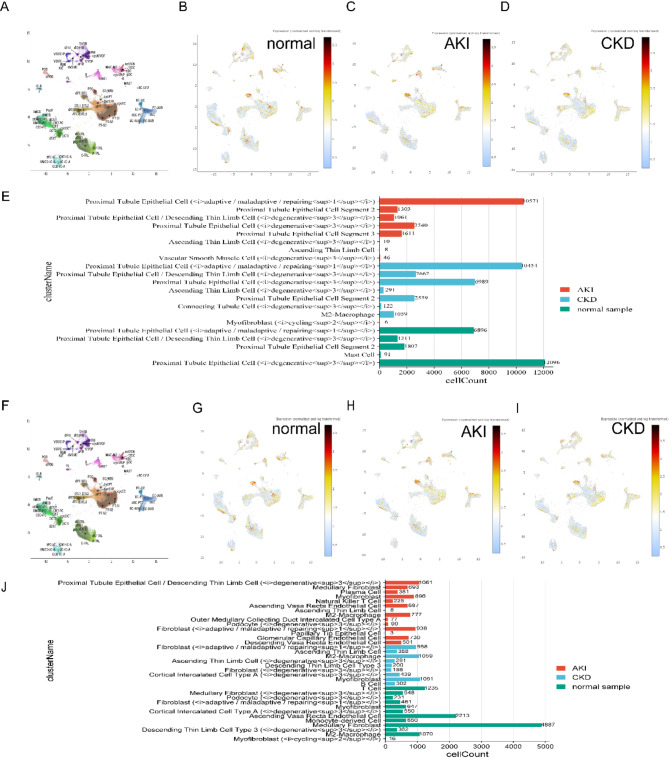
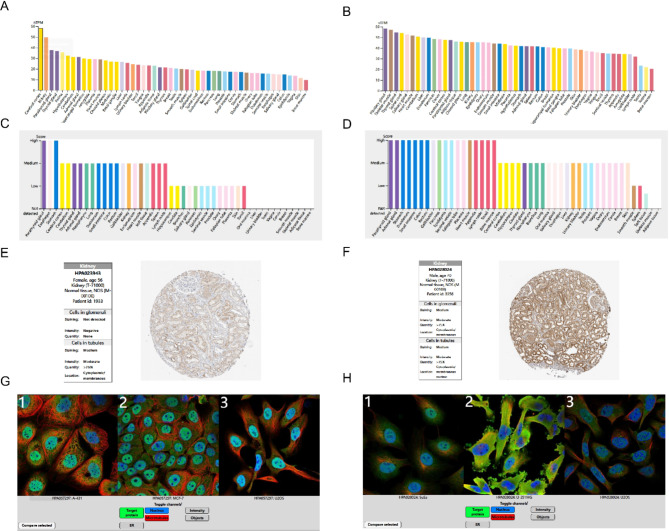
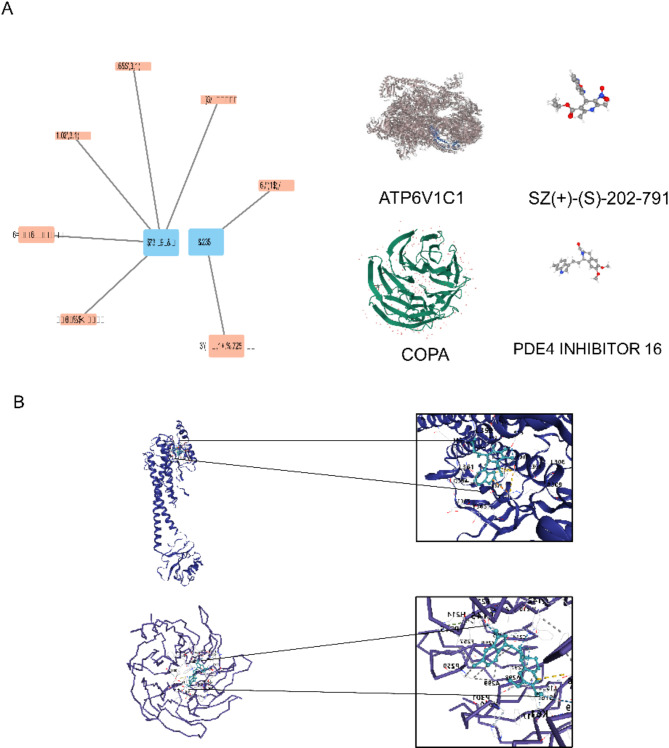
This study explored the relationship between acute kidney injury (AKI) and chronic kidney disease (CKD), focusing on autophagy-related genes and their immune infiltration during the transition from AKI to CKD. We performed weighted correlation network analysis (WGCNA) using two microarray datasets (GSE139061 and GSE66494) in the GEO database and identified autophagy signatures by Gene Ontology (GO) and Kyoto Encyclopedia of Genes and Genomes (KEGG), and GSEA enrichment analysis. Machine learning algorithms such as LASSO, random forest, and XGBoost were used to construct the diagnostic model, and the diagnostic performance of GSE30718 (AKI) and GSE37171 (CKD) was used as validation cohorts to evaluate its diagnostic performance. The study identified 14 autophagy candidate genes, among which ATP6V1C1 and COPA were identified as key biomarkers that were able to effectively distinguish between AKI and CKD. Immune cell infiltration and GSEA analysis revealed immune dysregulation in AKI, and these genes were associated with inflammation and immune pathways. Single-cell analysis showed that ATP6V1C1 and COPA were specifically expressed in AKI and CKD, which may be related to renal fibrosis. In addition, drug prediction and molecular docking analysis proposed SZ(+)-(S)-202-791 and PDE4 inhibitor 16 as potential therapeutic agents. In summary, this study provides new insights into the relationship between AKI and CKD and lays a foundation for the development of new treatment strategies.

Keywords: AKI; CKD; Autophagy; Biomarkers; Machine learning.


Conflict of interest statement

Declarations. Competing interests: The authors declare no competing interests. Ethics statement: This study does not involve human and animal experiments and does not require ethical approval.

Figures

Fig. 1
Fig. 1
Workflow of the analysis.
Fig. 2
Fig. 2
DEGs between AKI, CKD, and controls. (A, D) Genes that are significantly up- and down-regulated in acute kidney AKI and CKD are shown in red and green in the graphs, respectively. (B, E) Heatmap of the top 40 differentially expressed genes in AKI and CKD conditions, where blue denotes lowly expressed genes and red denotes highly expressed genes. The distribution of differential genes, including the number of up-regulated and down-regulated genes, is depicted in the scatterplot. (C, F). The vertical coordinate shows the fold change of differential genes, while the horizontal coordinate shows the number of differential genes.
Fig. 3
Fig. 3
The DEGs identified in AKI using WGCNA. (A, B) The soft threshold of β = 14 was selected based on scale independence and average connectivity. (C) A hierarchical clustering dendrogram of AKI and control samples. (D) An adjacency heatmap of characteristic genes. (E) Co-expression modules are represented in different colors below the gene tree. (F) A correlation heatmap depicting the association between module genes and AKI, with the “magenta” module displaying the highest correlation. The upper left triangle uses color to denote the correlation coefficient, while the lower right triangle uses color to indicate the p-value. (G) A graph showing the correlation of “magenta” module genes and AKI.
Fig. 4
Fig. 4
Functional enrichment analysis of autophagy-related genes. (A) Differential genes in CKD were identified by Limma, modular genes in AKI were identified by WGCNA, and the intersection of the autophagy gene set included 14 genes as shown in the Venny diagram. (BD) GO analysis covers biological processes, cellular components, and molecular functions, with the vertical axis indicating GO terms and the horizontal axis indicating the proportion of genes involved in the corresponding GO process. The size of the circle corresponds to the number of genes and the shade of the color indicates the p-value. (E) KEGG pathway analysis results, different colors indicate different important pathways and their related genes. (F) The GeneMANIA website was used to identify functionally similar genes and to build a PPI network. 20 functionally similar genes are located in the outer circle, while 14 hub genes are located in the inner circle. The color of the nodes correlates with protein function, while the line color represents the type of protein interaction.”
Fig. 5
Fig. 5
Three machine learning algorithms identify key diagnostic genes from autophagy-related genes. (A, B) Key genes identified by the LASSO regression with a total of 5 genes considered suitable for diagnosis. (C) Forest plot showing the results of multifactorial analysis of COX based on 5 key genes. (D) Validation of the diagnostic efficacy of the key genes by ROC (E) Risk score heatmap depicting the high- and low-risk differential expression profiles of the 5 genes in the training cohort. (F) The results of the Random Forest algorithm are demonstrated by scoring. (G) Results of the XGBOOST algorithm are shown by scoring. (H) Key genes obtained through the overlap of the three algorithms are shown as Venny plots.
Fig. 6
Fig. 6
Validation of key genes, construction of Nomogram, and evaluation of its diagnostic value. (A, B) Differential expression of candidate genes was validated in the validation sets of AKI and CKD. (C) Nomogram construction of the diagnostic model. (D) Calibration curve of the diagnostic model. (EH) Diagnostic efficacy of candidate genes in the model validated by ROC curve.
Fig. 7
Fig. 7
Immune infiltration analysis of AKI and CKD versus controls (A, D) Superimposed bar graphs showing the proportions of the 24 immune cell types in all samples. (B, E) Correlation heatmap of the 24 immune cell types. Red color indicates positive correlation, blue color indicates negative correlation, and numbers in the graph represent correlation coefficients. (C, F) Comparison of the proportions of immune cells in AKI and CKD and controls. Significance is indicated by *p < 0.05; p < 0.01; *p < 0.001.
Fig. 8
Fig. 8
GSEA immune pathway analysis of candidate genes. (A, C) GSEA analysis of candidate genes in AKI. (C, D) GSEA analysis of candidate genes in CKD. The top box represents the enrichment score of the pathway, the middlebox represents the immune pathway associated with the candidate gene, and the bottom box represents the expression level of the candidate gene.
Fig. 9
Fig. 9
Construction of miRNA-mRNA-TF network by candidate genes and functional enrichment analysis of miRNAs. (A) miRNA-mRNA-TF network constructed based on 2 candidate genes. Yellow circles represent candidate genes, blue squares represent predicted miRNAs and green circles represent predicted TFs. (B) Pathway analysis of predicted miRNAs through online platforms is shown in the heatmap.
Fig. 10
Fig. 10
Differential expression of candidate genes in single cells. (A) Cellular compartmentalization of ATP6V1C1 in the single-cell dataset. (B) Expression distribution of ATP6V1C1 in normal tissues. (C) Distribution of ATP6V1C1 expression in AKI tissues. (D) Expression distribution of ATP6V1C1 in CKD tissues. (E) Multiple histograms demonstrating the differences in cellular expression of ATP6V1C1 in normal tissues, AKI, and CKD. (F) Cellular fractionation of COPA in the single-cell dataset. (G) Distribution of COPA expression in normal tissues. (H) Distribution of COPA expression in AKI tissues. (I) Distribution of COPA expression in CKD tissues. (J) Multiple sets of bar graphs demonstrating the differences in cellular expression of COPA in normal tissues, AKI, and CKD.
Fig. 11
Fig. 11
Expression and localization of ATP6V1C1 and COPA. (A, B) RNA and protein expression levels of ATP6V1C1 and COPA in human tissues. (C, D) Immunohistochemical analysis of ATP6V1C1 and COPA proteins in kidney. (E, F) Immunofluorescence localization analysis of ATP6V1C1 and COPA in different cell lines. Green: ATP6V1C1 and COPA proteins; blue: nuclei; red: microtubules.
Fig. 12
Fig. 12
Prediction and molecular docking of therapeutic drugs for candidate genes. (A) Prediction of targeting drugs for candidate genes through an online platform visualized using Cytoscape software. Blue squares represent candidate genes and orange squares represent drugs. (B) Molecular docking of ligand-protein and receptor drug crystals and their visualization.

Similar articles

References

    1. Bucaloiu, I. D. et al. Increased risk of death and de Novo chronic kidney disease following reversible acute kidney injury[J]. Kidney Int.81 (5), 477–485 (2012). - PubMed
    1. Turgut, F., Awad, A. S. & Abdel-Rahman, E. M. Acute kidney injury: medical causes and Pathogenesis[J]. J. Clin. Med., 12(1). (2023). - PMC - PubMed
    1. Menon, S., Symons, J. M. & Selewski, D. T. Acute kidney Injury[J]. Pediatr. Rev.44 (5), 265–279 (2023). - PubMed
    1. Chawla, L. S. et al. Acute kidney injury and chronic kidney disease as interconnected syndromes[J]. N Engl. J. Med.371 (1), 58–66 (2014). - PMC - PubMed
    1. See, E. J. et al. Long-term risk of adverse outcomes after acute kidney injury: a systematic review and meta-analysis of cohort studies using consensus definitions of exposure[J]. Kidney Int.95 (1), 160–172 (2019). - PubMed

MeSH terms