

Arterial pulsations and transmantle pressure synergetically drive glymphatic flow
- PMID: 40258946
- PMCID: PMC12012223
- DOI: 10.1038/s41598-025-97631-x
Arterial pulsations and transmantle pressure synergetically drive glymphatic flow
Abstract
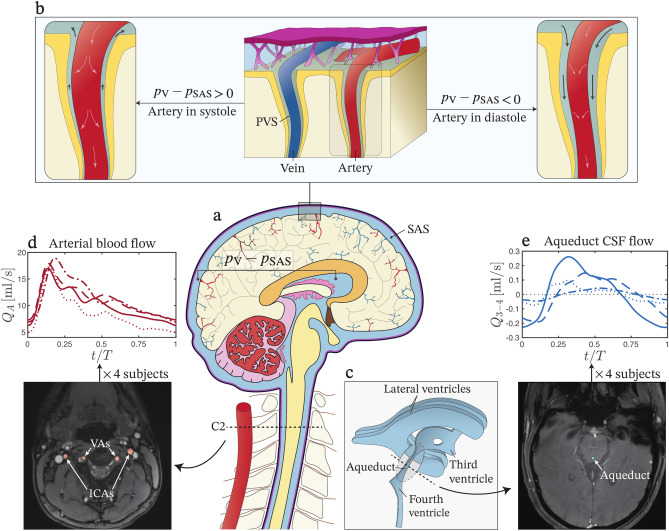
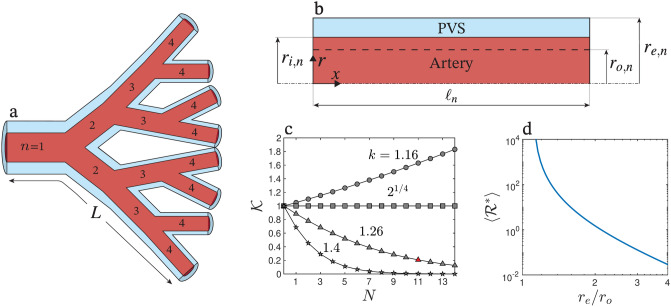
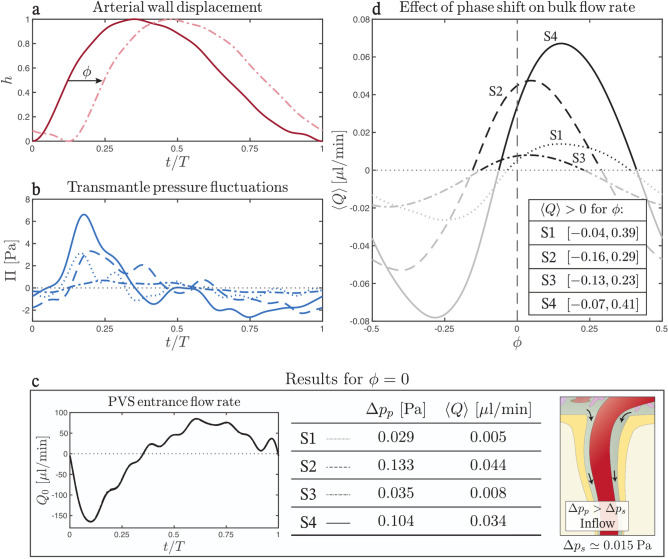
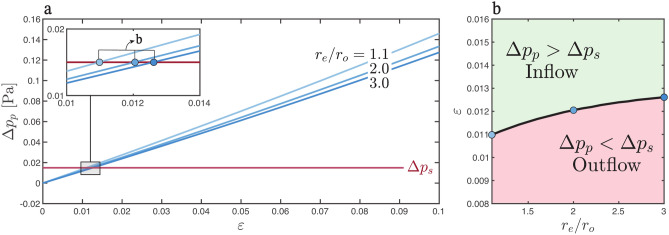
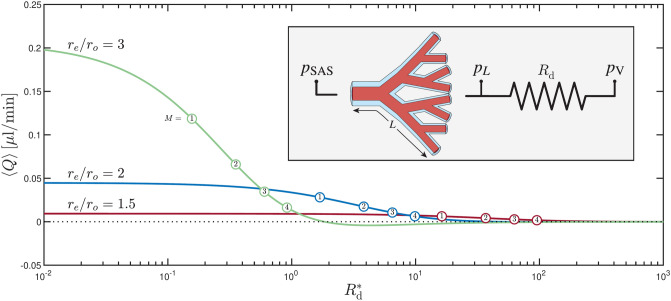
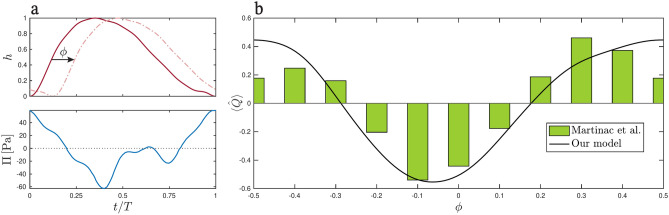
Clearance of waste material from the brain by the glymphatic system results from net flow of cerebrospinal fluid (CSF) through perivascular spaces surrounding veins and arteries. In periarterial spaces, this bulk flow is directed from the cranial subarachnoid space towards the brain's interior. The precise pumping mechanism explaining this net inflow remains unclear. While in vivo experiments have shown that the pulsatile motion in periarterial spaces is synchronized with arterial pulsations, peristalsis alone has been deemed insufficient to explain bulk flow. In this study we examine an alternative mechanism based on the interaction between arterial pulsations and fluctuations in transmantle pressure. Previously studied using pressure data from a hydrocephalus patient, this mechanism is analyzed here in healthy subjects using in vivo flow measurements obtained via phase-contrast magnetic resonance imaging. Arterial pulsations are derived from flow-rate measurements of arterial blood entering the cranial cavity, while transmantle-pressure fluctuations are computed using measurements of CSF flow in the cerebral aqueduct. The two synchronized waveforms are integrated into a canonical multi-branch model of the periarterial spaces, yielding a closed-form expression for the bulk flow. The results confirm that the dynamic interactions between arterial pulsations and transmantle pressure are sufficient to generate a positive inflow along periarterial spaces.
© 2025. The Author(s).
Conflict of interest statement
Declarations. Competing interests: The authors declare no competing interests.
Figures
Similar articles
-
Cerebrospinal fluid circulation and associated intracranial dynamics. A radiologic investigation using MR imaging and radionuclide cisternography.Acta Radiol Suppl. 1993;386:1-23. Acta Radiol Suppl. 1993. PMID: 8517189
-
Phase offset between arterial pulsations and subarachnoid space pressure fluctuations are unlikely to drive periarterial cerebrospinal fluid flow.Biomech Model Mechanobiol. 2021 Oct;20(5):1751-1766. doi: 10.1007/s10237-021-01474-0. Epub 2021 Jul 17. Biomech Model Mechanobiol. 2021. PMID: 34275063
-
Flow of cerebrospinal fluid is driven by arterial pulsations and is reduced in hypertension.Nat Commun. 2018 Nov 19;9(1):4878. doi: 10.1038/s41467-018-07318-3. Nat Commun. 2018. PMID: 30451853 Free PMC article.
-
Amplitude and phase of cerebrospinal fluid pulsations: experimental studies and review of the literature.J Neurosurg. 2006 May;104(5):810-9. doi: 10.3171/jns.2006.104.5.810. J Neurosurg. 2006. PMID: 16703889 Review.
-
Are Hygromas and Hydrocephalus After Decompressive Craniectomy Caused by Impaired Brain Pulsatility, Cerebrospinal Fluid Hydrodynamics, and Glymphatic Drainage? Literature Overview and Illustrative Cases.World Neurosurg. 2019 Oct;130:e941-e952. doi: 10.1016/j.wneu.2019.07.041. Epub 2019 Jul 11. World Neurosurg. 2019. PMID: 31302278 Review.
References
-
- Zeppenfeld, D. M. et al. Association of perivascular localization of aquaporin-4 with cognition and Alzheimer disease in aging brains. JAMA Neurol.74, 91–99 (2017). - PubMed
-
- Ghali, M. G. Z., Marchenko, V., Yaşargil, M. G. & Ghali, G. Z. Structure and function of the perivascular fluid compartment and vertebral venous plexus: Illumining a novel theory on mechanisms underlying the pathogenesis of alzheimer’s, cerebral small vessel, and neurodegenerative diseases. Neurobiol. Dis.144, 105022 (2020). - PubMed
MeSH terms
Grants and funding
LinkOut - more resources
Full Text Sources
