. 2025 Apr 21;15(1):13701.
doi: 10.1038/s41598-025-98409-x.

Spatial regulation of chrysosplenetin on amino acid homeostasis linked to artemisinin resistance in Plasmodium berghei K173 based on targeted metabolomics

Affiliations

Spatial regulation of chrysosplenetin on amino acid homeostasis linked to artemisinin resistance in Plasmodium berghei K173 based on targeted metabolomics

Jinjing Xu et al. Sci Rep. .

Abstract

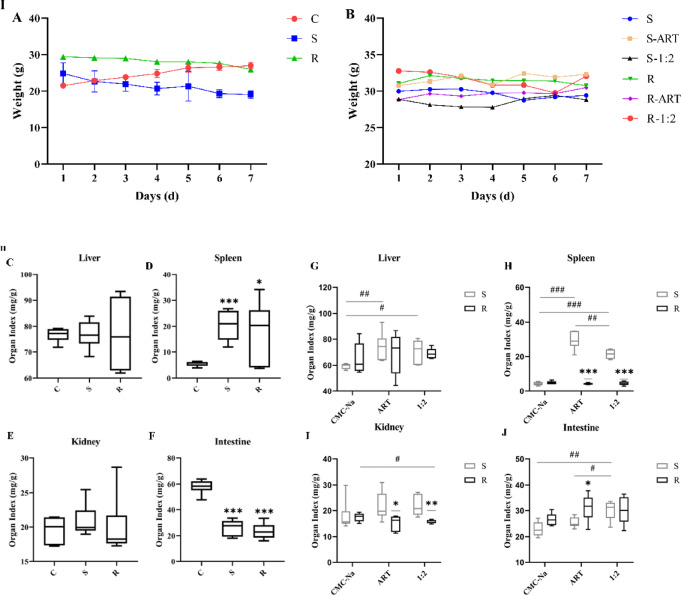
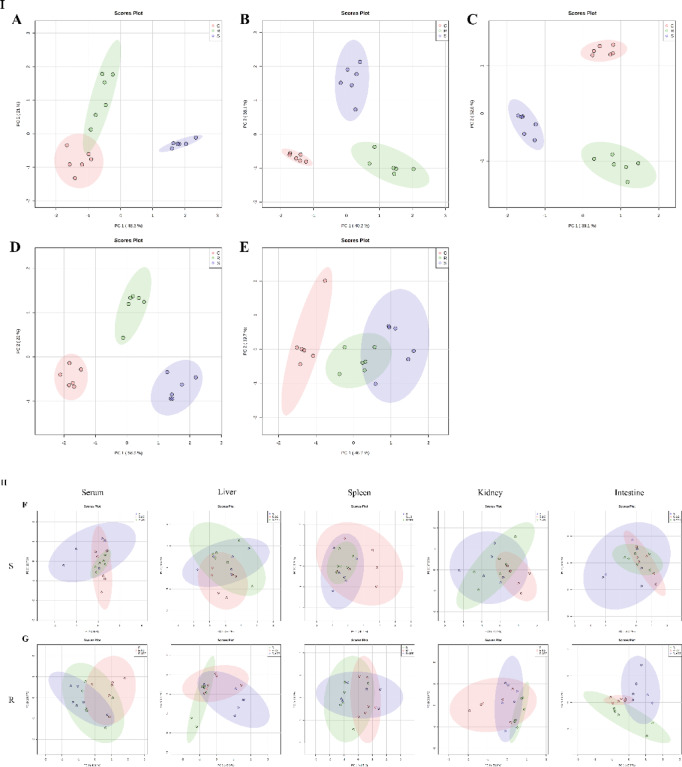
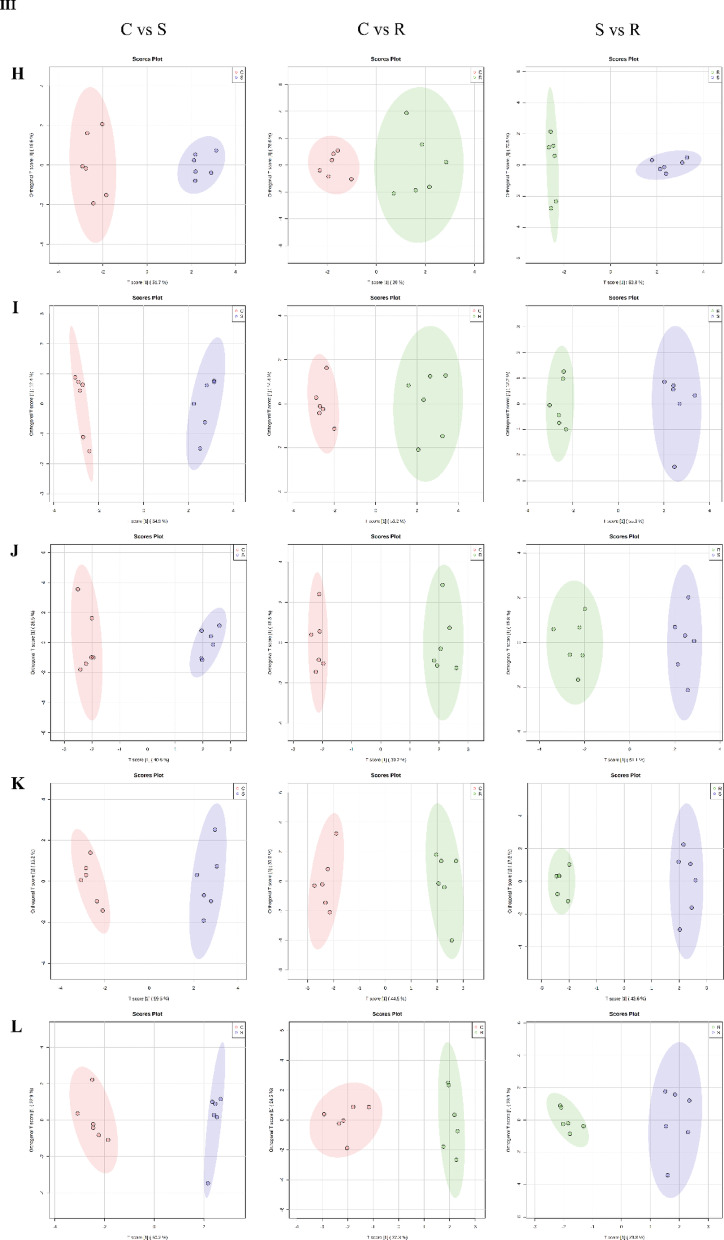
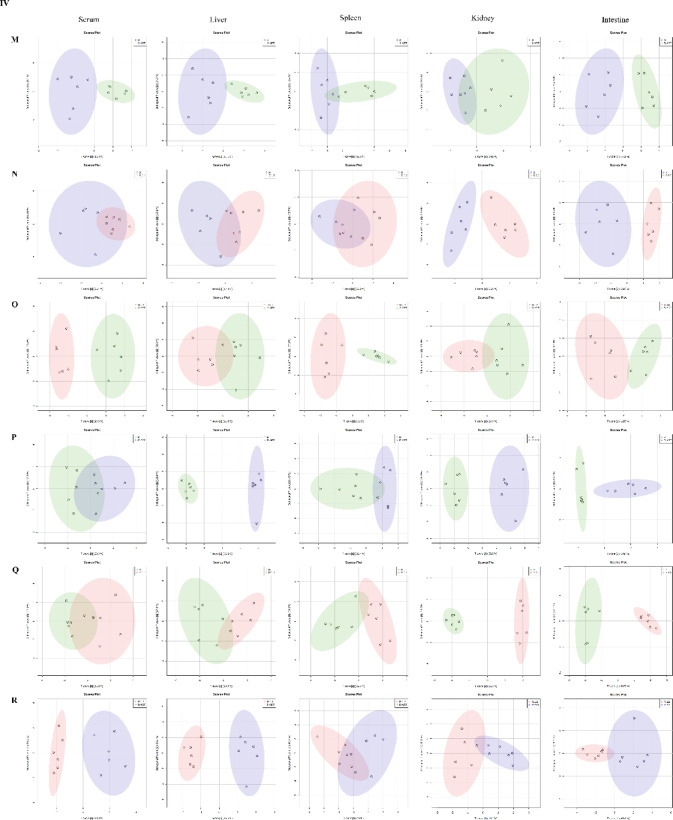
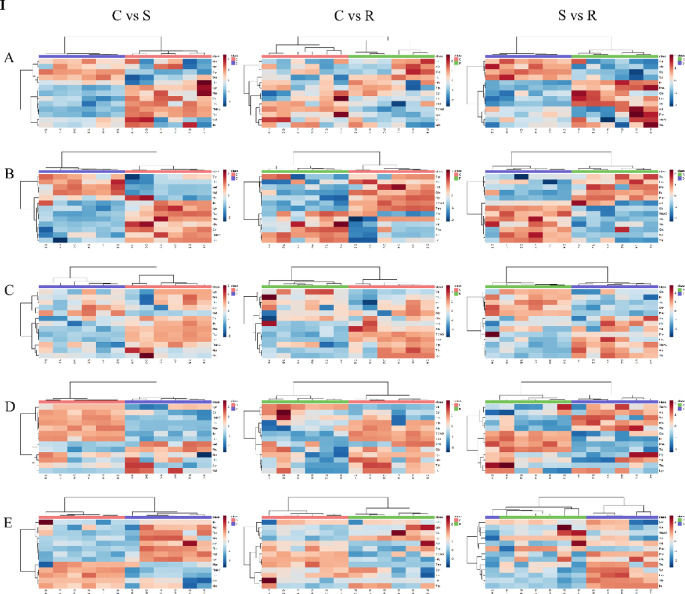
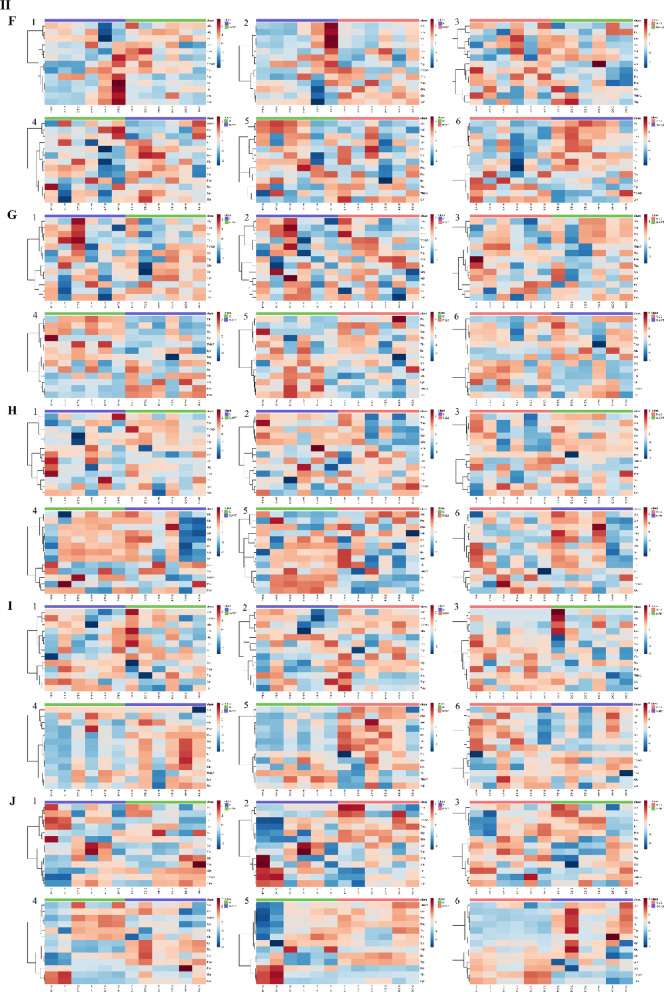
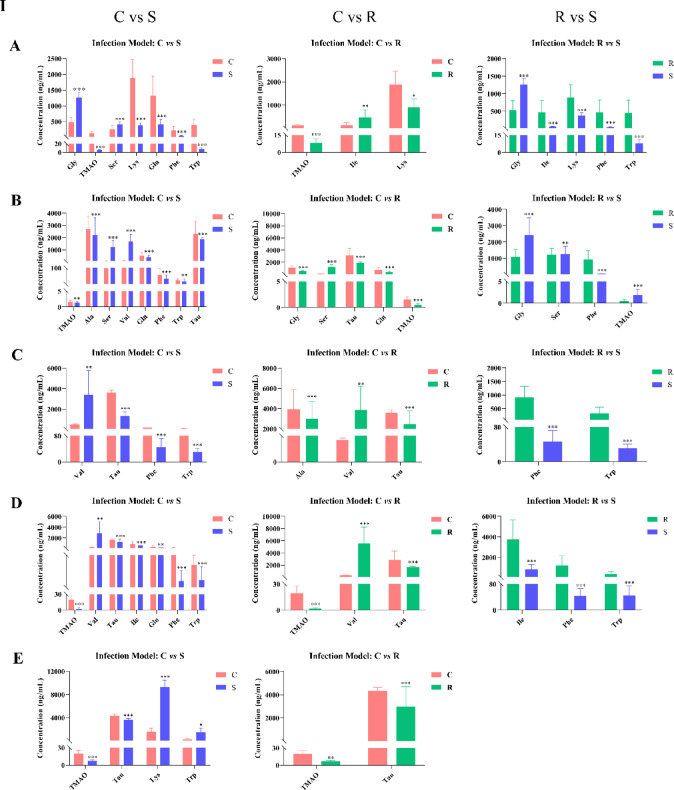
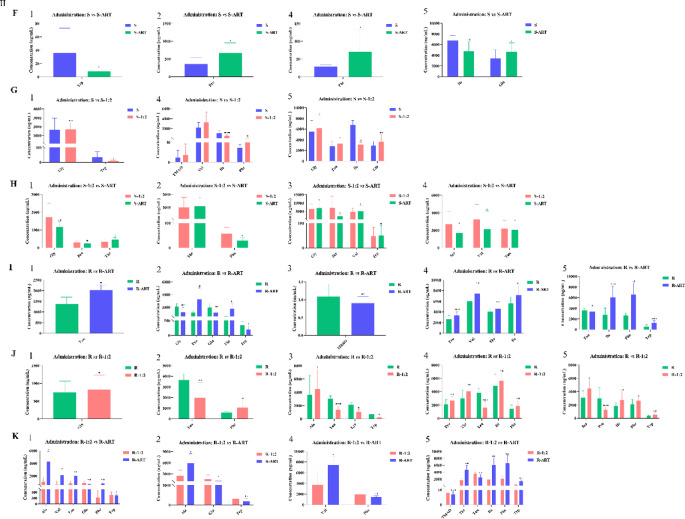
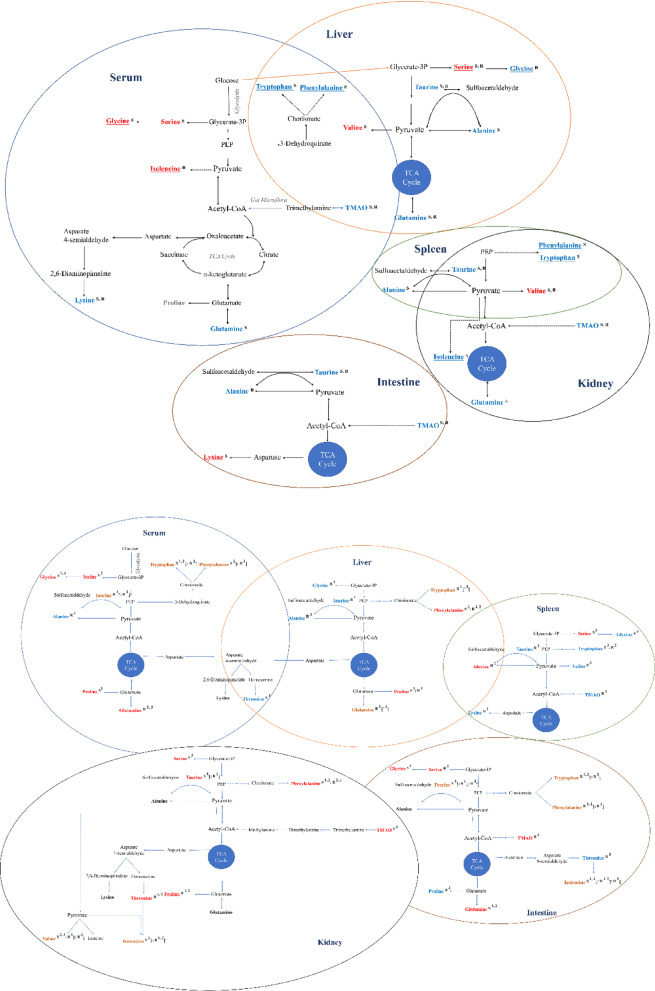
Chrysosplenetin, a polymethoxy flavonol purified in our laboratory from the waste products generated during the industrial extraction of artemisinin, has been previously demonstrated to be a potential inhibitor of artemisinin resistance. Based on NMR-untargeted metabolomics, one of its hypothesized mechanisms of action is associated with the regulation of amino acid metabolism. In this study, we further quantified the key amino acids using LC-MS/MS targeted metabolomics and screened out the perturbed metabolic pathway network, which was characterized by tissue-specific differences. As a result, among the commonly and uniquely altered metabolites, increased levels of phenylalanine, tryptophan, and isoleucine were detected in the serum and various organs of the resistant groups. Interestingly, while the individual use of chrysosplenetin or artemisinin elevated the contents of these amino acids, their combination led to a significant down-regulation of these amino acids in the serum and intestines. Therefore, chrysosplenetin has the potential to act as a restorer of amino acid metabolism homeostasis, which is associated with artemisinin resistance in Plasmodium berghei K173.

Keywords: Amino acids; Artemisinin resistance; Chrysosplenetin; LC-MS/MS based targeted metabolomics; TMAO.


Conflict of interest statement

Declarations. Competing interests: The authors declare no competing interests. Ethical approval: The protocol was submitted to and approved by the University Ethics Committee (YXYLL-2021-10). Animal experiment: All experiment animals adhere to the ARRIVE guidelines.

Figures

Fig. 1
Fig. 1
Body weights (I) and organ index (II) of the healthy (C) and infected mice with the sensitive (S) and resistant (R) malarial parasites in the presence and absence of ART monotherapy (S-ART or R-ART) and ART-CHR combination (S-1:2 or R-1:2). C, G. Liver; D, H. Spleen; E, I. Kidney; F, J: Intestine.
Fig. 2
Fig. 2
PCA (I andII) and OPLS-DA analysis (III and IV) of healthy (C) and infected mice with the sensitive (S) and resistant (R) malarial parasites in the presence and absence of ART monotherapy (S-ART or R-ART) and ART-CHR combination (S-1:2 or R-1:2). PCA analysis among healthy control (C, red) and sensitive (S, purple) or resistant groups (R, green) without drug treatments (A. serum; B. liver; C. spleen; D. kidney; E. intestine); PCA analysis among infective control (S in purple color or R in green color) and medication groups by ART alone (S-ART in green color or R-ART in purple color) and ART-CHR combination (S-1:2 or R-1:2 both in red color) (F. Sensitive groups; G. Resistant groups). OPLS-DA analysis between healthy control (C, red) and sensitive (S, purple) or reistant groups (R, green) without drug treatments (H. serum; I. liver; J. spleen; K. kidney; L. intestine); OPLS-DA analysis between infective control (S in purple color or R in green color) and medication groups including ART monotherapy (S-ART in green color or R-ART in purple color) and ART-CHR combination (S-1:2 or R-1:2 both in red color); M. S vs. S-ART; N. S vs. S-1:2; O. S-1:2 vs. S-ART; P. R vs. R-ART; Q. R vs. R-1:2; R. R-1:2 vs. R-ART.
Fig. 2
Fig. 2
PCA (I andII) and OPLS-DA analysis (III and IV) of healthy (C) and infected mice with the sensitive (S) and resistant (R) malarial parasites in the presence and absence of ART monotherapy (S-ART or R-ART) and ART-CHR combination (S-1:2 or R-1:2). PCA analysis among healthy control (C, red) and sensitive (S, purple) or resistant groups (R, green) without drug treatments (A. serum; B. liver; C. spleen; D. kidney; E. intestine); PCA analysis among infective control (S in purple color or R in green color) and medication groups by ART alone (S-ART in green color or R-ART in purple color) and ART-CHR combination (S-1:2 or R-1:2 both in red color) (F. Sensitive groups; G. Resistant groups). OPLS-DA analysis between healthy control (C, red) and sensitive (S, purple) or reistant groups (R, green) without drug treatments (H. serum; I. liver; J. spleen; K. kidney; L. intestine); OPLS-DA analysis between infective control (S in purple color or R in green color) and medication groups including ART monotherapy (S-ART in green color or R-ART in purple color) and ART-CHR combination (S-1:2 or R-1:2 both in red color); M. S vs. S-ART; N. S vs. S-1:2; O. S-1:2 vs. S-ART; P. R vs. R-ART; Q. R vs. R-1:2; R. R-1:2 vs. R-ART.
Fig. 3
Fig. 3
Heat map analysis. (I) Heat maps of serum (A), liver (B), spleen (C), kidney (D), and intestine (E) samples from the sensitive (S) or resistant (R) parasite infected mice without medication; (II) Heat maps analysis of serum (F), liver (G), spleen (H), kidney (I), and intestine (J) samples from the sensitive (S) or resistant (R) parasite infected mice under ART alone or ARH-CHR combination; 1. S vs. S-ART; 2. S vs. S-1:2; 3. S-1:2 vs. S-ART; 4. R vs. R-ART; 5. R vs. R-1:2; 6. R-1:2 vs. R-ART.
Fig. 3
Fig. 3
Heat map analysis. (I) Heat maps of serum (A), liver (B), spleen (C), kidney (D), and intestine (E) samples from the sensitive (S) or resistant (R) parasite infected mice without medication; (II) Heat maps analysis of serum (F), liver (G), spleen (H), kidney (I), and intestine (J) samples from the sensitive (S) or resistant (R) parasite infected mice under ART alone or ARH-CHR combination; 1. S vs. S-ART; 2. S vs. S-1:2; 3. S-1:2 vs. S-ART; 4. R vs. R-ART; 5. R vs. R-1:2; 6. R-1:2 vs. R-ART.
Fig. 4
Fig. 4
Histograms of differential metabolites in serum and tissues from the mice infected with sensitive (S) and resistant (R) Plasmodium berghei K173. (I) Comparison between sensitive and resistant groups (A. serum; B. liver; C. spleen; D. kidney; E. intestine). (II) Histograms of differential metabolites in serum and tissues from the mice infected with sensitive (S) and resistant (R) Plasmodium berghei K173 under the treatments of ART alone or ART-CHR combination; F. S vs. S-ART; G. S vs. S-1:2; H. S-1:2 vs. S-ART; I. R vs. R-ART; J. R vs. R-1:2; K. R-1:2 vs. R-ART. (1) Serum; (2) Liver; (3) Spleen; (4) Kidney; (5) Intestine.
Fig. 4
Fig. 4
Histograms of differential metabolites in serum and tissues from the mice infected with sensitive (S) and resistant (R) Plasmodium berghei K173. (I) Comparison between sensitive and resistant groups (A. serum; B. liver; C. spleen; D. kidney; E. intestine). (II) Histograms of differential metabolites in serum and tissues from the mice infected with sensitive (S) and resistant (R) Plasmodium berghei K173 under the treatments of ART alone or ART-CHR combination; F. S vs. S-ART; G. S vs. S-1:2; H. S-1:2 vs. S-ART; I. R vs. R-ART; J. R vs. R-1:2; K. R-1:2 vs. R-ART. (1) Serum; (2) Liver; (3) Spleen; (4) Kidney; (5) Intestine.
Fig. 5
Fig. 5
Spatial metabolic pathway network of differential amino acids. (I) Comparison between mice infected with sensitive (S) and resistant (R) parasites; Metabolites labeled in red and blue respectively represented up-regulated and down-regulated. Metabolites labeled in orange suggested that there may be oppositely regulated between the groups. The superscript “S” or “R” means the variations original from sensitive or resistant groups. (II) Comparison between mice infected with sensitive (S) and resistant (R) parasites under the treatments of ART monotherapy and ART-CHR combination. The superscript arabic numbers next to the letter S or R represents 1S vs. S-ART or R vs. R-ART, 2S vs. S-1:2 or R vs. R-1:2, 3S-ART vs. S-1:2 or R-ART vs. R-1:2.

Similar articles

References

    1. Garrido-Cardenas, J. A., González-Cerón, L. & Manzano-Agugliaro, F. Mesa-Valle, C. genomics: an approach for learning about and ending human malaria. Parasitol. Res.118, 1–27. 10.1007/s00436-018-6127-9 (2019). - PubMed
    1. WHO. World malaria report 2020: 20 years of global progress and challenges. (2020). http://www.who.int/teams/global-malaria-programme
    1. Kalinjuma, A. V. et al. Factors associated with sub-microscopic placental malaria and its association with adverse pregnancy outcomes among HIV-negative women in Dar es Salaam, Tanzania: a cohort study. Bmc Infect. Dis.20. 10.1186/s12879-020-05521-6 (2020). - PMC - PubMed
    1. WHO. Word malaria report 2021. (2021). https://www.who.int/teams/global-malaria-programme/reports/world-malaria...
    1. Duffy, P. E. & Sibley, C. H. Are we losing artemisinin combination therapy already? Lancet366, 1908–1909. 10.1016/S0140-6736(05)67768-9 (2005). - PubMed

LinkOut - more resources