. 2025 Jun;28(6):1199-1212.
doi: 10.1038/s41593-025-01943-0. Epub 2025 Apr 21.

Autism-related traits in myotonic dystrophy type 1 model mice are due to MBNL sequestration and RNA mis-splicing of autism-risk genes

Affiliations

Autism-related traits in myotonic dystrophy type 1 model mice are due to MBNL sequestration and RNA mis-splicing of autism-risk genes

Łukasz J Sznajder et al. Nat Neurosci. 2025 Jun.

Abstract

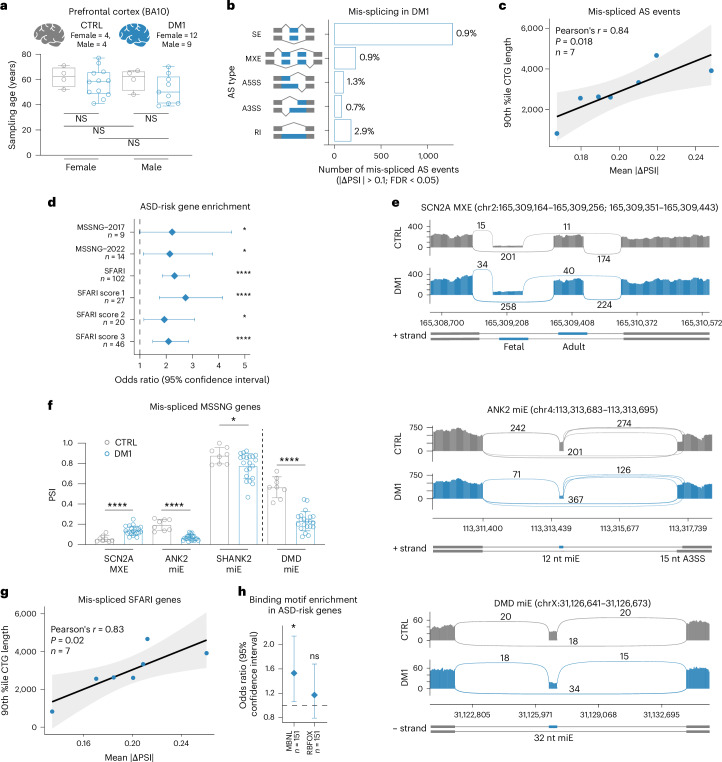
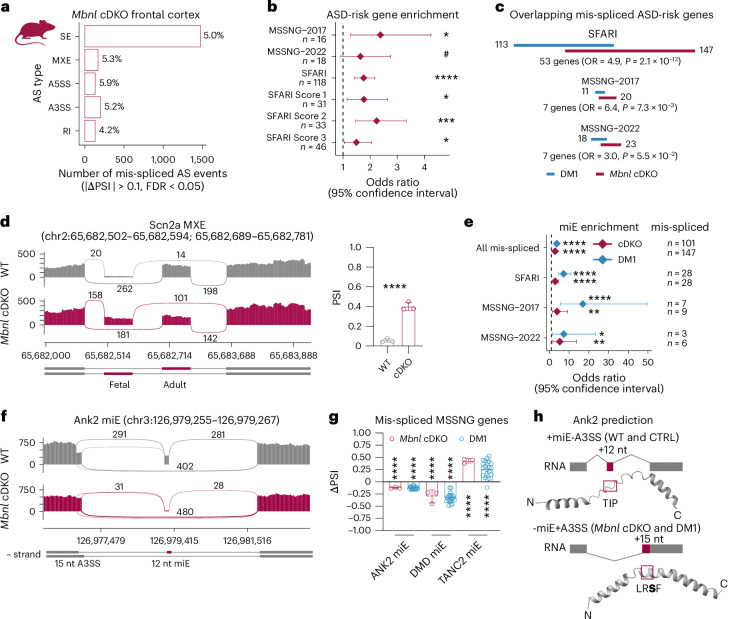
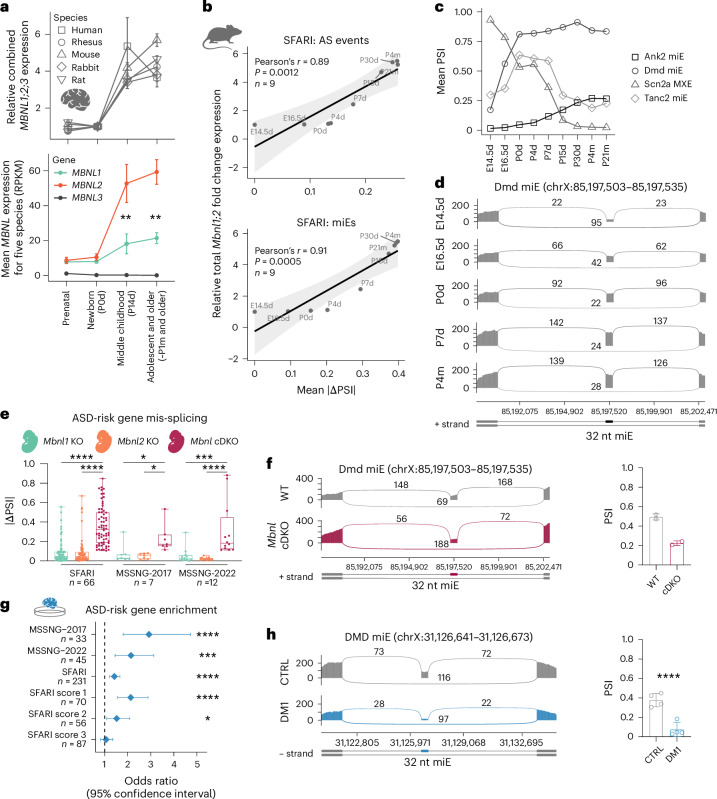
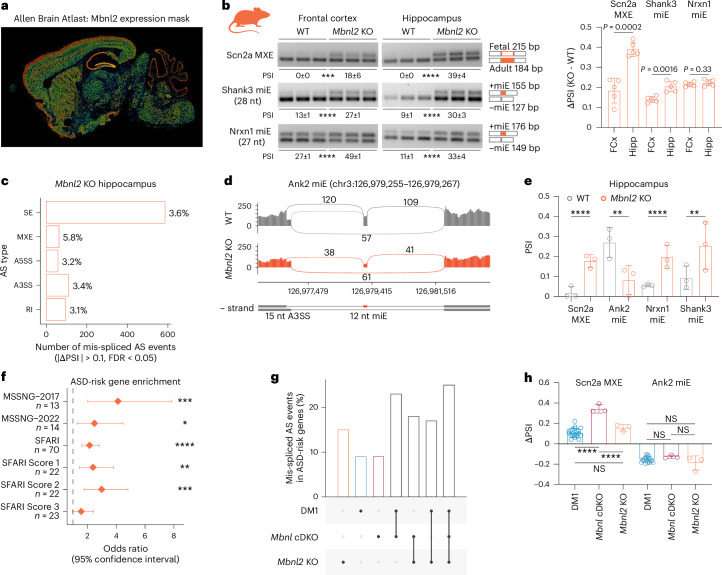
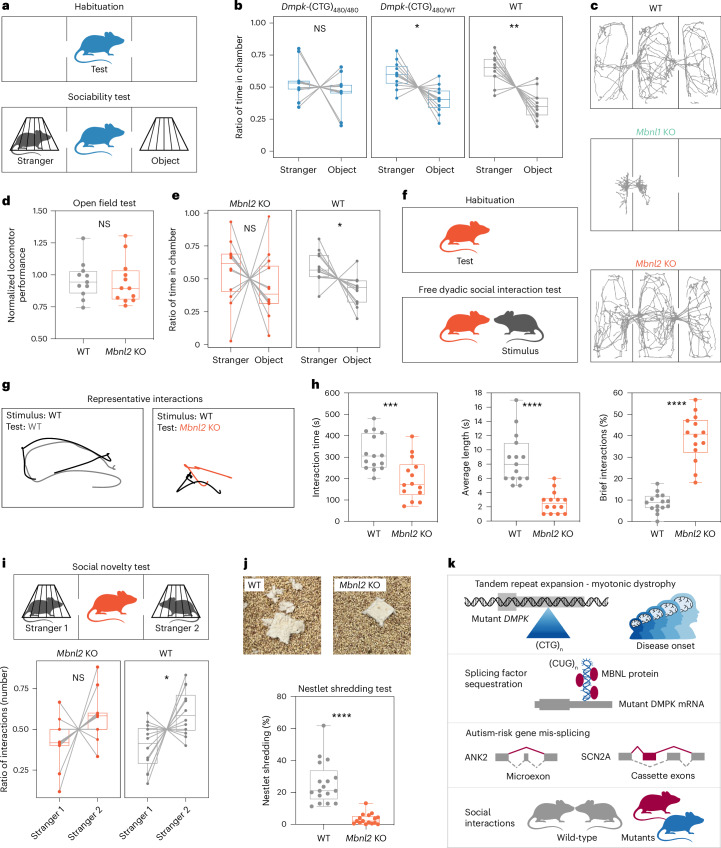
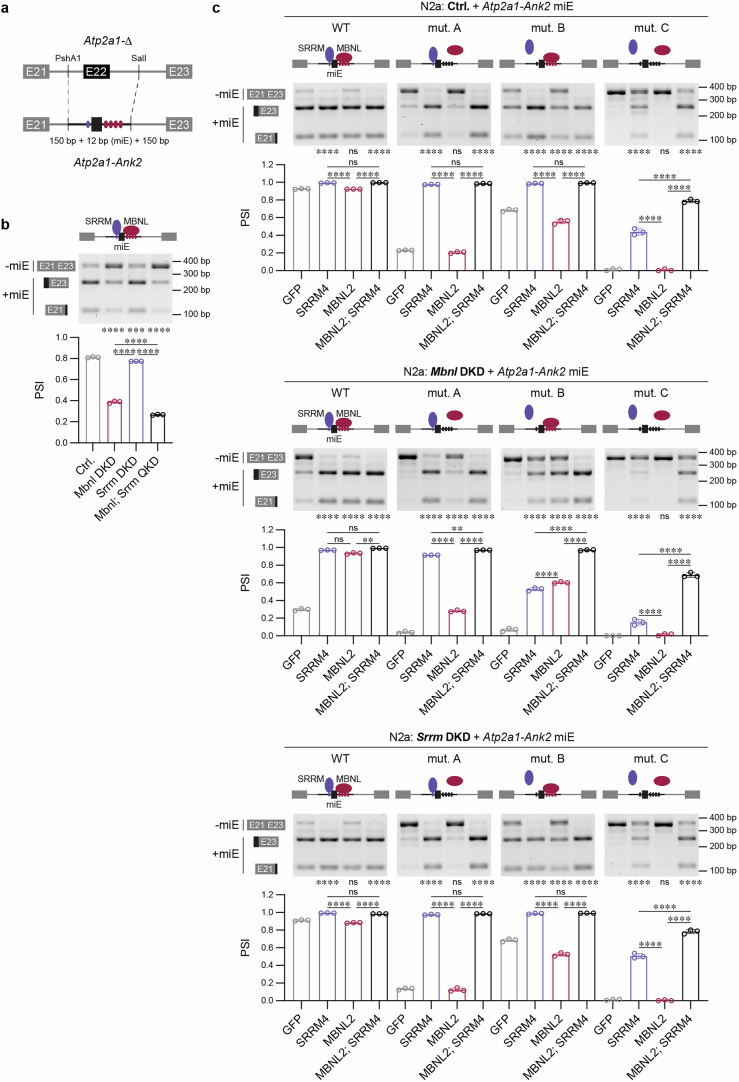
Genome-wide enrichment of gene-specific tandem repeat expansions has been linked to autism spectrum disorder. One such mutation is the CTG tandem repeat expansion in the 3' untranslated region of the DMPK gene, which is known to cause myotonic muscular dystrophy type 1. Although there is a clear clinical association between autism and myotonic dystrophy, the molecular basis for this connection remains unknown. Here, we report that sequestration of MBNL splicing factors by mutant DMPK RNAs with expanded CUG repeats alters the RNA splicing patterns of autism-risk genes during brain development, particularly a class of autism-relevant microexons. We demonstrate that both DMPK-CTG expansion and Mbnl null mouse models recapitulate autism-relevant mis-splicing profiles, along with social behavioral deficits and altered responses to novelty. These findings support our model that myotonic dystrophy-associated autism arises from developmental mis-splicing of autism-risk genes.


Conflict of interest statement

Competing interests: M.S.S. is a Scientific Advisory Board member of Skyhawk Therapeutics and Tacit Therapeutics. The other authors declare no competing interests.

Figures

Fig. 1
Fig. 1. ASD-risk gene mis-splicing in human DM1 prefrontal cortex.
a, Age and sex distribution of DM1 and control (CTRL) prefrontal cortex samples used by Otero et al. to generate RNA-seq data. Box plot shows the lower, middle and upper quartiles. Whiskers show minimum and maximum. Ordinary one-way analysis of variance (ANOVA) with Tukey’s multiple comparisons test: NS, adjusted P (Padj) > 0.6. b, The number and percentage of AS event types significantly mis-spliced in DM1. SE, skipped exon; MXE, mutually exclusive exon; A5SS/A3SS, alternative 5′/3′ splice site; RI, retained intron event. c, Strong positive correlation between DMPK-CTG lengths and mean |ΔPSI| for all mis-spliced events. The 90th percentile of DMPK-CTG length was selected for this analysis, as it shows the strongest correlation between repeat sizes and splicing dysregulation score in DM1 (ref. ). d, Enrichment analysis for mis-spliced ASD-risk gene sets in DM1. e, Sashimi plots quantitatively visualize splice junctions in DM1 (n = 8) and CTRL (n = 8) RNA-seq samples for selected AS events. f, High-confidence mis-splicing of ASD-risk genes in DM1 (n = 21) versus CTRL (n = 8). Data are presented as mean values PSI ± s.d. g, Strong positive correlation between DMPK-CTG lengths and mean |ΔPSI| for mis-spliced events in SFARI genes in DM1. h, MBNL and RBFOX binding motif enrichment near SE in mis-spliced autism-risk genes. c,g, The black diagonal line is the linear regression line, and the light gray area is the 95% confidence interval. P value for a two-tailed test. d,h, Diamonds represent the OR. Error bars depict the 95% confidence interval. d,f,h, NS, FDR = 0.38, *FDR < 0.05, ****FDR < 0.0001. Source data
Fig. 2
Fig. 2. Microexon mis-splicing in DM1 and Mbnl cDKO frontal cortices.
a, The number and percentage of AS event types significantly mis-spliced in Mbnl cDKO (n = 3 males). b, ASD-risk gene set enrichment analysis for mis-spliced genes in Mbnl cDKO. c, Overlap between mis-spliced ASD-risk gene sets in DM1 and Mbnl cDKO. d, Scn2a MXE mis-splicing in Mbnl cDKO (n = 3) versus WT (n = 3) RNA-seq. e, miE enrichment analysis for mis-spliced ASD-risk gene sets. f, Ank2 miE mis-splicing in in Mbnl cDKO RNA-seq. g, Orthologous mis-spliced miEs in DM1 (n = 21) and Mbnl cDKO (n = 3). h, Schematic of Ank2 miE to the A3SS coordinate splicing and modeled structures of mouse Ank2 polypeptides. The aa sequences changed by AS are shown by a magenta box. The S901 phosphorylation site is bolded. Diamonds represent OR (b,e). Error bars depict 95% confidence intervals. Data are presented as mean values ± s.d. (d,g). #FDR < 0.10, *FDR < 0.05, **FDR < 0.01, ***FDR < 0.001, ****FDR < 0.0001 (b,d,e,g). Source data
Fig. 3
Fig. 3. MBNL proteins govern developmental splicing transitions in ASD-risk genes.
a, MBNL1, MBNL2 and MBNL3 gene expression levels in developing brains of five species: human (n = 49), rhesus (n = 17), mouse (n = 51), rabbit (n = 57) and rat (n = 57). Total MBNL expression relative to newborn/postnatal day 0 (P0d) (top). Mean MBNL expression for five species at each developmental stage (bottom). Significant differences between MBNL1 and MBNL2 expression at different developmental stages were determined by a two-tailed t-test; **P < 0.01. b, Strong positive correlation between Mbnl gene expression in developing WT mouse cortex and mean |ΔPSI | for MBNL-sensitive AS events (top) and miEs only (bottom) in SFARI genes. Black diagonal lines are the linear regression lines, and light gray areas are the 95% confidence intervals. P value for a two-tailed test. c, Splicing change in the developing mouse cortex for four MBNL-sensitive AS events in high-confidence ASD-risk genes. Embryonic days 14.5–16.5, postnatal days 0–30, and postnatal months 4–21 (n = 2 for each time point). d, Dmd miE splicing transitions during mouse cortical development. e, ASD-risk gene mis-splicing in Mbnl1 KO (n = 2), Mbnl2 KO (n = 2) and Mbnl cDKO (n = 2) mouse E18.5 d cortical neurons. Box plot shows the lower, middle and upper quartiles. Whiskers show minimum and maximum. Kruskal–Wallis test followed by Dunn’s multiple comparison test (n, mis-spliced AS events); *Padj < 0.05, ***Padj < 0.001, ****Padj < 0.0001. f, Dmd miE mis-splicing in embryonic Mbnl cDKO (n = 2) versus WT (n = 2) RNA-seq. g, ASD-risk gene set enrichment analysis for mis-spliced genes in DM1 brain organoid. Diamonds represent the OR. Error bars depict the 95% confidence interval. h, DMD miE mis-splicing in in DM1 (n = 4) versus CTRL (n = 4) brain organoid RNA-seq. Data are presented as mean ± s.d. (a,c,f,h). *FDR = 0.018, ***FDR = 0.00026, ****FDR < 0.0001 (g,h). Source data
Fig. 4
Fig. 4. Mis-splicing in the Mbnl2 KO hippocampus.
a, The Allen Mouse Brain Atlas shows the normalized color-coded Mbnl2 expression level (from blue, low to red, high) derived from the informatics data processing of in situ hybridization results (mouse.brain-map.org/gene/show/69724). b, Scn2a MXE, Nrxn1 miE and Shank3 miE mis-splicing in Mbnl2 KO (n = 5) and littermate WT (n = 5) frontal cortex (FCx) and hippocampus (Hipp). Two-tailed t-test: ***P = 0.0001, ****P < 0.0001. c, The number and percentage of AS event types significantly mis-spliced in Mbnl2 KO hippocampus (n = 3 females). d, Ank2 miE mis-splicing in Mbnl2 KO RNA-seq. e, ASD-risk gene mis-splicing in Mbnl2 KO (n = 3) versus WT (n = 3) hippocampus RNA-seq. f, ASD-risk gene set enrichment analysis for mis-spliced genes in Mbnl2 KO. Diamonds represent OR. Error bars depict 95% confidence intervals. g, Percent of overlapping events annotated within ASD-risk genes among DM1 prefrontal cortex, Mbnl cDKO frontal cortex and Mbnl2 KO hippocampus. h, Examples of overlapping mis-splicing events in DM1 (n = 21), Mbnl cDKO (n = 3) and Mbnl2 KO (n = 3). One-way ANOVA followed by Tukey’s multiple comparisons test. NS, Padj > 0.05, ****Padj < 0.0001. Data are presented as means ± s.d. (b,e,h). *FDR = 0.011, **FDR < 0.01, ***FDR < 0.001, ****FDR < 0.0001 (e,f). Source data
Fig. 5
Fig. 5. MBNL proteins directly regulate Ank2 miE splicing.
a, The number and percentage of AS event types significantly mis-spliced in Mbnl DKD CAD cells (n = 3). b, ASD-risk gene set enrichment analysis for mis-spliced genes in Mbnl DKD cells. c, MBNL-binding motif enrichment in mis-spliced ASD-risk genes. d, miE enrichment analysis for mis-spliced ASD-risk gene sets. e, Ank2 miE mis-splicing in Mbnl DKD RNA-seq. f, MBNL2-CLIP-seq reads (orange boxes, combined n = 3 females) in the Ank2 miE downstream intron containing three conserved (magenta) and one suboptimal (black) motifs. g, Schematic of limited heterologous Atp2a1 splicing minigenes and regulation by MBNL proteins. MBNL-binding sequences (magenta) identified in mouse Ank2 and human ANK2 and their mutants (blue). h, Heterologous Atp2a1 splicing minigene regulation by MBNL proteins in HeLa cells (n = 4). Unpaired two-tailed t-test: ****P < 0.0001. Data are presented as mean ± s.d. (e,h). Diamonds represent OR (bd). Error bars depict 95% confidence intervals. #FDR ≤ 0.10, *FDR < 0.05, **FDR < 0.01, ***FDR < 0.001, ****FDR < 0.0001. Source data
Fig. 6
Fig. 6. MBNL and SRRM regulate the same miEs.
a, Age and sex distribution of ASD and CTRL prefrontal cortex samples in PsychENCODE RNA-seq data. ASD was confirmed by the Autism Diagnostic Interview-Revised (n = 8) or supported by records (n = 2). Box plot shows the lower, middle and upper quartiles. Whiskers show minimum and maximum. Two-tailed t-test; NS, P = 0.83. b, The number and percentage of AS event types significantly mis-spliced in ASD. c, ANK2 miE mis-splicing in ASD. Sashimi plots of ASD (n = 8) and CTRL (n = 8) RNA-seq. #FDR = 0.056. d, The number and percentage of AS event types significantly mis-spliced in Srrm DKD N2a cells (n = 2). e, Ank2 miE mis-splicing in Srrm DKD RNA-seq (n = 2). f, Overlapping mis-spliced miEs in Srrm DKD CAD and Mbnl DKD N2a cells. g, Selected miE splicing analysis in Mbnl DKD, Srrm DKD and Mbnl;Srrm QKD N2a cells (n = 4). h, Capillary electrophoresis analysis of Ank2 miE and A3SS. CI, combination index (g,h). One-way ANOVA followed by Tukey’s multiple comparisons test; NS, Padj > 0.05, *Padj < 0.05, **Padj < 0.01, ***Padj < 0.001, ****Padj < 0.0001. Data are presented as mean ± s.d (c,gh). Source data
Fig. 7
Fig. 7. Ank2 miE regulation by MBNL and SRRM proteins.
a, SRRM4-CLIP-seq reads coverage (purple box) in the Ank2 miE upstream intron containing the UGC motif. b, Schematic of heterologous Atp2a1-Ank2 miE splicing minigenes and regulation by MBNL and SRRM proteins. MBNL (magenta) and SRRM (purple) binding sequences identified in mouse Ank2 and their mutants (blue). c, Proposed secondary structures for normal and mutant Ank2 RNAs. The optimal thermodynamic stability of the structure is expressed in Gibbs free energy (∆G) in kcal mol−1 for the reaction at 37 °C using mfold software. d, Experimental design. e, Atp2a1-Ank2 miE splicing analysis in N2a experiment (n = 3). Data are presented as mean values ± s.d. One-way ANOVA followed by Tukey’s multiple comparisons test; NS, Padj > 0.05, *Padj < 0.05, **Padj < 0.01, ****Padj < 0.0001. f, SRRM and MBNL proteins directly bind to Ank2 and synergistically promote miE inclusion. Source data
Fig. 8
Fig. 8. Social behavior deficits in two DM1 mouse models.
a, Scheme of the three-chamber habituation and sociability test. b,e, Ratio of time the test mice spent in the chamber with a novel animal (stranger) and object during the sociability test. Time spent in the middle chamber is not included. b, WT mice (n = 11), Dmpk-(CTG)480/WT (n = 11), and Dmpk-(CTG)480/480 (n = 11). Paired two-tailed t-test; NS, P = 0.38 (t = 0.9134, d.f. 10), *P = 0.013 (t = 2.997, d.f. 10), **P = 0.0025 (t = 4.012, d.f. 10). c, Representative mouse movement during the habituation phase. d, Normalized mean values for 13 parameters measured in the automated open field test. WT mice (n = 11), Mbnl2 KO (n = 12). Two-tailed t-test; NS, P = 0.83 (t = 0.2131, d.f. 21). e, WT mice (n = 12), Mbnl2 KO (n = 12); two-tailed t-test; NS, P = 0.43 (t = 0.8193, d.f. 11), *P = 0.023 (t = 2.641, d.f. 11). f, Scheme of the free dyadic social interaction test. g, Representative mouse interactions. h, Mouse interactions analysis. WT (n = 15), Mbnl2 KO (n = 14). Interaction time and brief interaction; two-tailed t-test; ***P = 0.00098 (t = 3.696, d.f. 27), ****P < 0.0001 (t = 9.842, d.f. 27). Average length; two-tailed Mann–Whitney U-test; ****P < 0.0001. i, Scheme of the three-chamber social novelty test. Ratio of interactions with novel animal (stranger 2) and familiar animal (stranger 1) during the social novelty test. WT mice (n = 12), Mbnl2 KO (n = 12). Paired two-tailed t-test: NS, P = 0.078 (t = 1.941, d.f. 11), *P = 0.025 (t = 2.594, d.f. 11). j, Representative photos of nestlet shredding. WT (n = 17), Mbnl2 KO (n = 16); two-tailed Mann–Whitney U-test; ****P < 0.0001. Box plot shows the lower, middle and upper quartiles (b,d,e,hj). Whiskers show minimum and maximum. k, Molecular mechanism of autism associated with myotonic dystrophy. Source data
Extended Data Fig. 1
Extended Data Fig. 1. Mis-splicing in DM1 prefrontal cortex.
a, Differential AS analysis in DM1 (N = 21) compared to control (CTRL; N = 8) prefrontal cortex. The percentage of mis-spliced AS events (left) and genes (right) in the DM1. b, Strong positive correlation between DMPK-CTG lengths and mean |ΔPSI| for mis-spliced retained intron (RI) events. Note, the 90th percentile of DMPK-CTG length was selected, since it displays the strongest correlation between repeat sizes and splicing dysregulation score in DM1. The black diagonal line represents the linear regression line, and the light gray area indicates the 95% confidence interval. P-value for a two-tailed test. c, Negative correlation between mean ΔPSI for mis-spliced RI events (n = 158) and their host transcript relative steady-state levels (baseMean ≥ 1) in DM1. FC-fold change. The black diagonal line represents the linear regression line, and the light gray area indicates the 95% confidence interval. P-value for a two-tailed test. d, Circular RNA species in CSTPP1 intron 7 (I7) in DM1 (N = 21) and CTRL (N = 8) prefrontal cortex as well as control and HeLa treated with RNase R RNA-seq samples,. Box plot shows I7 relative to exon 7 (E7) RNA-seq read count. Box plot shows the lower, middle, and upper quartiles. Whiskers show minimum and maximum. Two-tailed Mann-Whitney test; **P = 0.0098. e, ASD-relevant gene set enrichment analysis for mis-spliced genes in DM1 (N = 21). Diamonds represent the OR. Error bars depict the 95% confidence interval. *FDR < 0.05, **FDR < 0.01, ****FDR < 0.0001. f, Sashimi plots of DM1 (N = 8) and CTRL (N = 8) RNA-seq samples for SHANK2 miE. g, Positive correlation between DMPK-CTG lengths and mean |ΔPSI| for mis-spliced MSSNG-2017 and MSSNG-2022 genes in DM1. The black diagonal lines represent the linear regression lines, and the light gray areas indicate the 95% confidence intervals. P-value for a two-tailed test. h, Prediction of MBNL binding to mis-spliced SE events in ASD-risk genes in DM1. i, RBFOX1, RBFOX2, and RBFOX3 expression in DM1 (N = 21) and CTRL (N = 8) prefrontal cortex. Data are presented as mean values ± SD. DEseq2; nsPadj > 0.05, *Padj = 0.021. j, Differential AS analysis in RBFOX1 KD (N = 5) compared to control (N = 5) primary human neural progenitor (PHNP) cell RNA-seq samples. The percentage of mis-spliced AS events (left) and genes (right). Source data
Extended Data Fig. 2
Extended Data Fig. 2. miE mis-splicing in Mbnl cDKO frontal cortex.
a, Differential AS analysis in frontal cortex of Mbnl cDKO compared to littermate WT control (N = 3 males). The percentage of mis-spliced AS events (left) and genes (right) in the Mbnl cDKO. b, ASD-relevant gene set enrichment analysis for mis-spliced genes in Mbnl cDKO (N = 3). Diamonds represent the odds ratio. Error bars depict the 95% confidence interval. c, Quantification of coordinate Ank2 miE and A3SS mis-splicing in Mbnl cDKO (N = 3) and WT (N = 3) RNA-seq samples. d, Examples of miE mis-splicing in ASD-risk genes. Sashimi plots of Mbnl cDKO (N = 3) and WT (N = 3) RNA-seq samples for Nrxn1 miE, Shank3 miE, and Dmd miE. Modeled structures of mouse protein isoform regions containing a sequence encoded by miE (magenta box). c,d, Data are presented as mean values ± SD. b,c,d, #FDR < 0.10, *FDR < 0.05, **FDR < 0.01, ***FDR < 0.001, ****FDR < 0.0001. Source data
Extended Data Fig. 3
Extended Data Fig. 3. MBNL-mediated splicing transitions in ASD-risk genes during brain development.
a, Mbnl1, Mbnl2 and Mbnl3 gene expression levels during WT mouse cortex development. Dots represent the mean values (N = 2). b, Strong positive correlation between Mbnl gene expression in developing WT mouse cortex and mean |ΔPSI | for MBNL-sensitive AS events (top) and miEs only (bottom) in MSSNG-2017 and MSSNG-2022 genes. The black diagonal lines represent the linear regression lines, and the light gray areas indicate the 95% confidence intervals. P-value for a two-tailed test. c, Proportion of MBNL-sensitive AS events differentially spliced (gray) in the developing cortex (E14.5 d, E16.5 d vs P4m, P21m). d, Scn2a MXE and Ank2 miE splicing transitions during WT cortical development. e, RNA mis-splicing in Mbnl1 KO (N = 2), Mbnl2 KO (N = 2) and Mbnl cDKO (N = 2) mouse E18.5 cortical neuron RNA-seq samples. Box plot shows the lower, middle, and upper quartiles. Whiskers show minimum and maximum. Kruskal–Wallis test followed by Dunn’s multiple comparison test (n = mis-spliced AS events); nsPadj = 0.11, ****Padj < 0.0001. Source data
Extended Data Fig. 4
Extended Data Fig. 4. Mis-splicing in the mouse Mbnl2 KO brain.
a, Nissl bodies from the Allen Mouse Brain Atlas at the same slice position as Mbnl1 and Mbnl2 RNA in situ hybridization (ISH) results. Staining Nissl bodies serve as a reference for the ISH data. For ISH, specific digoxigenin tagged RNA probes were used to label cells expressing Mbnl1 (mouse.brain-map.org/gene/show/36037) and Mbnl2 (mouse.brain-map.org/gene/show/69724) transcripts. b, Relative MBNL1, MBNL2, and MBNL3 expression in multiple human and mouse brain regions. CNS - central nervous system. c, Schematic of the 3-primer Scn2a RT–PCR assay. d, Scn2a MXE and Nrxn1 miE mis-splicing in Mbnl2 KO (N = 5) and littermate WT (N = 3) cerebellum. Two-tailed t-test; nsP > 0.05. This result was repeated twice. e, Differential AS analysis in frontal hippocampus of Mbnl2 KO compared to littermate WT control (N = 3 females). The percentage of mis-spliced AS events (left) and genes (right) in the Mbnl2 KO. f, Examples of mis-splicing in ASD-risk genes in Mbnl2 KO RNA-seq. g, ASD-relevant gene set enrichment analysis for mis-spliced genes in Mbnl2 KO (N = 3). Diamonds represent the odds ratio. Error bars depict the 95% confidence interval. *FDR < 0.05, **FDR < 0.01, ***FDR < 0.001, ****FDR < 0.0001. h, Examples of overlapping mis-splicing events in DM1 (N = 21), Mbnl cDKO (N = 3), and Mbnl2 KO (N = 3). Data are presented as mean values ± SD. One-way ANOVA followed by Tukey’s multiple comparisons test; nsPadj > 0.05, *Padj = 0.0393, **Padj = 0.0058. Source data
Extended Data Fig. 5
Extended Data Fig. 5. Mis-splicing in the Mbnl DKD CAD cells.
a, Differential AS analysis in Mbnl DKD compared to control (N = 3) CAD cells. The percentage of mis-spliced AS events (left) and genes (right) in the Mbnl DKD. b, ASD-relevant gene set enrichment analysis for mis-spliced genes in Mbnl DKD (N = 3). Diamonds represent the odds ratio. Error bars depict the 95% confidence interval. #FDR ≤ 0.10, *FDR < 0.05, **FDR < 0.01, ***FDR < 0.001, ****FDR < 0.0001. c, UCSC Genome browser view of human ANK2 illustrates the conservation of miE 12 bp and intronic MBNL-binding motifs across multiple species. d, Binding affinity of recombinant MBNL1 to normal and mutant Ank2 RNA sequences expressed as a Kd value (3 replicas). e, Heterologous Atp2a1 splicing minigene regulation by MBNL proteins in HeLa cells (N = 4). Two-tailed t-test; ****P < 0.0001. d,e, Data are presented as mean values ± SD. Source data
Extended Data Fig. 6
Extended Data Fig. 6. Mis-splicing in the Srrm DKD N2a cells.
a, Differential AS analysis in ASD (N = 10) compared to CTRL (N = 10) prefrontal cortex. The percentage of mis-spliced AS events (left) and genes (right) in the ASD. b, Differential AS analysis in Srrm DKD compared to control (N = 2) N2a cells. The percentage of mis-spliced AS events (left) and genes (right) in the Srrm DKD. c, ASD-relevant gene set enrichment analysis for mis-spliced genes in Srrm DKD (N = 2). d, miE enrichment analysis for mis-spliced ASD-risk gene sets. c,d, Diamonds represent the odds ratio. Error bars depict the 95% confidence interval. *FDR < 0.05, **FDR < 0.01, ***FDR < 0.001, ****FDR < 0.0001. e, Srrm3/SRRM3 and Srrm4/SRRM4 gene expression levels in developing human (N = 49) and mouse (N = 51) brains. f, SRRM3 and SRRM4 gene expression levels in DM1 prefrontal cortex RNA-seq shows lack of correlation between DMPK-CTG lengths and SRRM4 gene expression. The black diagonal line represents the linear regression line, and the light gray area indicates the 95% confidence interval. P-value for a two-tailed test. g, Srrm3, Srrm4, Rbfox1, Rbfox2, and Rbfox3 gene expression levels in Mbnl cDKO frontal cortex (N = 3), Mbnl2 KO hippocampus (N = 3), and Mbnl DKD CAD cells (N = 3) RNA-seq. f,g, DESeq2; nsPadj > 0.05, *Padj = 0.01. h, Mbnl1 and Mbnl2 gene expression levels in control (Ctrl; N = 4), Mbnl DKD (N = 4), Srrm DKD (N = 4), and Mbnl;Srrm QKD (N = 4) N2a cells measured by RT-qPCR. One-way ANOVA followed by Dunnett’s multiple comparisons test; nsPadj > 0.05, *Padj < 0.05, **Padj < 0.01, ****Padj < 0.0001. e-h, Data are presented as mean values ± SD. Source data
Extended Data Fig. 7
Extended Data Fig. 7. MBNL and SRRM proteins bind to primary transcripts containing miE.
a, Capillary electrophoresis analysis of endogenous Ank2 miE and A3SS in control (Ctrl; N = 4), Mbnl DKD (N = 4), Srrm DKD (N = 4), and Mbnl;Srrm QKD (N = 4) N2a cells. One-way ANOVA followed by Tukey’s multiple comparisons test; ****Padj < 0.0001. b, Genome browser view of MBNL2-CLIP-seq clusters (orange) from the hippocampus and SRRM4-CLIP-seq clusters from N2a cells in vicinity of six mis-spliced miEs. The cluster sequences are provided, with conserved (orange or purple) and suboptimal (black) protein binding motifs bolded. Lowercase letters indicate sequences not covered by the CLIP-seq reads, and square brackets indicate miE boundaries. c, Mis-splicing of six miEs in Mbnl DKD CAD (magenta; N = 3) and Srrm DKD N2a (purple; N = 2) cells. *FDR < 0.05, **FDR = < 0.01, ****FDR < 0.0001. d, Clasp1, Picalm, Tjap1, Ank2 enrichment in GFP (N = 3), MBNL1-Flag (N = 3) and SRRM4-3xFlag (N = 3) RNA co-IP. Top right, randomly selected Nfat5 and Fmr1 pre-mRNAs serve as negative controls. Top left, a scheme of qRT–PCR-analyzed pre-mRNA fragments in RNA co-IP; black arrows depict regions bound by forward and reverse primers. Multiple two-sample t-test followed by Holm-Šídák correction for multiple comparisons; **Padj < 0.01, ***Padj < 0.001, ****Padj < 0.0001. a,c,d, Data are presented as mean values ± SD. Source data
Extended Data Fig. 8
Extended Data Fig. 8. MBNL and SRRM proteins directly bind to Ank2 and regulate miE splicing.
a, Schematic of heterologous Atp2a1-Ank2 miE splicing minigenes production. MBNL (magenta) and SRRM (purple) binding sequences identified in mouse Ank2. b,c, Atp2a1-Ank2 miE splicing analysis in N2a experiments (N = 3). One-way ANOVA followed by Tukey’s multiple comparisons test; nsPadj > 0.05, **Padj < 0.01, ***Padj < 0.001, ****Padj < 0.0001. Data are presented as mean values ± SD. Source data
Extended Data Fig. 9
Extended Data Fig. 9. Lack of a locomotor deficit in Mbnl2 KO mice.
a, 13 parameters were measured during the 25-minute (5–30 min) interval of the open field test. WT mice (N = 11), Mbnl2 KO (N = 12). Two-tailed t-test or two-tailed Mann-Whitney (U) test. b, Percentage of nestlet shredding. WT mice (N = 13), Dmpk-(CTG)480/480 (N = 10). Two-tailed Mann-Whitney test; **P = 0.0039. c, Number of buried marbles. WT mice (N = 17), Mbnl2 KO (N = 14). Two-tailed t-test: P = 0.1455 (t = 1.496, df=29). a,b,c, Box plot shows the lower, middle, and upper quartiles. Whiskers show minimum and maximum. Source data

Update of

References

    1. Lord, C. et al. Autism spectrum disorder. Nat. Rev. Dis. Prim.6, 5 (2020). - PMC - PubMed
    1. Soke, G. N., Maenner, M. J., Christensen, D., Kurzius-Spencer, M. & Schieve, L. A. Prevalence of co-occurring medical and behavioral conditions/symptoms among 4- and 8-year-old children with autism spectrum disorder in selected areas of the United States in 2010. J. Autism Dev. Disord.48, 2663–2676 (2018). - PMC - PubMed
    1. Maenner, M. J. et al. Prevalence and characteristics of autism spectrum disorder among children aged 8 years - autism and developmental disabilities monitoring network, 11 sites, United States, 2020. MMWR Surveill. Summ.72, 1–14 (2023). - PMC - PubMed
    1. Myers, S. M. et al. Insufficient evidence for ‘autism-specific’ genes. Am. J. Hum. Genet106, 587–595 (2020). - PMC - PubMed
    1. Trost, B. et al. Genome-wide detection of tandem DNA repeats that are expanded in autism. Nature586, 80–86 (2020). - PMC - PubMed

LinkOut - more resources