. 2025 May;57(5):1213-1227.
doi: 10.1038/s41588-025-02161-x. Epub 2025 Apr 21.

Multi-omic and spatial analysis of mouse kidneys highlights sex-specific differences in gene regulation across the lifespan

Affiliations

Multi-omic and spatial analysis of mouse kidneys highlights sex-specific differences in gene regulation across the lifespan

Siqi Chen et al. Nat Genet. 2025 May.

Abstract

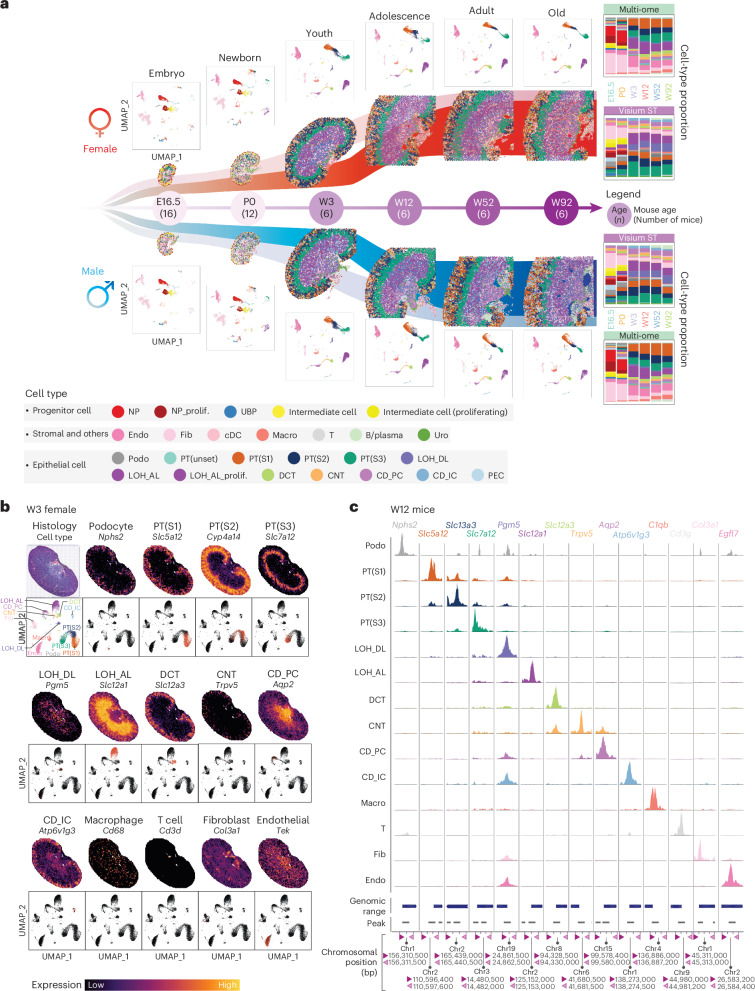
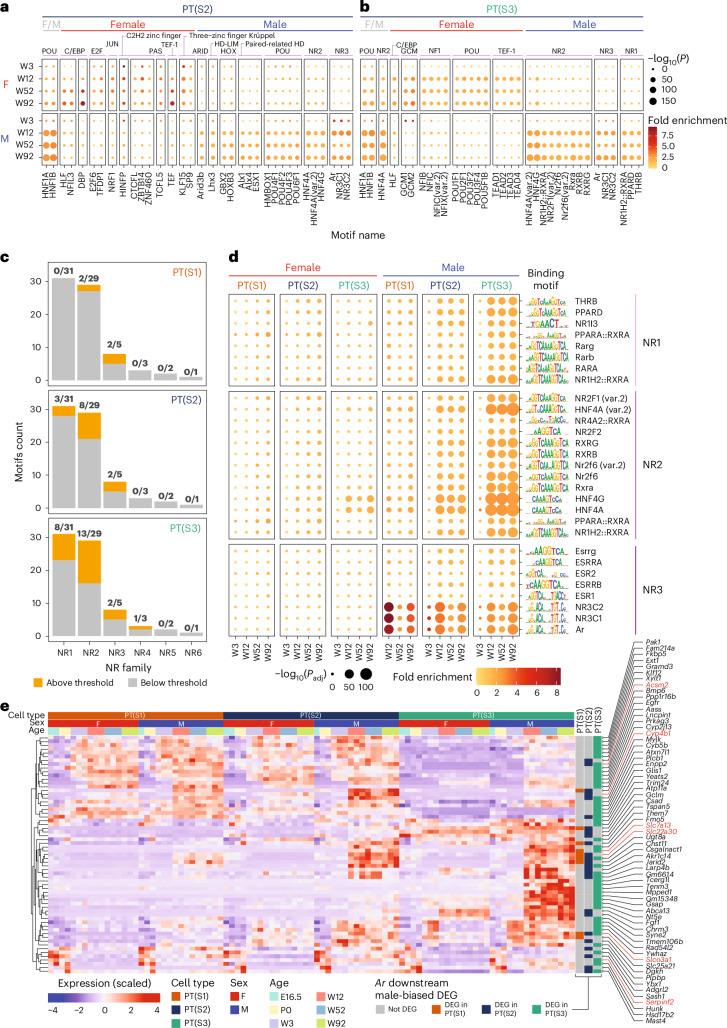
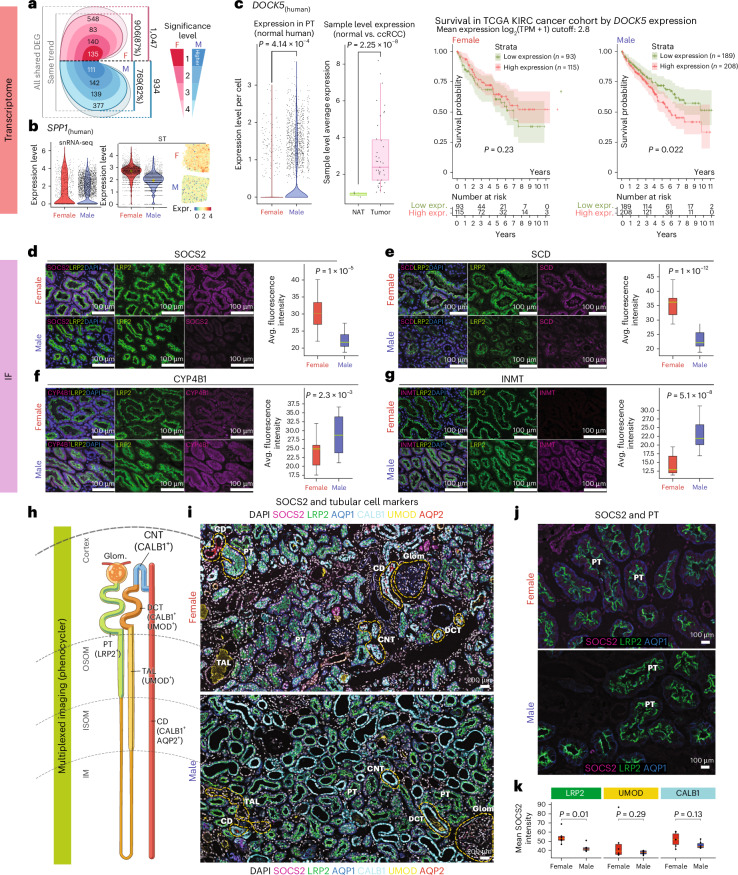
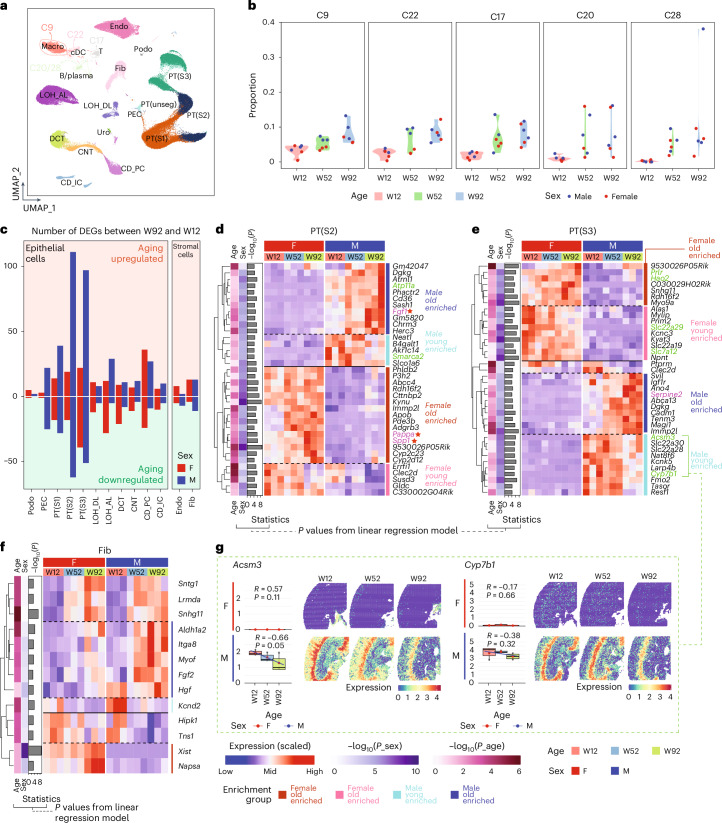
There is a sex bias in the incidence and progression of many kidney diseases. To better understand such sexual dimorphism, we integrated data from six platforms, characterizing 76 kidney samples from 68 mice at six developmental and adult time points, creating a molecular atlas of the mouse kidney across the lifespan for both sexes. We show that proximal tubules have the most sex-biased differentially expressed genes emerging after 3 weeks of age and are associated with hormonal regulations. We reveal potential mechanisms involving both direct and indirect regulation by androgens and estrogens. Spatial profiling identifies distinct sex-biased spatial patterns in the cortex and outer stripe of the outer medulla. Additionally, older mice exhibit more aging-related gene alterations in loops of Henle, proximal tubules and collecting ducts in a sex-dependent manner. Our results enhance the understanding of spatially resolved gene expression and hormone regulation underlying kidney sexual dimorphism across the lifespan.


Conflict of interest statement

Competing interests: The authors declare no competing interests.

Figures

Fig. 1
Fig. 1. Study design and integrated cell-type distribution from Visium ST, snRNA-seq and snATAC–seq.
a, The study design and multi-omic dataset. Time points and the number of mouse kidneys collected for each time point are shown along the central line. UMAPs from multi-ome and ST images from Visium display cell-type distributions across time points. Bar charts on the right show cell-type proportions. Colors represent different cell types in the legend. b, Single nuclei and spatial expression profiles of cell-type marker genes in a W3 female mouse kidney, with expression levels color-coded from low (dark purple) to high (yellow). c, snATAC–seq peak accessibility of major kidney cell types in W12 mice. Cell types are indicated by marker genes, with colors representing accessibility levels. Endo, endothelial cell; Fib, fibroblast; cDC, conventional dendritic cell; Macro, macrophage; Uro, urothelium; Podo, podocyte; LOH_AL, loop of Henle ascending limb; LOH_DL, loop of Henle descending limb; CNT, connecting tubule; CD_IC, collecting duct intercalated cell; PEC, parietal epithelial cells; chr, chromosome; prolif., proliferating. Source data
Fig. 2
Fig. 2. Developmental trajectories of main kidney progenitor cells across the lifespan.
a,b, Heatmaps of the top DEGs for each cell type derived from (a) NP cells and (b) UBP cells. Each heatmap shows cell types, sex and age in the top three rows. c, Developmental trajectories illustrate gene enrichment over time for cells descending from NP and UBP. F, female; M, male.
Fig. 3
Fig. 3. Sex-biased DEGs in PT segments.
a, Euler diagrams for sex-biased DEG counts in each PT segment at adult time points W12, W52 and W92. Numbers represent gene counts for each time point and overlapped time points. Colors representing different time points are indicated in the legend. b, Bubble plots for sex-biased normalized enrichment scores (NES) from GSEA (left) and key pathway-related genes weighted by expression levels as gene-level enrichment score (GES) (right). The bottom plot presents the pseudobulk expression of selected genes. c, Pairwise Pearson correlation analysis for PT segments and sexes. Red box shows the correlation between PT(S2) and PT(S3) in females, blue box shows the correlation between PT(S2) and PT(S3) in males, green box shows PT(S3) correlation between sexes and gray box shows PT(S2) correlation between sexes. Violin plots on the bottom left show correlation comparisons. d, UMAPs show transitions of PT(S1), PT(S2) and PT(S3) from W3 to W92, with dotted lines marking cells from adult kidneys (W12–W92). e, Heatmaps for snRNA-based expression of top sex-biased DEGs in PT(S2) and PT(S3). The first group of columns indicates gene expression FC (orange for female-biased and blue for male-biased), and the next two groups of columns show average expression levels in females and males. f, Comparison of Socs2 expression patterns between sexes via snATAC–seq, snRNA-seq, ST and IF staining. LTL stains identify PT segments; white-dotted curves in ST images mark inner cortical and outer medullary regions, while white-dashed curves in IF staining images highlight PT(S3)-like straight tubules and representative protein expression differences between sexes (n = 3). Experiments are repeated >3 times with similar results. Scale bar = 100 μm. g, Comparison of Akr1c21 expression patterns between sexes using snATAC–seq, snRNA-seq, Visium ST and IF staining, with labeling consistent with f (n = 3). Experiments are repeated more than thrice with similar results. Scale bar = 100 μm. EMT, epithelial-mesenchymal transition; mTORC1, mammalian target of rapamycin complex 1; MYC, MYC proto-oncogene, BHLH transcription factor; LTL, lotus tetragonolobus lectin. Source data
Fig. 4
Fig. 4. Sex differences in PT revealed by regulatory network analysis.
a, Heatmap for the averaged binary activity of cell-type-specific regulons in PT segments across all samples from age E16.5 to W92. Top rows indicate cell type, sex and age. The ‘(number g)’ notation indicates the number of genes in the regulon. b, Heatmap of genes involved in Socs2 expression regulation. c,d, Expression of PT(S3)-derived, female-biased genes predicted to be downstream targets of both STAT5 and BCL6 (c) and controlled strictly by STAT5 (d). Reference bars on top indicate sex and age. e, Sex-biased regulatory mechanism diagram, controlled by STAT5 and BCL6 together (left), or controlled by STAT5 alone (right). Red boxes show female-biased genes and blue boxes show male-biased genes. Source data
Fig. 5
Fig. 5. Sex-biased spatial distribution patterns revealed by Xenium.
a, H&E images, spatially resolved renal zones and cell types of W92 kidneys generated by Xenium for demonstration (n = 1 for each sex). Dashed boxes indicate zoomed regions in the next panel. b, Magnified view of renal zones and tubular cell types in female and male kidneys. c, Bubble plot of average and percent expression levels for each pattern. d, Single-cell sex-biased spatial expression patterns. e, Top, cropped spatial expression pattern of male-biased gene Pigr, along with PT and PT(S3) markers Lrp2 and Aqp7, respectively. Bottom, average expression trend plot of Pigr in the cropped region (Method). f, Zoomed OSOM view of Pigr, Aqp7 and PT(S3) in female and male mouse kidneys. g, Top, cropped spatial expression pattern of male-biased gene Akr1c21, along with PT and PT(S3) markers Lrp2 and Aqp7, respectively. Bottom, average expression trend plot of Akr1c21 in the cropped region. h, Zoomed OSOM view of Akr1c21, Aqp7 and PT(S3) in female and male mouse kidneys. i, Single-cell spatial expression profile of Prlr, Jak2 and Socs2 in kidneys of both sexes. j, Zoomed-in view of Prlr, Jak2, Socs2 and PT(S3) in the OSOM zone mouse kidneys of both sexes. k, Expression trend plot of Prlr, Jak2 and Socs2 in the cropped region. ISOM, inner stripe of the outer medulla; TAL, loop of Henle thick ascending limb; DTL, loop of Henle thin descending limb.
Fig. 6
Fig. 6. PT sex differences revealed by motif enrichment analysis.
a,b, Overview of top motifs enriched in male- and female-specific peaks in PT(S2) (a) and PT(S3) (b). One-sided hypergeometric test was performed comparing the sex-biased peaks with randomly selected peaks with the same GC content. log10-transformed P value (Benjamini–Hochberg adjusted) is represented as the bubble size. c, Number of motifs that are above or below threshold (with sex enrichment patterns) for the NR motif family in PT segments (Methods). d, Overview of selected motifs from the NR family. Bubble size and color indicate adjusted P value and fold enrichment, respectively, given male- and female-specific peaks within each cell type and age. The P value calculation was done in the same way as explained in a and b. e, Heatmap showing the average expression of predicted downstream targets for the Ar motif in PT segments. Source data
Fig. 7
Fig. 7. Sex DEG expression patterns in human kidneys.
a, Diagram of overlapping male- and female-specific PT genes between mouse and human at various significance levels in human data (Methods; two-sided Wilcoxon rank-sum test Bonferroni method adjusted). b, Left, violin plot of SPP1 snRNA expression in PT. Right, violin and spatial plots of SPP1 expression from Visium ST. Yellow diamonds denote medians. c, Left, DOCK5 expression in PT of normal human kidney samples (two-sided Wilcoxon rank-sum test). Middle, DOCK5 expression in ccRCC tumor tissues compared to normal adjacent tissues. Boxplots show the median (centerline), first and third quartiles (hinges) and whiskers extending to values within 1.5× IQR from the hinges (two-sided Students’ t test). Right, Kaplan–Meier curves of the survival status of patients based on low/high DOCK5 expression, for males and females, separately (log-rank test). dg, IF images and fluorescence intensity quantification of SOCS2 (d), SCD (e), CYP4B1 (f) and INMT (g) expression in female and male human kidney tissues (eight random areas, n = 3). LRP2 is used to label PT cells. Scale bar = 100 μm. Boxplots show the median (centerline), first and third quartiles (hinges) and whiskers extending to values within 1.5× IQR from the hinges (two-sided Welch’s t test). Representative images of the three biological replicates are in Supplementary Figs. 4–7. h, Nephron structure diagram. i, CODEX images of SOCS2, LRP2, AQP1, CALB1, UMOD and AQP2 in female and male human kidneys (n = 1 for each sex for demonstration purpose). Scale bar = 200 μm. j, CODEX images of SOCS2, LRP2 and AQP1 showing SOCS2 difference of female versus male in human kidneys. Scale bar = 100 μm. k, Mean SOCS2 intensity in LRP2+, UMOD+ and CALB1+ cells. Boxplots show the median (centerline), first and third quartiles (hinges) and whiskers extending to values within 1.5× IQR from the hinges (two-sided Welch’s t test). Quantification is performed on eight random regions from the multiplex image, repeated more than thrice with similar results. KIRC, kidney renal clear cell carcinoma; Expr, expression; Glom, glomeruli; IQR, interquartile range; TCGA, The Cancer Genome Atlas.
Fig. 8
Fig. 8. Aging in different kidney cell types.
a, Cell-type distributions from adult kidneys based on multi-ome data. Colors represent cell types. b, Violin plot showing proportions of cells from clusters 9, 22, 17, 20 and 28 for each sample. c, Number of DEGs in major cell types comparing W92 to W12 samples in females and males, respectively. df, Heatmaps of top aging-associated DEGs in PT(S2) (d), PT(S3) (e) and Fib (f). Genes in purple are from the SenMayo list; genes in green are also sex DEGs from Fig. 3e; kidney disease-related genes are marked with red stars. Annotation bars on the left side indicate the log10-transformed P values from the linear regression model, expression ~ age + sex, that are associated with age (two-sided Students’ t test), sex (two-sided Students’ t test) and the overall linear model (two-sided F test). Only genes with adjusted P < 1 × 10−10 and absolute log(FC) ≥ 0.5 in the W92–W12 differential expression testing (two-sided Wilcox, Bonferroni correction) were examined in this linear model, and no further multiple comparison adjustments were done. Color bars on the right denote the age-associated enrichment group of the genes. g, Expression of young male-enriched PT(S3) genes in snRNA-seq (left; n = 3 per age per sex; red dot indicates mean; Spearman correlation; two-sided t test) and ST (right). Source data
Extended Data Fig. 1
Extended Data Fig. 1. Expression level and percentage for cell-type markers for multi-ome dataset.
Dot size corresponds to the percentage of cells expressing a gene, and color indicates the average scaled expression in each cell type. NP, nephrogenic progenitor cell; IM, intermediate cell; UBP, ureteric bud progenitor cell; Podo, podocyte; PEC, parietal epithelial cells; PT, proximal tubules; PT(S1), proximal tubule segment 1; PT(S2), proximal tubule segment 2; PT(S3), proximal tubule segment 3; LOH_DL, loop of Henle descending limb; LOH_AL, loop of Henle ascending limb; DCT, distal convoluted tubule; CNT, connecting tubule; CD_PC, collecting duct principal cell; CD_IC, collecting duct intercalated cell; Uro, urothelium; Endo, endothelial cell; Fib, fibroblast; macro, macrophage; cDC, conventional dendritic cell. Source data
Extended Data Fig. 2
Extended Data Fig. 2. UMAPs for cell distributions across ages and sexes.
Cells are colored by cell type. NP, nephrogenic progenitor cell; UBP, ureteric bud progenitor cell; Podo, podocyte; PEC, parietal epithelial cells; PT, proximal tubules; PT(S1), proximal tubule segment 1; PT(S2), proximal tubule segment 2; PT(S3), proximal tubule segment 3; LOH_DL, loop of Henle descending limb; LOH_AL, loop of Henle ascending limb; DCT, distal convoluted tubule; CNT, connecting tubule; CD_PC, collecting duct principal cell; CD_IC, collecting duct intercalated cell; Uro, urothelium; Endo, endothelial cell; Fib, fibroblast; Macro, macrophage; cDC, conventional dendritic cell; E16.5, embryonic 16.5; P0, newborn; W3, week 3; W12, week 12; W52, week 52; W92, week 92; F, female; M, male.
Extended Data Fig. 3
Extended Data Fig. 3. Representative gene expression patterns in PT segments.
A zoomed-in version of the heatmap from Fig. 2a focusing on PT segments. Genes of interest were highlighted in red. E16.5, embryonic 16.5; P0, newborn; W3, week 3; W12, week 12; W52, week 52; W92, week 92; F, female; M, male; PT, proximal tubules; PT(S1), proximal tubule segment 1; PT(S2), proximal tubule segment 2; PT(S3), proximal tubule segment 3.
Extended Data Fig. 4
Extended Data Fig. 4. Gene expression trend for LOH_AL, DCT, CD_IC and CD_PC cell-type marker genes.
Violin plots showing cell-type marker genes with interesting expression trends across the lifespan for LOH_AL, DCT, CD_IC and CD_PC. Colors represent ages. E16.5, embryonic 16.5; P0, newborn; W3, week 3; W12, week 12; W52, week 52; W92, week 92; F, female; M, male; LOH_DL, loop of Henle descending limb; LOH_AL, loop of Henle ascending limb; CD_PC, collecting duct principal cell; CD_IC, collecting duct intercalated cell.
Extended Data Fig. 5
Extended Data Fig. 5. Correlation among kidney cell types.
a, Pearson correlation for gene expression among kidney cell types from W3, W12, W52 and W92 samples. b, Peak accessibility correlation among kidney cell types from W3, W12, W52 and W92 samples. E16.5, embryonic 16.5; P0, newborn; W3, week 3; W12, week 12; W52, week 52; W92, week 92; F, female; M, male; Podo, podocyte; PEC, parietal epithelial cells; PT, proximal tubules; PT(S1), proximal tubule segment 1; PT(S2), proximal tubule segment 2; PT(S3), proximal tubule segment 3; LOH_DL, loop of Henle descending limb; LOH_AL, loop of Henle ascending limb; CD_PC, collecting duct principal cell; CD_IC, collecting duct intercalated cell.
Extended Data Fig. 6
Extended Data Fig. 6. Additional gene expression heatmaps.
a, Heatmap showing the correlation of each PT segment (from each sex) expression between our dataset and the bulk RNA-seq dataset from GSE150338. b, Heatmaps showing the Visium ST-based expression of top sex-biased DEGs of PT(S2) and PT(S3) across different ages. E16.5, embryonic 16.5; P0, newborn; W3, week 3; W12, week 12; W52, week 52; W92, week 92; F, female; M, male; PT, proximal tubules; PT(S1), proximal tubule segment 1; PT(S2), proximal tubule segment 2; PT(S3), proximal tubule segment 3; ST, spatial transcriptomics.
Extended Data Fig. 7
Extended Data Fig. 7. SOCS2 and AKR1C21 protein expression comparison between sexes in mice.
a,b, Immunofluorescence staining showing the protein expression pattern of (a) SOCS2 and (b) AKR1C21 in female and male mice (n = 3). Dashed curves indicate tubules that show the most obvious difference between females and males. Scale bar, 100 μm. LTL (green) is used to label the PT segment. DAPI (blue) is used to label nuclei. Experiments are repeated >3 times with similar results. F, female; M, male; PT, proximal tubules; W12, week 12; W52, week 52; W92, week 92.
Extended Data Fig. 8
Extended Data Fig. 8. tSNE plots and heatmaps from regulon analysis.
a, tSNE plots based on SCENIC regulon AUC scores for each cell. From left to right, cells are colored by age, sex and cell type, respectively. b, Heatmaps showing the average expression of downstream targets of female-biased regulons, Cebpd, Creb311 and Foxq1, for each sample. c, Heatmaps showing the average expression of downstream targets of male-biased regulons, Bcl6, Bach2 and Zbtb20, for each sample. F, female; M, male; PT, proximal tubules; E16.5, embryonic 16.5; P0, newborn; W3, week 3; W12, week 12; W52, week 52; W92, week 92.
Extended Data Fig. 9
Extended Data Fig. 9. Additional analysis for snATAC–seq and Xenium.
a,b, Peak accessibility for PT(S3) populations across ages and sexes. STAT5A, STAT5B and BCL6 within the promoter regions were highlighted. The peaks shown were the promoter regions of (a) Socs2 and (b) Prlr. c, Xenium single-cell spatial expressions of 5 sex-dimorphic spatial patterns in W12 mice. (Top) Zonal sex-biased spatial expression example annotated with range for Cortex (red lines) and outer stripe of the outer medulla (OSOM; yellow lines). (Bottom) Diagram for the zonal pattern expression. Dots indicate the expression of the gene in that zone. d, Single-cell spatial expressions of Jak2, Prlr and Socs2 of W12 female and male mice using Xenium platform. F, female; M, male; E16.5, embryonic 16.5; P0, newborn; W3, week 3; W12, week 12; W52, week 52; W92, week 92.
Extended Data Fig. 10
Extended Data Fig. 10. UMAPs and DEG gene count for cell types in aging kidneys.
a, UMAPs highlighting the cell-type annotation for populations for each sex. b, Number of DEGs within each cell type between male and female. The color indicates female-biased (red) or male-biased (blue). ATL, loop of Henle thin ascending limb; CNT, connecting tubule; DCT, distal convoluted tubule; DTL, loop of Henle thin descending limb; EC, endothelial cell; FIB, interstitial fibroblast; IC, collecting duct intercalated cell; IMM, leukocyte; NEU, neural cell; PC, collecting duct principal cell; PEC, parietal epithelial cell; POD, podocytes; PT, proximal tubule; PapE, papillary tips cell; TAL, loop of Henle thick ascending limb; VSM/P, renal interstitial pericyte; DEG, differentially expressed genes.

References

    1. McMahon, A. P. Development of the mammalian kidney. Curr. Top. Dev. Biol.117, 31–64 (2016). - PMC - PubMed
    1. Ransick, A. et al. Single cell profiling reveals sex, lineage and regional diversity in the mouse kidney. Dev. Cell51, 399–413 (2019). - PMC - PubMed
    1. Mayne, B. T. et al. Large scale gene expression meta-analysis reveals tissue-specific, sex-biased gene expression in humans. Front. Genet.7, 183 (2016). - PMC - PubMed
    1. Chen, L., Chou, C.-L., Yang, C.-R. & Knepper, M. A. Multiomics analyses reveal sex differences in mouse renal proximal subsegments. J. Am. Soc. Nephrol.34, 829–845 (2023). - PMC - PubMed
    1. Xiong, L. et al. Direct androgen receptor control of sexually dimorphic gene expression in the mammalian kidney. Dev. Cell58, 2338–2358 (2023). - PMC - PubMed

LinkOut - more resources