

A machine learning model for predicting acute respiratory distress syndrome risk in patients with sepsis using circulating immune cell parameters: a retrospective study
- PMID: 40259224
- PMCID: PMC12013033
- DOI: 10.1186/s12879-025-10974-8
A machine learning model for predicting acute respiratory distress syndrome risk in patients with sepsis using circulating immune cell parameters: a retrospective study
Abstract
Background: Acute respiratory distress syndrome (ARDS) is a severe complication associated with a high mortality rate in patients with sepsis. Early identification of patients with sepsis at high risk of developing ARDS is crucial for timely intervention, optimization of treatment strategies, and improvement of clinical outcomes. However, traditional risk prediction methods are often insufficient. This study aimed to develop a machine learning (ML) model to predict the risk of ARDS in patients with sepsis using circulating immune cell parameters and other physiological data.
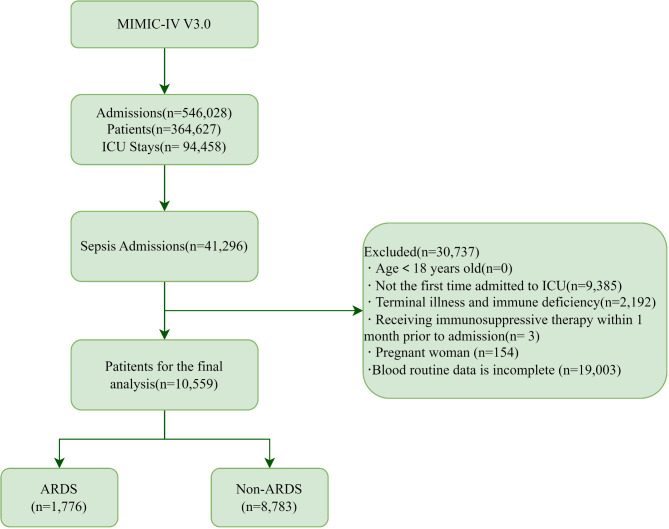
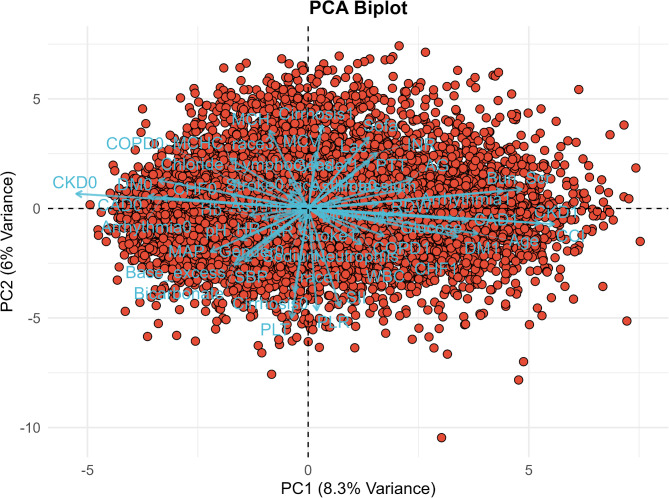
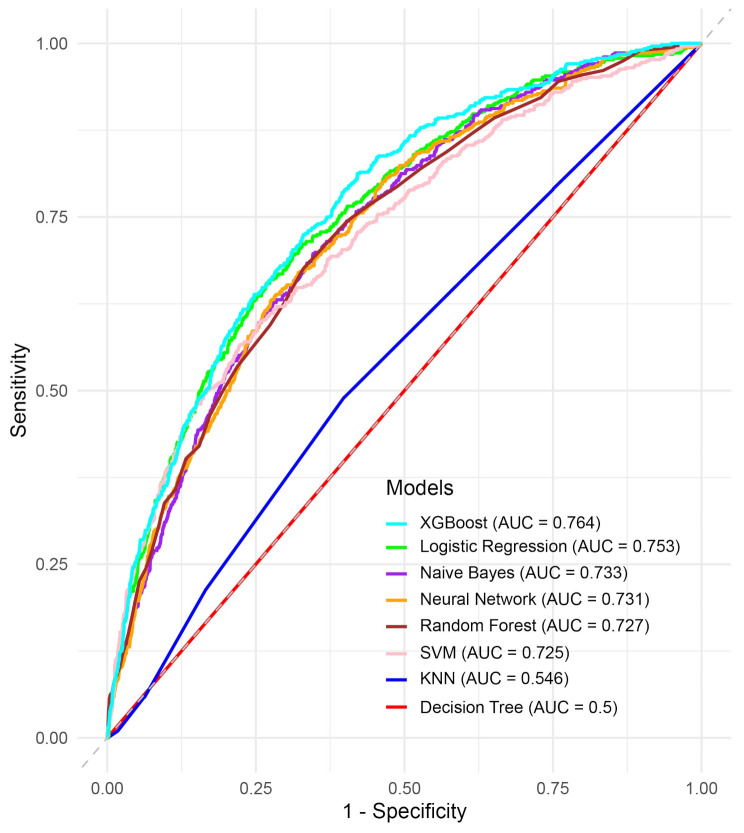
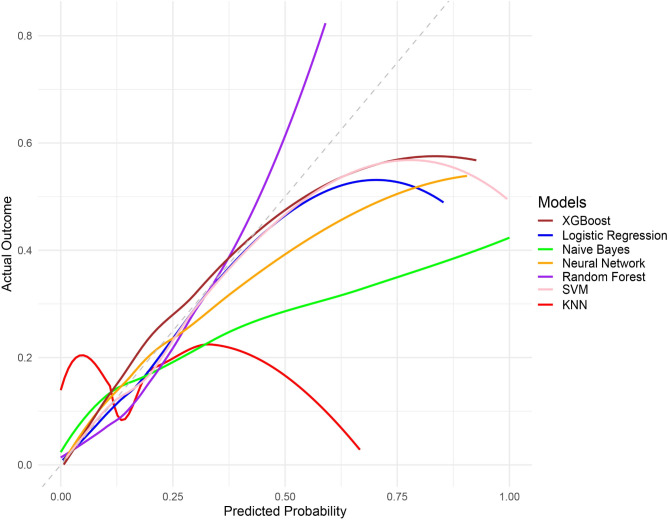
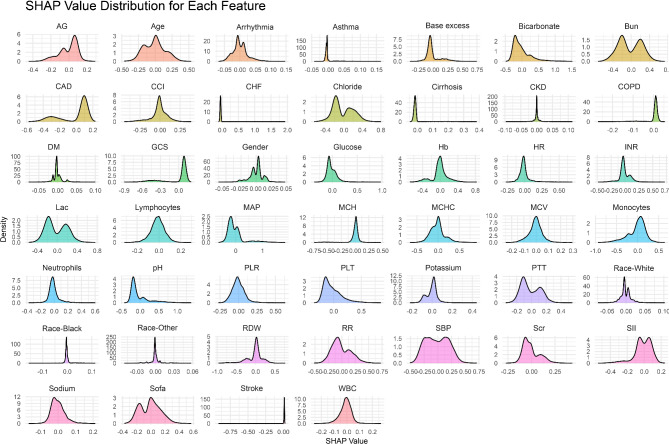
Methods: Clinical data from 10,559 patients with sepsis were obtained from the MIMIC-IV database. Principal component analysis (PCA) was used for dimensionality reduction and to comprehensively evaluate the models' predictive capabilities, we used several ML algorithms, including decision trees, k-nearest neighbors (KNN), logistic regression, naive Bayes, random forests, neural networks, XGBoost, and support vector machines (SVM) to predict ARDS risk. The model performance was assessed using the area under the receiver operating characteristic curve (AUC), accuracy, sensitivity, specificity, and F1 score. Shapley additive explanations (SHAP) were used to interpret the contribution of individual features to model predictions.
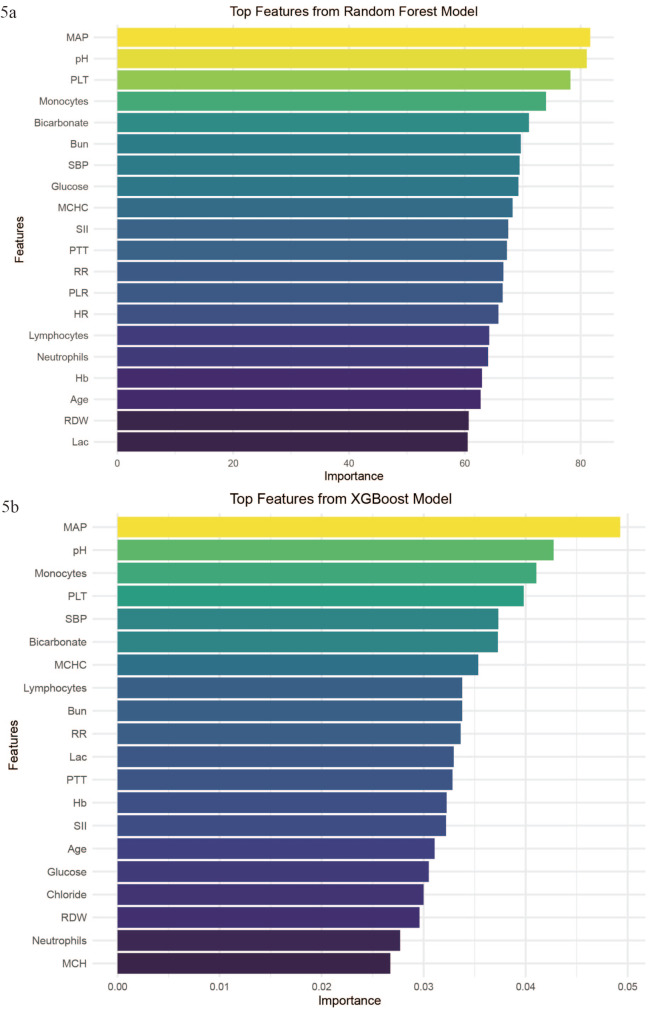
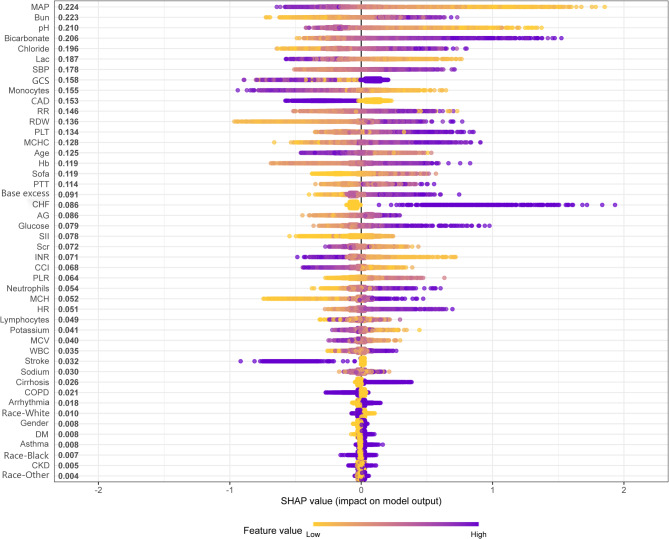
Results: Among all models, XGBoost showed the best performance with an AUC of 0.764. Feature importance analysis revealed that mean arterial pressure, monocyte count, neutrophil count, pH, and platelet count were key predictors of ARDS risk in patients with sepsis. The SHAP analysis provided further information on how these features contributed to the model's predictions, aiding in interpretability and potential clinical applications.
Conclusion: The XGBoost model using circulating immune cell parameters accurately predicted the risk of ARDS in patients with sepsis. This model could be a useful tool for the early identification of high-risk patients and timely intervention; however, further validation and integration into clinical practice are required.
Keywords: ARDS; MIMIC-IV database; Machine learning; Prediction model; Sepsis.
© 2025. The Author(s).
Conflict of interest statement
Declarations. Ethics approval and consent to participate: Not applicable. Clinical trial number: Not applicable. Consent for publication: Not applicable. Competing interests: The authors declare no competing interests.
Figures
Similar articles
-
Machine learning for the early prediction of acute respiratory distress syndrome (ARDS) in patients with sepsis in the ICU based on clinical data.Heliyon. 2024 Mar 13;10(6):e28143. doi: 10.1016/j.heliyon.2024.e28143. eCollection 2024 Mar 30. Heliyon. 2024. PMID: 38533071 Free PMC article.
-
Development and validation of an interpretable machine learning model for predicting in-hospital mortality for ischemic stroke patients in ICU.Int J Med Inform. 2025 Jun;198:105874. doi: 10.1016/j.ijmedinf.2025.105874. Epub 2025 Mar 9. Int J Med Inform. 2025. PMID: 40073651
-
Predicting Mortality in Sepsis-Associated Acute Respiratory Distress Syndrome: A Machine Learning Approach Using the MIMIC-III Database.J Intensive Care Med. 2025 Mar;40(3):294-302. doi: 10.1177/08850666241281060. Epub 2024 Sep 5. J Intensive Care Med. 2025. PMID: 39234770
-
Predictive Modeling of Acute Respiratory Distress Syndrome Using Machine Learning: Systematic Review and Meta-Analysis.J Med Internet Res. 2025 May 13;27:e66615. doi: 10.2196/66615. J Med Internet Res. 2025. PMID: 40359510 Free PMC article.
-
Early Prediction of Mortality Risk in Acute Respiratory Distress Syndrome: Systematic Review and Meta-Analysis.J Med Internet Res. 2025 May 20;27:e70537. doi: 10.2196/70537. J Med Internet Res. 2025. PMID: 40392588 Free PMC article.
Cited by
-
Predicting 30-day in-hospital mortality in ICU asthma patients: a retrospective machine learning study with external validation.BMC Pulm Med. 2025 Aug 12;25(1):387. doi: 10.1186/s12890-025-03881-w. BMC Pulm Med. 2025. PMID: 40797171 Free PMC article.
References
-
- Bellani G, Laffey JG, Pham T, Fan E, Brochard L, Esteban A, et al. Epidemiology, patterns of care, and mortality for patients with acute respiratory distress syndrome in intensive care units in 50 countries. JAMA. 2016;315(8):788–800. - PubMed
-
- Combes A, Hajage D, Capellier G, Demoule A, Lavoué S, Guervilly C, et al. Extracorporeal membrane oxygenation for severe acute respiratory distress syndrome. N Engl J Med. 2018;378(21):1965–75. - PubMed
-
- van der Poll T, Shankar-Hari M, Wiersinga WJ. The immunology of sepsis. Immunity. 2021;54(11):2450–64. - PubMed
MeSH terms
Grants and funding
LinkOut - more resources
Full Text Sources
Medical
