. 2025 Apr 21;23(1):303.
doi: 10.1186/s12951-025-03315-z.

PTEN as a prognostic factor for radiotherapy plus immunotherapy response in nasopharyngeal carcinoma

Affiliations

PTEN as a prognostic factor for radiotherapy plus immunotherapy response in nasopharyngeal carcinoma

Jiaxing Guo et al. J Nanobiotechnology. .

Abstract

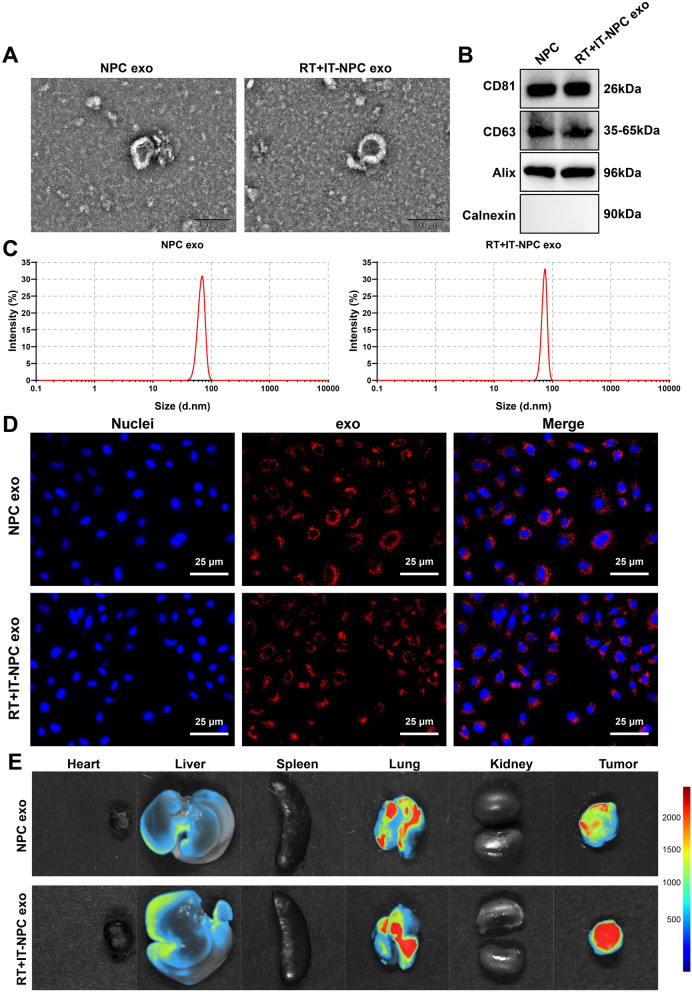
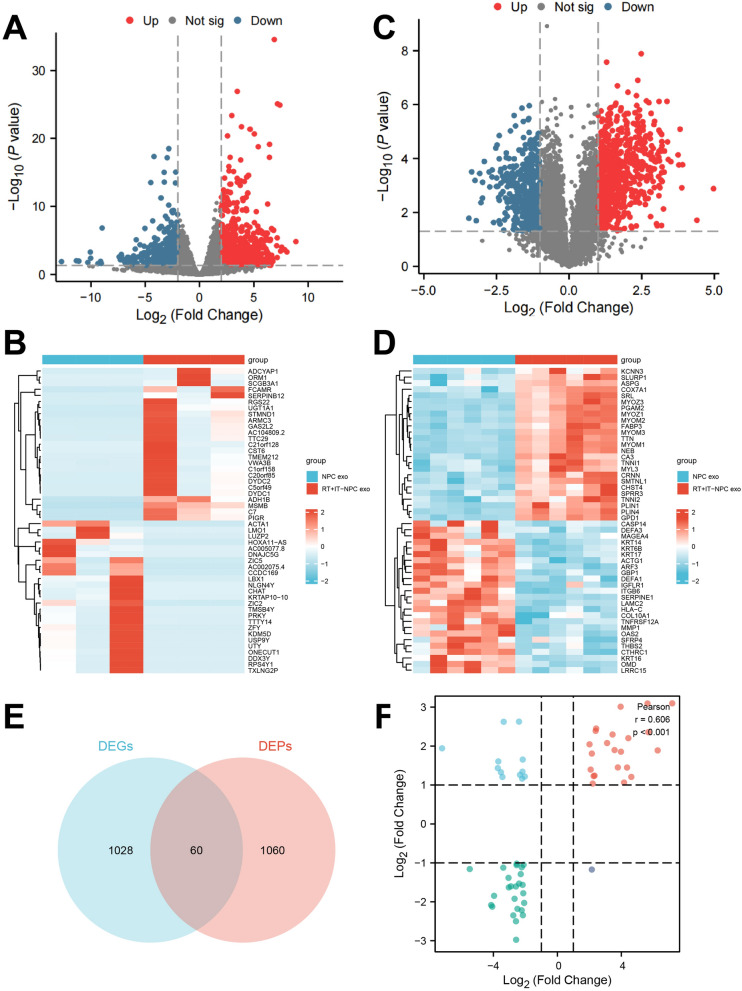
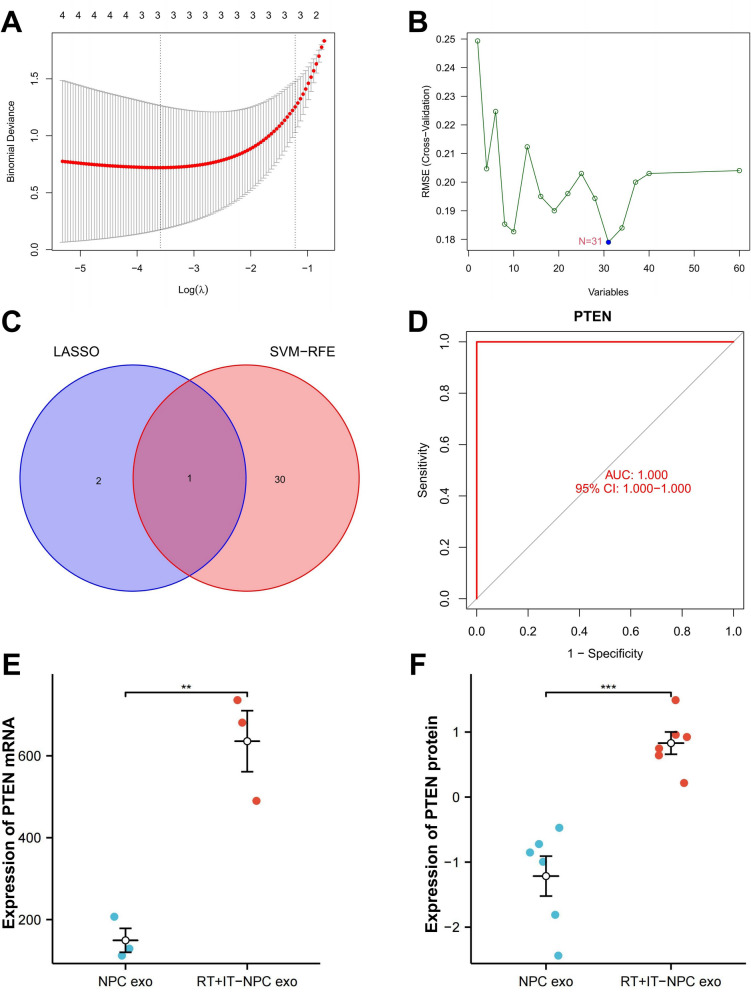
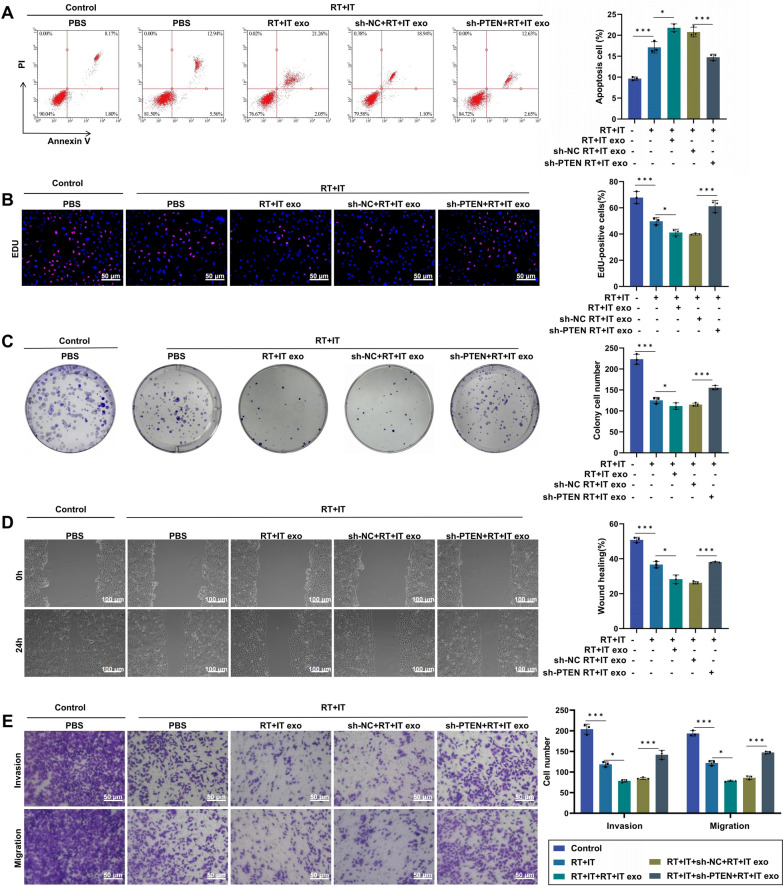
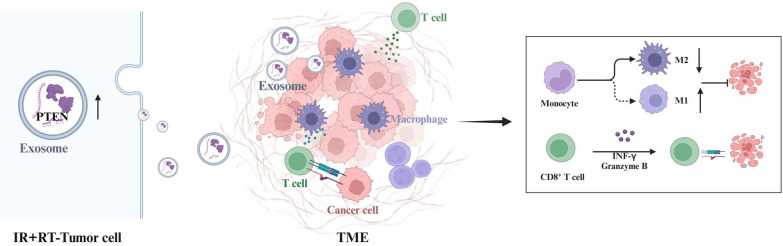
Background: In the context of nasopharyngeal carcinoma (NPC) treatment, radiotherapy combined with immunotherapy (IR + RT) is gaining traction. This study focuses on analyzing exosomal proteins, particularly Phosphatase and Tensin Homolog (PTEN), for predicting the efficacy of NPC treatments. Serum samples from NPC patients and IR + RT recipients were utilized for exosome (Exo) extraction and subsequent transcriptomic and proteomic analyses to identify treatment-related proteins. Flow cytometry of cells and exosomal analysis were performed to examine these proteins. In vitro experiments using C666-1 cells and their Exos explored various cellular responses, while a murine subcutaneous NPC model investigated the impact of PTEN modulation on tumor growth and the immune microenvironment.

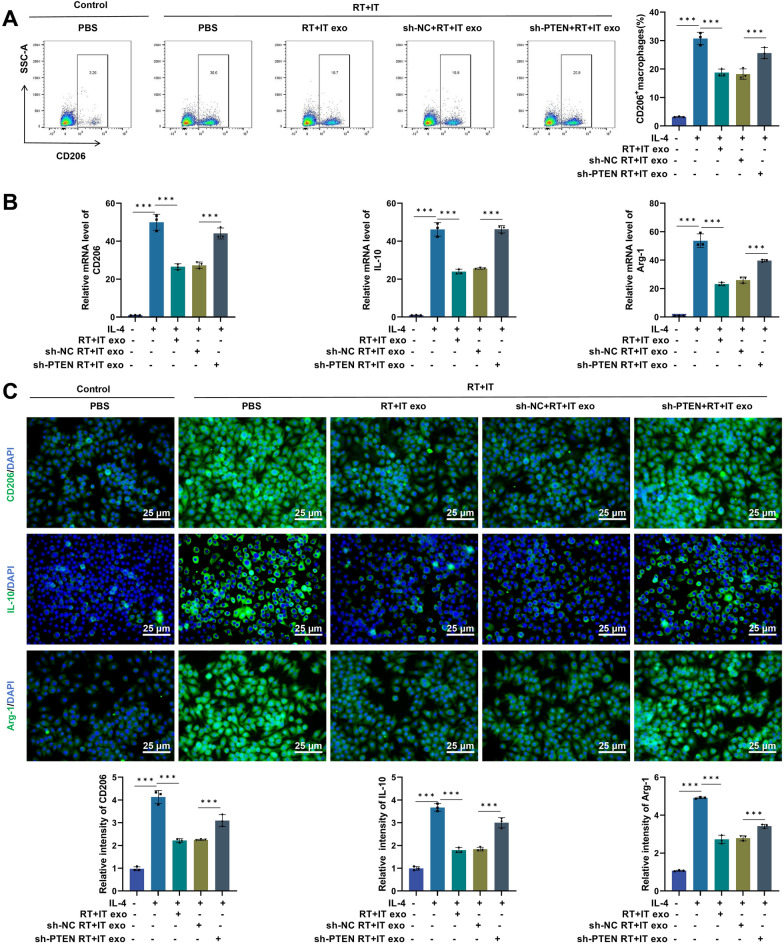
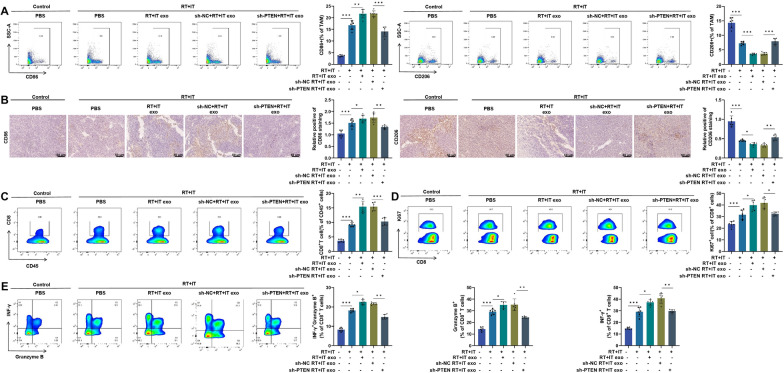
Results: The study demonstrated that PTEN serves as a crucial predictive biomarker, with its expression changes correlated with M2 macrophage polarization and CD8+ T cell activity. This highlights the potential significance of PTEN in predicting treatment outcomes and influencing the immune response in NPC.

Conclusion: The findings suggest that PTEN could play a key role in enhancing the efficacy of NPC radiotherapy and immunotherapy. By shedding light on PTEN's impact on tumor growth and the immune microenvironment, this study lays the groundwork for future personalized therapeutic strategies in NPC treatment.

Keywords: Exosome; Immunotherapy; Machine learning; Nanofluidic technology; Nasopharyngeal carcinoma; Phosphatase and Tensin Homolog; Radiotherapy; Tumor microenvironment.


Conflict of interest statement

Declarations. Ethics approval and consent to participate: Written informed consent was obtained from all participants, and the study was approved by Scientific Research Ethics Committee of China Medical University. All mouse experiments were conducted in accordance with institutional guidelines and approved by the Animal Care and Use Committee of China Medical University. Consent for publication: Not applicable. Competing interests: The authors declare no competing interests.

Figures

Fig. 1
Fig. 1
Preparation and characterization of NPC exo and RT + IT-NPC exo. A TEM observation of the morphological characteristics of NPC exo and RT + IT-NPC exo (scale bar = 100 nm); B WB analysis for the expression of CD63, CD81, Calnexin, and Alix in NPC exo and RT + IT-NPC exo; C NTA to assess the particle size distribution of NPC exo and RT + IT-NPC exo; D Immunofluorescence detection of C666-1 cells' uptake of Cy5.5-labeled exos (scale bar = 25 μm), with Cy5.5 marking NPC exo and RT + IT-NPC exo in red, and DAPI staining the nuclei in blue; E In vivo fluorescence imaging to track the biodistribution of exos in major organs and tumors across groups. Cell experiments were repeated three times, and each mouse group consisted of six individuals
Fig. 2
Fig. 2
Intersection of DEGs/DEPs in NPC exo and RT + IT-NPC exo samples identified through transcriptomic and proteomic analysis. A Volcano plots of DEGs from transcriptomic sequencing data in NPC exo and RT + IT-NPC exo groups (NPC exo group = 3, RT + IT-NPC exo group = 3). Red dots represent significantly upregulated genes, blue dots represent significantly downregulated genes, and black dots indicate no differential expression. B Heatmap of the top 50 most significantly upregulated and downregulated genes from transcriptomic sequencing data, with red indicating high expression and blue indicating low expression. C Volcano plots of DEGs from proteomic sequencing data in NPC exo and RT + IT-NPC exo groups (NPC exo group = 6, RT + IT-NPC exo group = 6). Red dots signify significantly upregulated genes, blue dots signify significantly downregulated genes, and black dots show no expression difference. D Heatmap of the top 50 most significantly upregulated and downregulated genes from proteomic sequencing data, with red representing high expression and blue representing low expression. E Venn diagram showing the intersection of DEGs from transcriptomic sequencing data and DEPs from proteomic sequencing data. F Analysis of the correlation between log2FC of intersecting DEGs/DEPs from transcriptomic and proteomic datasets. Quadrants 1 and 9: mRNA and corresponding proteins are inconsistent, indicating post-transcriptional or post-translational regulation, such as miRNA targeting genes. Quadrants 2 and 8: mRNA expression differences with no corresponding protein change, suggesting post-transcriptional or translational-level regulation. Quadrants 3 and 7: mRNA and corresponding proteins show the same pattern of expression differences, indicating simultaneous transcriptional and translational changes. Quadrants 4 and 6: Protein expression differences with no corresponding mRNA changes, potentially due to translational regulation or protein accumulation. Quadrant 5: Co-expressed mRNA/proteins do not show differential expression; most genes and proteins show no differential expression
Fig. 3
Fig. 3
Selection and validation of feature genes. A The LASSO algorithm identified 3 feature genes. B The SVM-RFE algorithm identified 31 feature genes. C Venn diagram showing the intersection of results from two machine learning algorithms, yielding 1 common gene. D ROC curve of PTEN in the sequencing dataset. E Expression of PTEN in transcriptomic sequencing data (NPC exo group = 3, RT + IT-NPC exo group = 3). F Expression of PTEN in proteomic sequencing data (NPC exo group = 6, RT + IT-NPC exo group = 6). **p < 0.01, ***p < 0.001
Fig. 4
Fig. 4
Impact of PTEN knockdown on the efficacy of RT + IT in C666-1 cells. A Flow cytometry analysis of apoptosis in each group. B EdU assay to assess cell proliferation capabilities (red fluorescence indicates proliferating cells, with DAPI staining nuclei in blue) (scale bar: 50 μm). C Colony formation assay to evaluate the colony-forming ability of cells in each group. D Wound healing assay to measure cell migration ability in each group. E Transwell assay to assess cell invasion and migration capabilities (scale bar = 50 μm). *p < 0.05, ***p < 0.001. All cell experiments were repeated three times
Fig. 5
Fig. 5
Effect of PTEN knockdown on the efficacy of RT + IT in subcutaneous xenograft mice. A Tumor growth curves for each mouse group. B Tumor weights of each mouse group. C H&E staining images of tumors from each group (scale bar = 50 μm). D Immunohistochemical analysis of Ki67 expression in tumors from each mouse group (scale bar = 50 μm). Asterisks indicate statistical comparisons between groups, *p < 0.05, ***p < 0.001. Each group consisted of six mice
Fig. 6
Fig. 6
Impact of PTEN knockdown on macrophages. A Flow cytometry analysis of CD206 expression in each cell group. B RT-PCR analysis of M2 macrophage markers CD206, IL-10, and Arg-1 mRNA expression in each cell group. C Immunofluorescence analysis of M2 macrophage markers CD206, IL-10, and Arg-1 expression in each cell group (scale bar = 25 μm). ***p < 0.001. All cell experiments were repeated three times
Fig. 7
Fig. 7
Effects of PTEN knockdown on CD8+ T cells. A EdU assay to assess proliferation of CD8+ T cells in each group, with proliferating cells indicated by red fluorescence and nuclei marked by DAPI (blue) (scale bar = 50 μm). B Flow cytometry analysis of apoptosis in CD8+ T cells across different groups. C Flow cytometry analysis of the proportions of TNF-γ+Granzyme B+CD8+ T cells, TNF-γ+CD8+ T cells, and Granzyme B+CD8+ T cells in each group. D ELISA to measure TNF-γ and Granzyme B levels in cells from each group. ***p < 0.001. All cell experiments were repeated three times
Fig. 8
Fig. 8
PTEN knockdown effects on immune microenvironment macrophages and T cells. A Flow cytometry analysis of the ratio of M1 to M2 macrophages in each mouse group. B Immunohistochemistry to assess the expression of CD86 and CD206 in mice from each group (scale bar = 50 μm). C Flow cytometry analysis of the proportion of CD8+ T cells in each mouse group. D Flow cytometry analysis of the proportion of Ki67+CD8+ T cells in each mouse group. E Flow cytometry analysis of the proportions of IFN-γ+ Granzyme B+ CD8+ T cells, IFN-γ+ CD8+ T cells, and Granzyme B+ CD8+ T cells in each group. ***p < 0.001. Each group consisted of six mice
Fig. 9
Fig. 9
Schematic of the molecular mechanism for predicting the efficacy of RT + IT in NPC using exosomal protein PTEN

Similar articles

References

    1. Wong KCW, Hui EP, Lo K-W, Lam WKJ, Johnson D, Li L, et al. Nasopharyngeal carcinoma: an evolving paradigm. Nat Rev Clin Oncol. 2021. 10.1038/s41571-021-00524-x. - PubMed
    1. Available from: http://jpp.krakow.pl/journal/archive/02_22/pdf/10.26402/jpp.2022.1.12.pdf
    1. King AD. MR imaging of nasopharyngeal carcinoma. Magn Reson Imaging Clin N Am. 2022. 10.1016/j.mric.2021.06.015. - PubMed
    1. Huang H, Yao Y, Deng X, Huang Z, Chen Y, Wang Z, et al. Immunotherapy for nasopharyngeal carcinoma: current status and prospects (review). Int J Oncol. 2023. 10.3892/ijo.2023.5545. - PMC - PubMed
    1. Morisaki T, Ohguri T, Yahara K, Nakahara S, Kakinouchi S, Itamura H, et al. Salvage re-irradiation with intensity-modulated radiotherapy, chemotherapy combined with hyperthermia for local recurrence of nasopharyngeal carcinoma after chemoradiotherapy. J UOEH. 2021. 10.7888/juoeh.43.355. - PubMed

MeSH terms

LinkOut - more resources