

Integrating machine learning models with multi-omics analysis to decipher the prognostic significance of mitotic catastrophe heterogeneity in bladder cancer
- PMID: 40259382
- PMCID: PMC12012998
- DOI: 10.1186/s13062-025-00650-x
Integrating machine learning models with multi-omics analysis to decipher the prognostic significance of mitotic catastrophe heterogeneity in bladder cancer
Abstract
Background: Mitotic catastrophe is well-known as a major pathway of endogenous tumor death, but the prognostic significance of its heterogeneity regarding bladder cancer (BLCA) remains unclear.
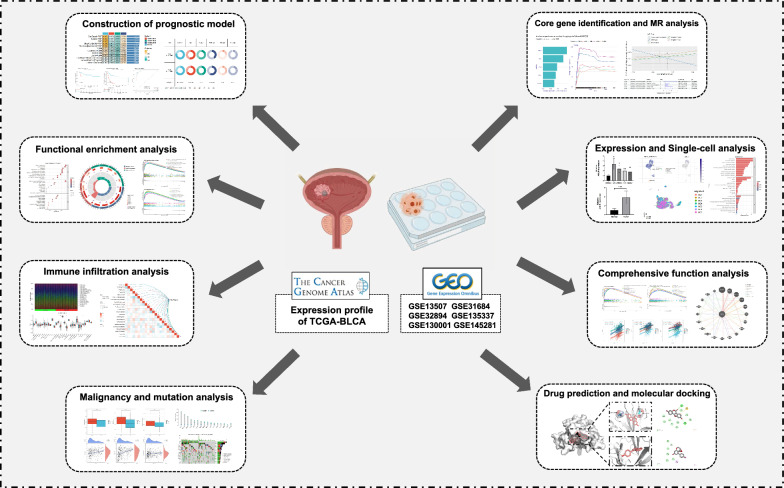
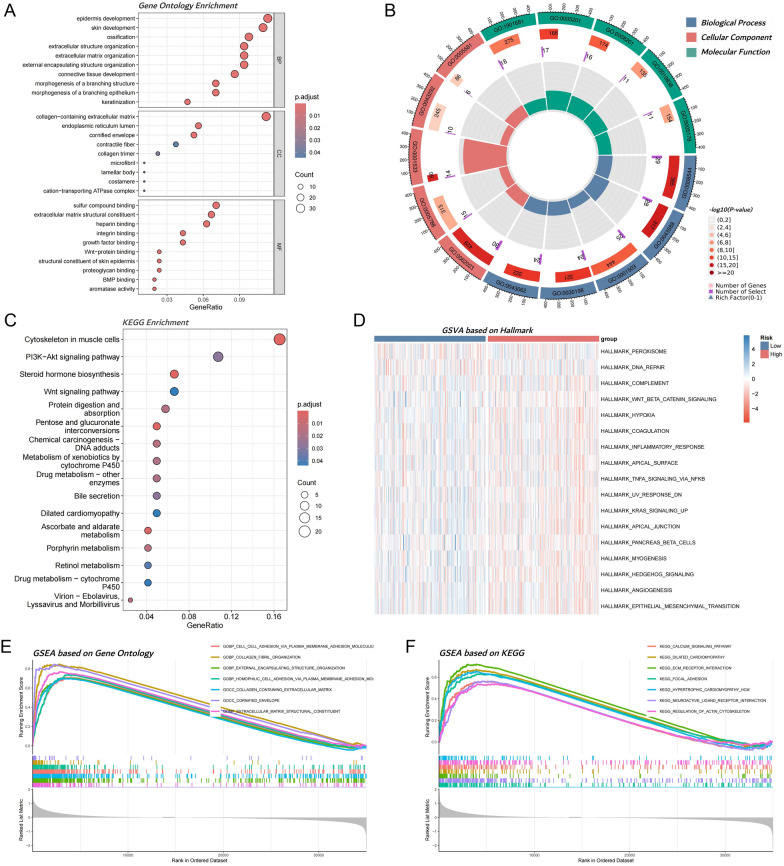
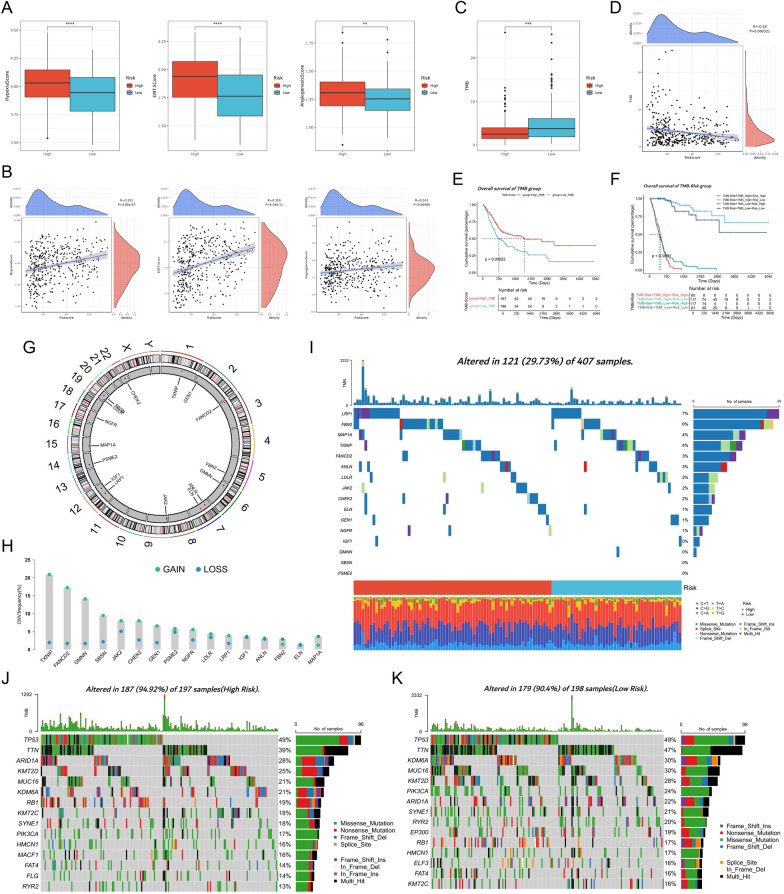
Methods: Our study focused on digging deeper into the TCGA and GEO databases. Through differential expression analysis as well as Weighted Gene Co-expression Network Analysis (WGCNA), we identified dysregulated mitotic catastrophe-associated genes, followed by univariate cox regression as well as ten machine learning algorithms to construct robust prognostic models. Based on prognostic stratification, we revealed intergroup differences by enrichment analysis, immune infiltration assessment, and genomic variant analysis. Subsequently by multivariate cox regression as well as survshap(t) model we screened core prognostic gene and identified it by Mendelian randomization. Integration of qRT-PCR, immunohistochemistry, and single-cell analysis explored the core gene expression landscape. In addition, we explored the ceRNA axis containing upstream non-coding RNAs after detailed analysis of pathway activation, immunoregulation, and methylation functions of the core genes. Finally, we performed drug screening and molecular docking experiments based on the core gene in the DSigDB database.
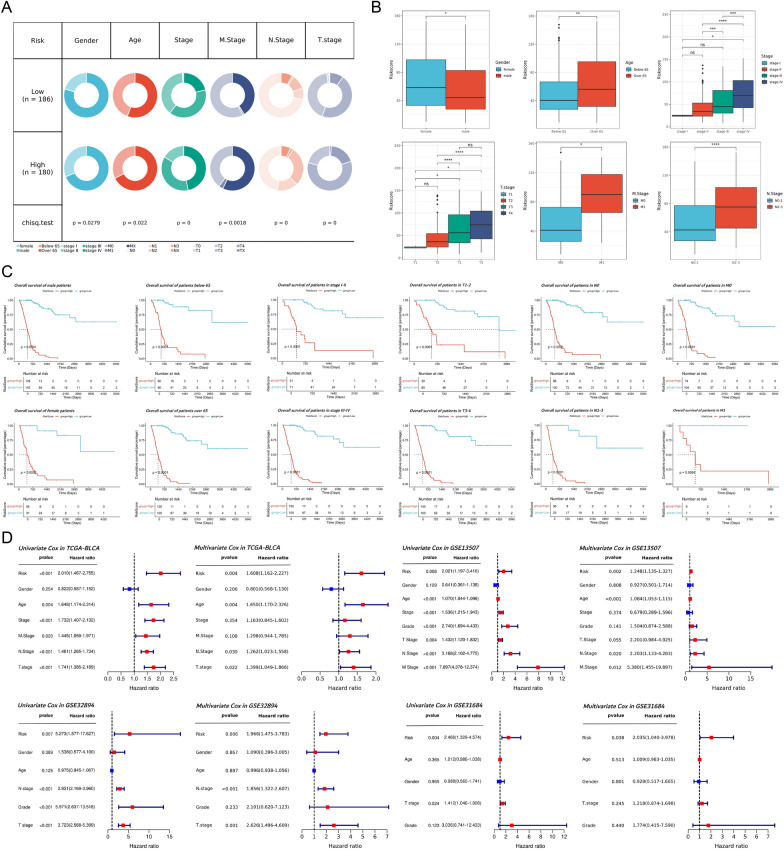
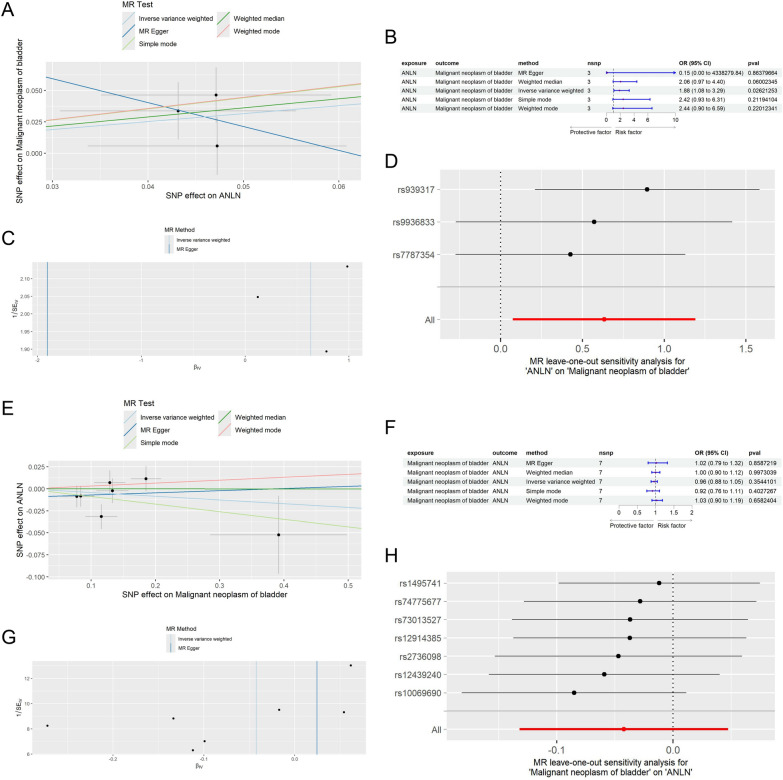
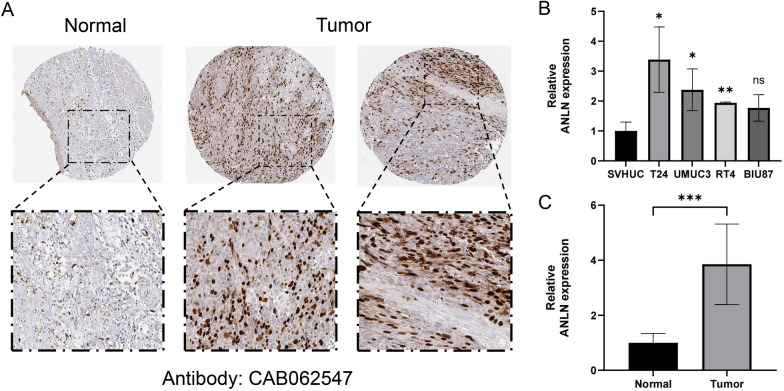
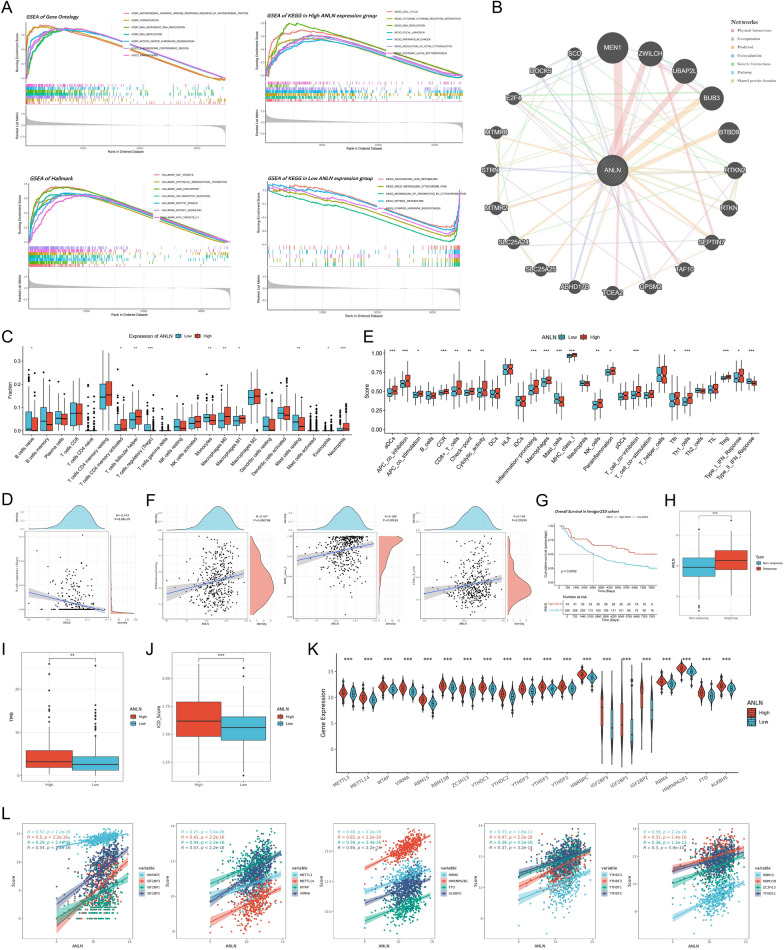
Results: Our efforts culminated in the establishment of an accurate prognostic model containing 16 genes based on Coxboost as well as the Random Survival Forest (RSF) algorithm. Detailed analysis from multiple perspectives revealed a strong link between model scores and many key indicators: pathway activation, immune infiltration landscape, genomic variant landscape, and personalized treatment. Subsequently ANLN was identified as the core of the model, and prognostic analysis revealed that it portends a poor prognosis, further corroborated by Mendelian randomization analysis. Interestingly, ANLN expression was significantly upregulated in cancer cells and specifically clustered in epithelial cells and provided multiple pathways to mediate cell division. In addition, ANLN regulated immune infiltration patterns and was also inseparable from overall methylation levels. Further analysis revealed potential regulation of the MIR4435-2HG, hsa-miR-15a-5p, ANLN axis and highlighted a range of potential therapeutic agents including Phytoestrogens.
Conclusion: The model we developed was a powerful predictive tool for BLCA prognosis and revealed the impact of mitotic catastrophe heterogeneity on BLCA in multiple dimensions, which then guided clinical decision-making. Furthermore, we highlighted the potential of ANLN as a BLCA target.
Keywords: ANLN; Bladder cancer; Machine learning; Mendelian randomization; Mitotic catastrophe; Prognosis; Single cell.
© 2025. The Author(s).
Conflict of interest statement
Declarations. Ethics approval and consent to participate: Not applicable. Consent for publication: Not applicable. Competing interests: The authors declare no competing interests.
Figures


Similar articles
-
Advancing personalized, predictive, and preventive medicine in bladder cancer: a multi-omics and machine learning approach for novel prognostic modeling, immune profiling, and therapeutic target discovery.Front Immunol. 2025 Apr 22;16:1572034. doi: 10.3389/fimmu.2025.1572034. eCollection 2025. Front Immunol. 2025. PMID: 40330458 Free PMC article.
-
ADME gene-driven prognostic model for bladder cancer: a breakthrough in predicting survival and personalized treatment.Hereditas. 2025 Mar 19;162(1):42. doi: 10.1186/s41065-025-00409-4. Hereditas. 2025. PMID: 40108724 Free PMC article.
-
Generalized machine learning based on multi-omics data to profile the effect of ferroptosis pathway on prognosis and immunotherapy response in patients with bladder cancer.Environ Toxicol. 2024 Feb;39(2):680-694. doi: 10.1002/tox.23949. Epub 2023 Aug 30. Environ Toxicol. 2024. PMID: 37647346
-
LIG1 is a novel marker for bladder cancer prognosis: evidence based on experimental studies, machine learning and single-cell sequencing.Front Immunol. 2024 Aug 21;15:1419126. doi: 10.3389/fimmu.2024.1419126. eCollection 2024. Front Immunol. 2024. PMID: 39234248 Free PMC article.
-
Identification of a tumor microenvironment-related seven-gene signature for predicting prognosis in bladder cancer.BMC Cancer. 2021 Jun 10;21(1):692. doi: 10.1186/s12885-021-08447-7. BMC Cancer. 2021. PMID: 34112144 Free PMC article.
Cited by
-
Integrative single-cell and bulk transcriptomic analysis reveals the landscape of T cell mitotic catastrophe associated genes in esophageal squamous cell carcinoma.Hum Genomics. 2025 Aug 29;19(1):99. doi: 10.1186/s40246-025-00815-9. Hum Genomics. 2025. PMID: 40883817 Free PMC article.
References
-
- Lenis AT, Lec PM, Chamie K, Mshs MD. Bladder cancer: a review. JAMA. 2020;324(19):1980–91. - PubMed
-
- Lobo N, Shariat SF, Guo CC, Fernandez MI, Kassouf W, Choudhury A, Gao J, et al. What is the significance of variant histology in urothelial carcinoma? Eur Urol Focus. 2020;6(4):653–63. - PubMed
-
- Berdik C. Unlocking bladder cancer. Nature. 2017;551(7679):S34–5. - PubMed
MeSH terms
LinkOut - more resources
Full Text Sources
Medical
