

Obesity, Visceral Adipose Tissue, and Essential Hypertension: Evidence From a Mendelian Randomization Study and Mediation Analysis
- PMID: 40259745
- PMCID: PMC12012245
- DOI: 10.1111/jch.70045
Obesity, Visceral Adipose Tissue, and Essential Hypertension: Evidence From a Mendelian Randomization Study and Mediation Analysis
Abstract
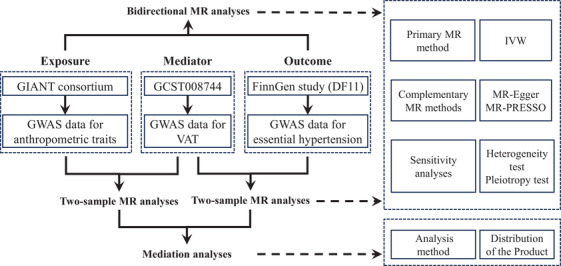
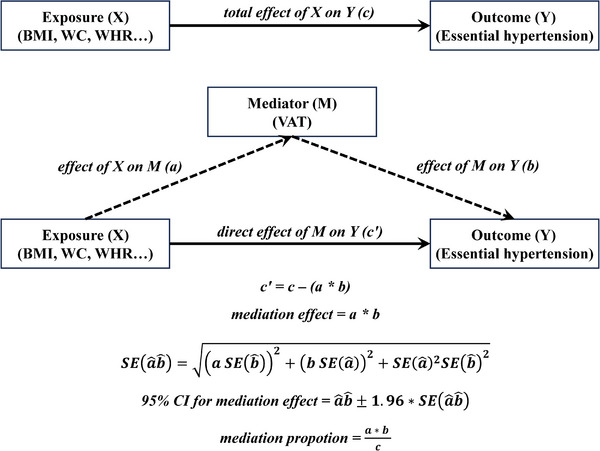
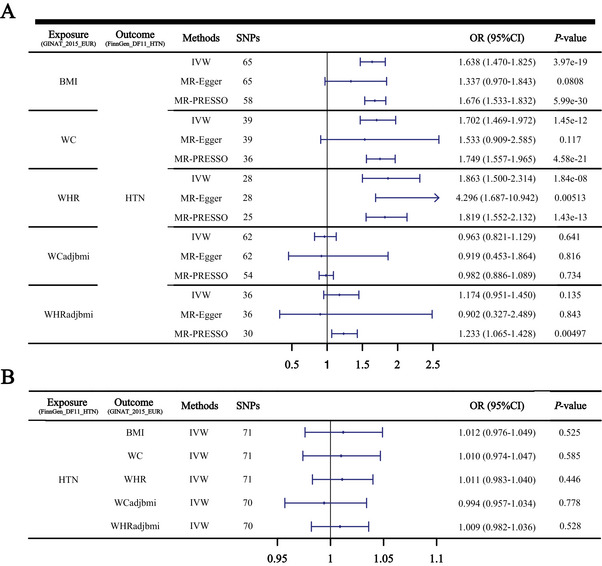
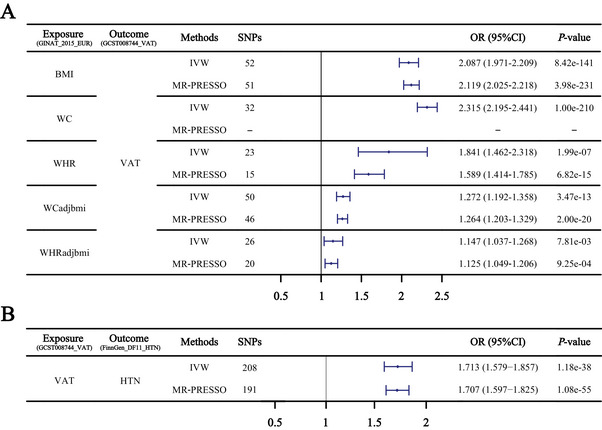
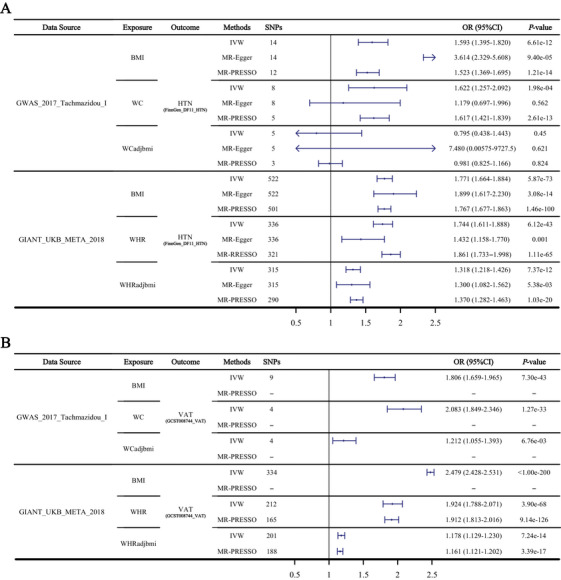
This study aims to investigate the causal relationship between obesity and essential hypertension, and evaluate the mediation effect of visceral adipose tissue (VAT) by Mendelian randomization (MR) analysis. We included body mass index (BMI), waist circumference (WC), waist-hip ratio (WHR), WC adjusted for BMI (WCadjbmi), and WHR adjusted for BMI (WHRadjbmi) as obesity-related anthropometric traits. In the bidirectional MR analyses, we found that higher BMI (OR, 1.638; p = 3.97 × 10⁻¹⁹), WC (OR, 1.702; p = 1.45 × 10⁻¹²), and WHR (OR, 1.863; p = 1.84 × 10⁻⁸) were significantly associated with increased risk of essential hypertension, while no evidence of reverse causality was observed. Then, in the two-step MR analyses, all five anthropometric traits had a positive and significant association with VAT mass, especially WC (OR, 2.315; p = 1.00 × 10-210). Meanwhile, higher predicted VAT mass was significantly associated with increased risk of essential hypertension (OR, 1.713; p = 1.18 × 10-38). Furthermore, the mediation analyses revealed that VAT had a significant mediation effect on the causal relationship between obesity-related anthropometric traits and essential hypertension, and mediated proportions in BMI, WC, and WHR were 77.8%, 80.1%, and 41.4%, respectively. Finally, the sensitivity analyses using two other datasets showed a similar result. In conclusion, our results showed that BMI, WC, and WHR have a positive and significant association with increased risk of essential hypertension. Moreover, VAT has a significant mediation effect on the causal relationship between obesity-related anthropometric traits and essential hypertension. Our study provided important statistical evidence suggesting that VAT may play a crucial meditation role in the occurrence and development of obesity-related hypertension.
Keywords: Mendelian randomization; body mass index; essential hypertension; mediation analysis; obesity; visceral adipose tissue; waist circumference; waist‐hip ratio.
© 2025 The Author(s). The Journal of Clinical Hypertension published by Wiley Periodicals LLC.
Conflict of interest statement
The authors declared no conflict of interest.
Figures
Similar articles
-
Estimating causality between smoking and abdominal obesity by Mendelian randomization.Addiction. 2024 Jun;119(6):1024-1034. doi: 10.1111/add.16454. Epub 2024 Mar 20. Addiction. 2024. PMID: 38509034
-
Phenome-Wide Investigation of the Causal Associations Between Pre-Pregnancy Obesity Traits and Gestational Diabetes: A Two-Sample Mendelian Randomization Analyses.Reprod Sci. 2025 Feb;32(2):395-403. doi: 10.1007/s43032-024-01577-w. Epub 2024 May 24. Reprod Sci. 2025. PMID: 38789873
-
Causal associations of waist circumference and waist-to-hip ratio with type II diabetes mellitus: new evidence from Mendelian randomization.Mol Genet Genomics. 2021 May;296(3):605-613. doi: 10.1007/s00438-020-01752-z. Epub 2021 Feb 25. Mol Genet Genomics. 2021. PMID: 33629185
-
Causality of visceral adipose tissue on chronic kidney disease and renal function measure indicators, and mediation role of hypertension: Mendelian randomization study.Obes Rev. 2025 Feb;26(2):e13845. doi: 10.1111/obr.13845. Epub 2024 Oct 10. Obes Rev. 2025. PMID: 39390683 Free PMC article. Review.
-
Visceral adiposity and colorectal adenomas: dose-response meta-analysis of observational studies.Ann Oncol. 2015 Jun;26(6):1101-1109. doi: 10.1093/annonc/mdu563. Epub 2014 Dec 5. Ann Oncol. 2015. PMID: 25480876 Review.
References
-
- Blüher M., “Obesity: Global Epidemiology and Pathogenesis,” Nature Reviews Endocrinology 15 (2019): 288–298. - PubMed
-
- Piché M.‐E., Tchernof A., and Després J.‐P., “Obesity Phenotypes, Diabetes, and Cardiovascular Diseases,” Circulation Research 126 (2020): 1477–1500. - PubMed
-
- Koskinas K. C., Van Craenenbroeck E. M., Antoniades C., et al., “Obesity and Cardiovascular Disease: An ESC Clinical Consensus Statement,” European Heart Journal 45 (2024): 4063–4098. - PubMed
MeSH terms
Grants and funding
LinkOut - more resources
Full Text Sources
Medical
