. 2025:13:45458-45467.
doi: 10.1109/access.2025.3549638. Epub 2025 Mar 10.

Elevational Synthetic Aperture Focusing for Rotated Array-Based Three-Dimensional Ultrasound Imaging

Affiliations

Elevational Synthetic Aperture Focusing for Rotated Array-Based Three-Dimensional Ultrasound Imaging

Ryo Murakami et al. IEEE Access. 2025.

Abstract

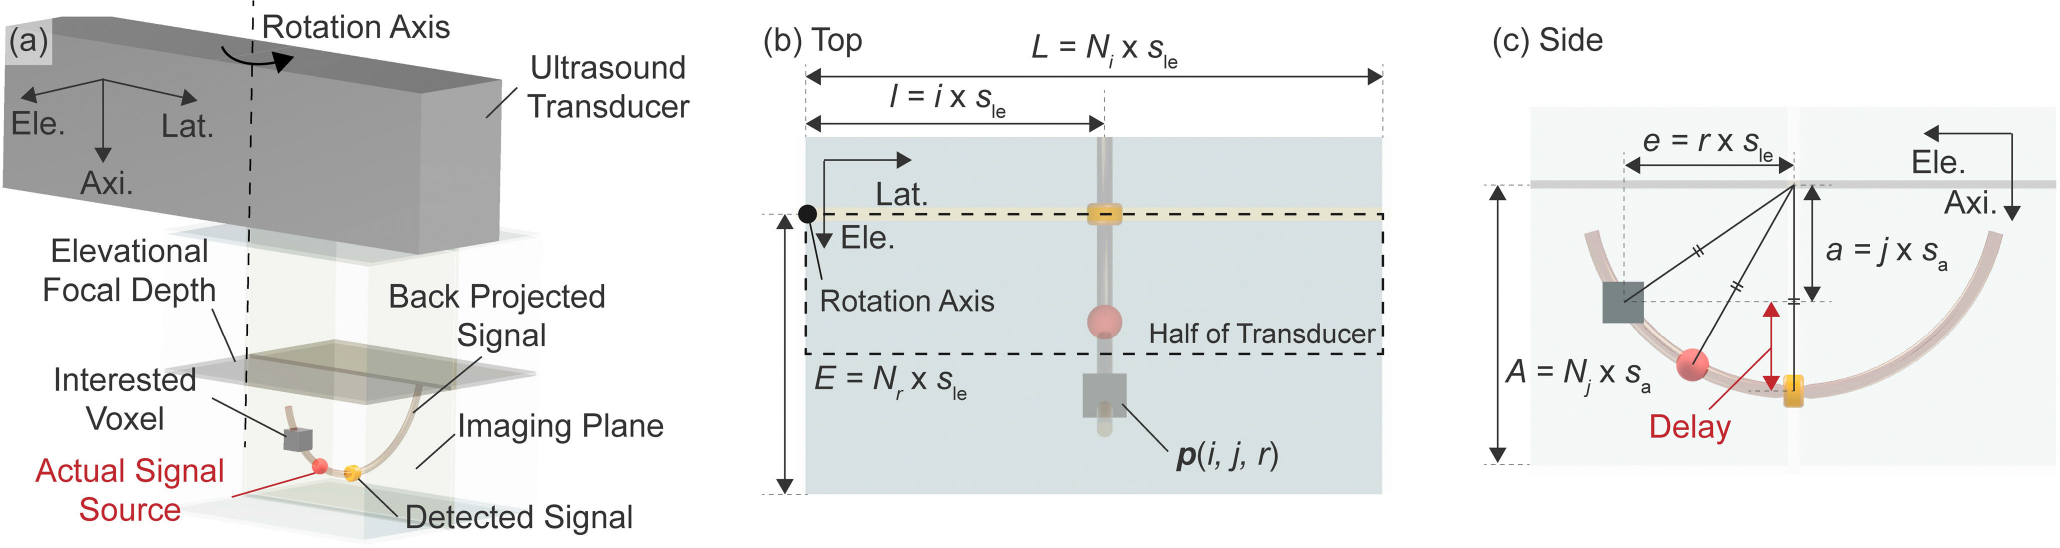
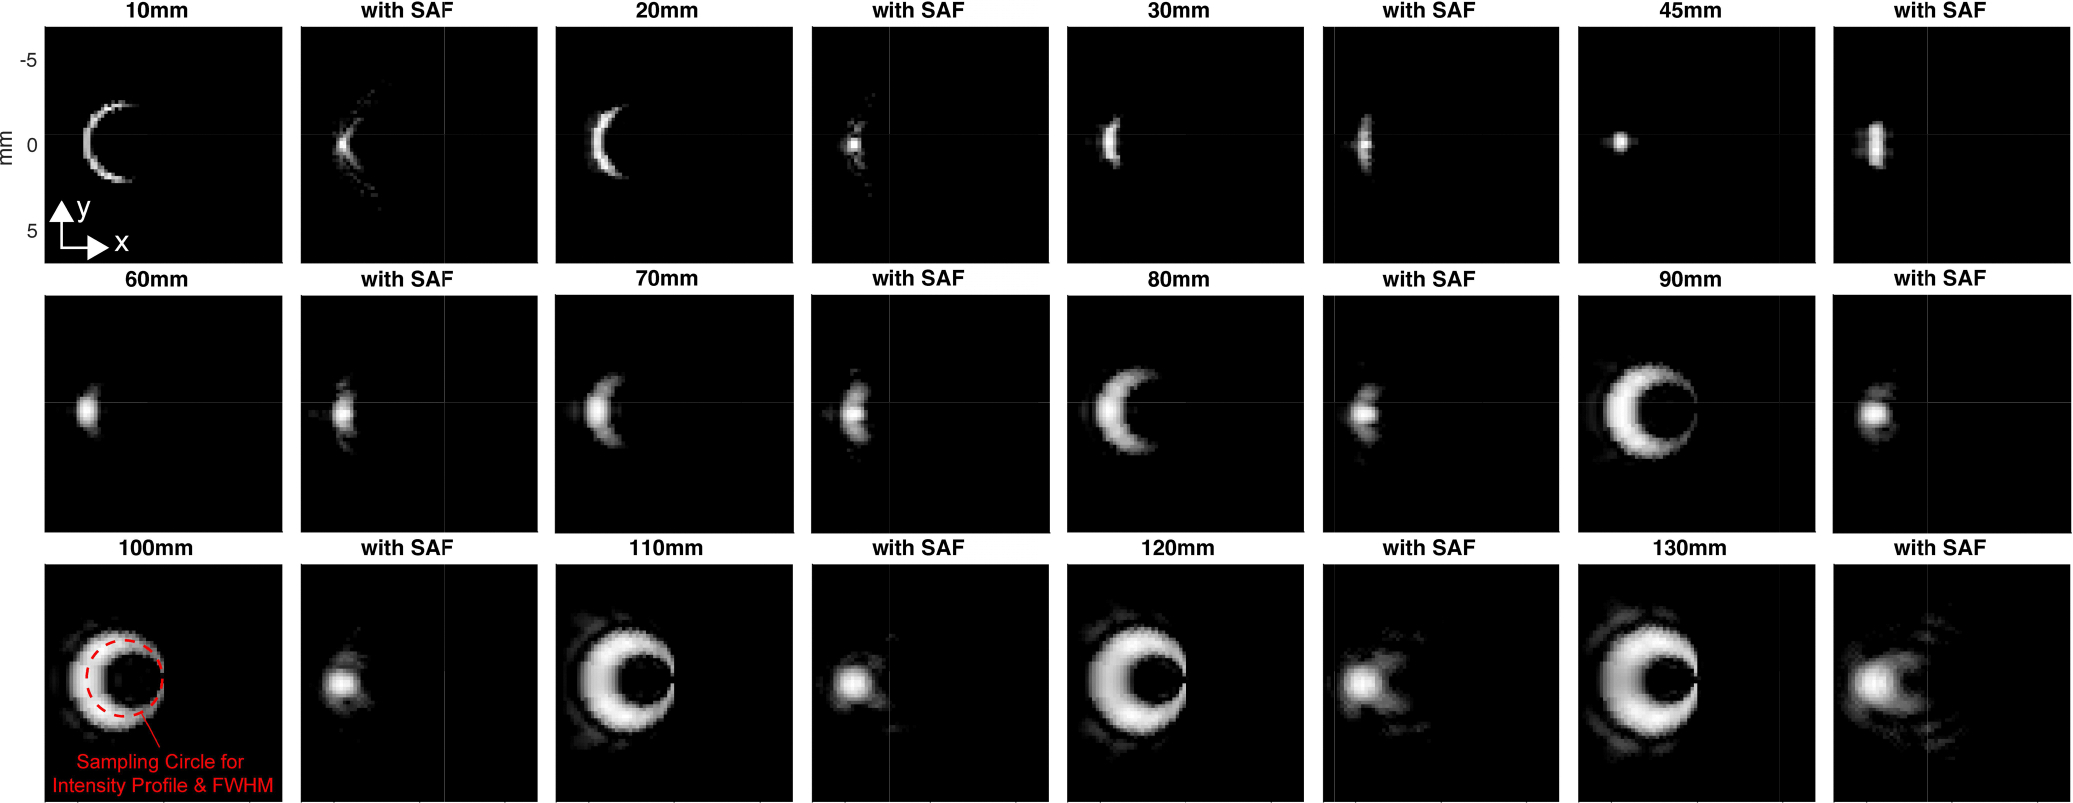
Three-dimensional (3D) ultrasound (US) imaging is widely used for real-time, non-ionizing, and cost-effective medical diagnostics. However, using a one-dimensional (1D) transducer often results in limited elevational resolution due to the inherent beam thickness. In this paper, we introduce an elevational Synthetic Aperture Focusing (SAF) algorithm specifically designed for rotational 3D US imaging. Unlike previous methods requiring channel data, our approach operates on in-plane beamformed radio-frequency (RF) data, making it more accessible on many commercial scanners. Through simulations and experiments, we demonstrate significant improvements in elevational resolution (up to 96.4%) and contrast (up to 274.7%). These findings highlight the potential of the proposed algorithm to enhance both research and clinical applications of rotational 3D US imaging.

Keywords: Biomedical imaging; focusing; image processing; medical diagnostic imaging; ultrasonics imaging.


Figures

FIGURE 1.
FIGURE 1.
Schematics showing the concept of the proposed Synthetic Aperture Focusing Algorithm. (a) Bird’s eye view, (b) Top view, (c) Side view; The lateral half of the acquired ultrasound signal is used for back projection. The detected signal on the imaging plane is back-projected along the elevational axis at the angle the arc representing the back-projected signal will be vertically flipped between the upper and the lower region from the focal depth.
FIGURE 2.
FIGURE 2.
Schematics representing the idea of the back-projection-based signal enhancement. (a) Bird’s eye view, (b) Top view; The back-projected signals as arcs are expected to intersect in the 3D space at the location of the actual signal source and provide enhanced intensity after the summation.
FIGURE 3.
FIGURE 3.
Drawings showing the simulation environment in the Field II software involving the linear array transducer and point target, (a) Bird’s-eye view, (b) Side view.
FIGURE 4.
FIGURE 4.
1D transducer array probe for rotational 3D US imaging [20].
FIGURE 5.
FIGURE 5.
Breast phantom; (a) Photo from the top, (b) B-mode ultrasound image capturing the targeted cyst.
FIGURE 6.
FIGURE 6.
MIP images for the point target simulation study (The dynamic range is 20 dB) For each depth, the left and right images represent without and with the SAF algorithm, respectively.
FIGURE 7.
FIGURE 7.
Intensity profile corresponding to the simulated MIP images with/without the SAF algorithm (Figure 6). The profiles are sampled along the circular line to take into account the rotational motion.
FIGURE 8.
FIGURE 8.
Parametric comprehensive simulation study of FWHM. (Left) Without SAF, (Center) With SAF, (Right) Improved Rate after SAF. Each FWHM is calculated by sampling the circular line to take into account the rotational motion.
FIGURE 9.
FIGURE 9.
Simulated cyst phantoms placed at 20 and 60 mm in depth (Left: B-scan, Right: C-scan, Dynamic Range: 60dB. Scale Bar: 5mm. Window for CNR: Red: Target, Blue: Background).
FIGURE 10.
FIGURE 10.
Comprehensive simulation study of the cyst imaging performance. The CNR is calculated for each condition and the average and the standard deviation are shown. The results are shown for the B-scan and the C-scan. (Left): Diameter of cyst as a parameter, (Center): Depth of cyst as a parameter, (Right): Distance from the rotation center as a parameter. (“Distance” is the abbriviation of “Distance from the rotation center”.)
FIGURE 11.
FIGURE 11.
MIP images of the experiment results with point target placed at the depths of 15, 25, 120 and 130 mm. For each depth, the left and right images represent without and with the SAF algorithm, respectively (The dynamic range is 10dB ). Note that each image was independently rotated so that the target is located on the left and at the vertical center for the interest of image processing.
FIGURE 12.
FIGURE 12.
Intensity profile corresponding to the simulated MIP images with/without the SAF algorithm (Figure 11). The profiles are sampled along the circular line to take into account the rotational motion.
FIGURE 13.
FIGURE 13.
Cyst imaging in the breast phantom (Figure 5). (Top) B-scan, (Bottom) C-scan, (Left) without SAF, (Right) with SAF (The dynamic range is 35 dB. Scale bar: 5 mm. Window for CNR: Red: Target, Blue: Background.)

References

    1. Szabo TL, Diagnostic Ultrasound Imaging: Inside Out. New York, NY, USA: Academic, 2004.
    1. Smith SW, Lee W, Light ED, Yen JT, Wolf P, and Idriss S, “Two dimensional arrays for 3-D ultrasound imaging,” in Proc. IEEE Ultrason. Symp, vol. 2, May 2002, pp. 1545–1553.
    1. Light ED and Smith SW, “Two dimensional arrays for real time 3D intravascular ultrasound,” Ultrason. Imag, vol. 26, no. 2, pp. 115–128, Apr. 2004. - PubMed
    1. Yen JT and Smith SW, “Real-time rectilinear 3-D ultrasound using receive mode multiplexing,” IEEE Trans. Ultrason., Ferroelectr., Freq. Control, vol. 51, no. 2, pp. 216–226, Feb. 2004. - PubMed
    1. Huang Q and Zeng Z, “A review on real-time 3D ultrasound imaging technology,” BioMed Res. Int, vol. 2017, no. 1, 2017, Art. no. 6027029. - PMC - PubMed

LinkOut - more resources