. 2025 May;241(5):e70046.
doi: 10.1111/apha.70046.

Hemodynamics and Drinking in the Giraffe

Affiliations

Hemodynamics and Drinking in the Giraffe

Christian Aalkjær et al. Acta Physiol (Oxf). 2025 May.

Abstract

Background: The circulation of 4-6 m tall giraffes is markedly affected by gravity. To ensure cerebral perfusion, upright giraffes generate a blood pressure in excess of 200 mmHg. Before drinking, the head is lowered by 3-5 m, providing exceptional hemodynamic challenges. Here, we provide quantitative hemodynamic measures during head movement and drinking.

Methods: We measured carotid pressure, jugular pressure, heart rate, and blood flow in awake giraffes, along with circulating blood volume and cerebrospinal fluid pressure in anesthetized giraffes. We also analyzed the contractility and innervation of isolated cerebral and extracranial arteries, and the mechanical properties of jugular veins.

Results: When heads were lowered for drinking (i) blood pressure at heart level decreased but increased again during drinking, (ii) jugular pressure increased and oscillated during drinking, (iii) heart rate fell, (iv) carotid blood flow was unchanged, while cephalic hemodynamic resistance increased, and (vi) cranial cerebrospinal fluid pressure increased. Small cerebral arteries exhibited strong myogenic responses, particularly at around 100 mmHg, while extracranial arteries responded at higher pressures (200-250 mmHg). The giraffe's blood volume was small and blood pressure sensitive to minor reductions in blood volume.

Conclusions: Central blood pressure decreased when the head was lowered, but drinking per se caused a surprising rise in blood pressure to pre-drinking levels. This rise in blood pressure is likely due to the transfer of esophageal water boli acting on the jugular veins. The cephalic capillaries are protected by a strong myogenic response and sympathetic innervation.

Keywords: blood pressure; giraffes; gravitational physiology; hypertension.


Conflict of interest statement

The authors declare no conflicts of interest.

Figures

FIGURE 1
FIGURE 1
(A) Proximal and distal carotid pressures and heart rate in a giraffe rising from sternal to upright position after anesthesia. Triangle indicates failed attempt to rise; arrow indicates successful attempt to rise. (B) Mean and SEM values for heart rate (left panel, n = 11) and for systolic and diastolic carotid pressures at proximal (middle panel, n = 11), and distal (right panel, n = 4) catheters before and after standing up and at the peak hemodynamic changes. ANOVA for repeated measures followed by Tukey's test; *p < 0.05, ***p < 0.005, o p > 0.05.
FIGURE 2
FIGURE 2
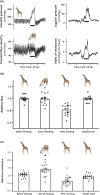
(A) Proximal carotid pressure (red), proximal jugular pressure (blue) and heart rate of an instrumented giraffe moving its head repeatedly from the upright position to a near horizontal position. Head position (black) shown on right axis; at the lowest position values the neck is horizontal indicated by the lower hatched line; at the highest values the neck is in an upright position indicated by the upper hatched line. The tracing is typical for recordings obtained in five giraffes. (B) Mean proximal and distal carotid pressures and heart rate in upright and horizontal position in four giraffes. Mean values and SEM in red. Paired t‐test of pressure and heart rate changes: *p < 0.05, ***p < 0.005, o p > 0.05.
FIGURE 3
FIGURE 3
(A) Upper panel: Changes in proximal carotid pressure (red line, left axis) occurring in relation to changes in head position (black line, right axis). Middle panel: Changes in proximal jugular venous pressure (blue line, left axis) occurring in relation to changes in head position (black line, right axis). Lower panel: Changes in heart rate (red line, left axis) occurring in relation to changes in head position (black line, right axis). For “Head position”, maximal and minimal values correspond to erect and ground level positions, respectively (indicated by hatched lines in upper panel). The insert shows the jugular venous pressure at an expanded timescale. Tracings are unedited; sudden, large excursions shortly after middle of drinking period in all three panels represent artifacts. (B) Mean and SEM of proximal carotid systolic and diastolic pressures (A), distal carotid systolic and diastolic pressures (B), heart rate (C), and proximal jugular pressures (D) at steady state before drinking in upright position (“Before”), at the end of a drinking head down position (“Drinking”), at the peak hemodynamic transient associated with lifting of the head after drinking (“After drinking”), and at steady state after drinking in upright position (“Steady state”). Each data point represents the mean value of multiple (average: 9) drinking episodes in each giraffe. Difference between means was tested with paired t‐test; *p < 0.05, **p < 0.01, ***p < 0.005, o p > 0.05.
FIGURE 4
FIGURE 4
(A) Carotid and jugular pressures and carotid flow halfway up the neck in connection with an episode of drinking (one giraffe). Horizontal black bars indicate active drinking. Vascular resistance is calculated from carotid pressure and flow data. (B and C) Vascular flow velocity and vascular resistance, respectively, from 12 drinking episodes in one giraffe (dots) and two drinking episodes in another giraffe (triangles). Data are normalized to the mean value of “Before” drinking and “Steady state” after drinking.
FIGURE 5
FIGURE 5
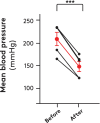
Effect on mean arterial blood pressure of withdrawal of 10% of measured total blood volume from five anesthetized giraffes. Mean values and SEM are indicated in red. Paired t‐test; ***p < 0.005.
FIGURE 6
FIGURE 6
Calculated compliance of the jugular vein. Data based on load‐strain relationships and calculated intraluminal pressures (see Methods S1 and Figure S7). Load‐strain measurements were performed on three 2‐mm specimens from each of three locations, proximal, middle and distal, in seven giraffes.
FIGURE 7
FIGURE 7
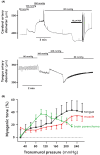
(A) Diameter of isolated pressurized cerebral (upper panel) and tongue (lower panel) arteries. The intraarterial pressures were changed as indicated and the cerebral artery was stimulated with 10 μM noradrenaline (NA) as indicated. (B) Myogenic tone as a function of intraarterial pressure in isolated small arteries from the brain parenchyma (n = 5), tongue (n = 6), and upper neck muscle (n = 8). Vertical bars indicate SEM.

References

    1. Goetz R. H., “Preliminary Observations of the Circulation in the Giraffe,” Transactions of the American College of Cardiology 5 (1955): 239–248. - PubMed
    1. Hargens A. R., Millard R. W., Pettersson K., and Johansen K., “Gravitational Haemodynamics and Oedema Prevention in the Giraffe,” Nature 329, no. 6134 (1987): 59–60. - PubMed
    1. Lawrence W. E. and Rewell R. E., “The Cerebral Blood Supply in the Giraffidae,” Proceedings of the Zoological Society 118 (1948): 202–212.
    1. Mitchell G. and Skinner J. D., “An Allometric Analysis of the Giraffe Cardiovascular System,” Comparative Biochemistry and Physiology. Part A, Molecular & Integrative Physiology 154, no. 4 (2009): 523–529. - PubMed
    1. Van Citters R. L., Franklin D. L., Vatner S. F., Patrick T., and Warren J. V., “Cerebral Hemodynamics in the Giraffe,” Transactions of the Association of American Physicians 82 (1969): 293–304. - PubMed

LinkOut - more resources