. 2025 Jul 2;13(7):1004-1021.
doi: 10.1158/2326-6066.CIR-24-0127.

NEDDylation Regulates CD8+ T-cell Metabolism and Antitumor Immunity

Affiliations

NEDDylation Regulates CD8+ T-cell Metabolism and Antitumor Immunity

Borja Jiménez-Lasheras et al. Cancer Immunol Res. .

Abstract

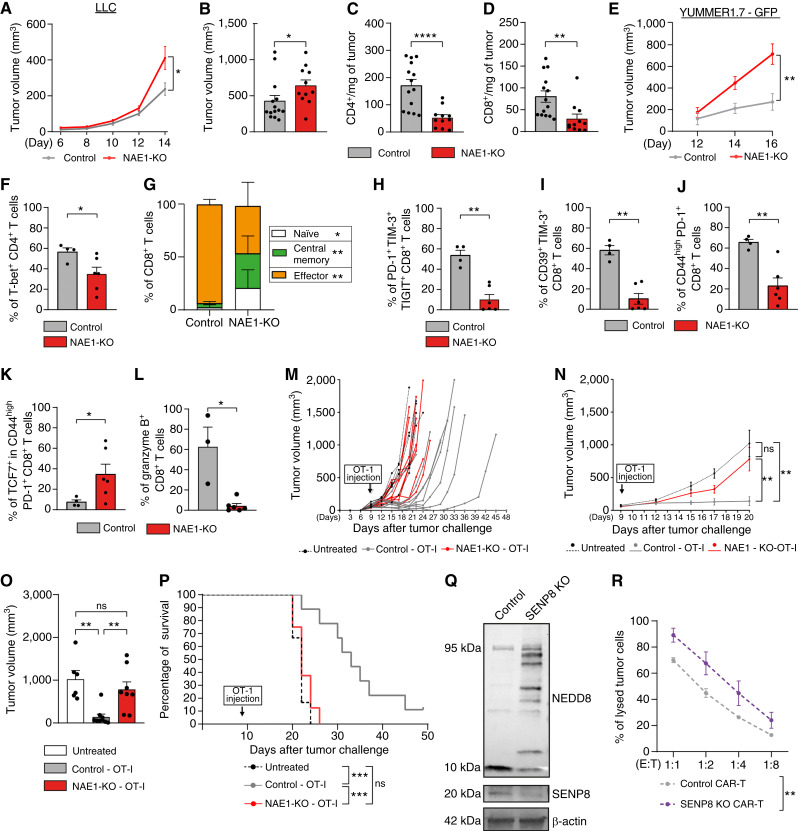
NEDDylation is a posttranslational modification whereby the ubiquitin-like molecule NEDD8 is attached to protein substrates in a process dependent on NEDD8-activating enzyme regulatory subunit (NAE1). NEDDylation is emerging as a regulator of cancer biology, but its precise role in antitumor immunity has not been thoroughly characterized. In this study, we examine the impact of NEDDylation in CD8+ T cell-mediated antitumor responses. Analysis of publicly available single-cell RNA sequencing databases revealed that CD8+ tumor-infiltrating lymphocytes showed increased expression of NEDD8 during their differentiation into effector memory cells. In vitro activation of mouse and human CD8+ T cells drove the upregulation of the NEDDylation enzymatic pathway, resulting in an enrichment of NEDDylated proteins. In vivo tumor challenge assays demonstrated that CD8+ T cells lacking NAE1 exhibited reduced antitumor capability and a less activated phenotype with compromised differentiation into effector cells. Upregulating NEDDylation by knocking out deNEDDylase sentrin-specific protease 8 increased the in vitro cytotoxic capability of CD8+ CAR T cells. In addition, LC MS/MS proteomic analyses of NAE1-deficient CD8+ T cells and CD8+ T cells treated with the NEDDylation inhibitor MLN4924 showed a pronounced impairment in metabolic pathways, including glycolysis and oxidative phosphorylation. In this context, we validated lactate dehydrogenase A, α-enolase, and hexokinase 1, which are relevant glycolytic enzymes, as NEDD8 targets. In line with this, NEDDylation-deficient CD8+ T cells demonstrated reduced transcription, protein expression, and enzymatic activity of lactate dehydrogenase. In summary, we uncover NEDDylation as a critical regulator of CD8+ T cell-mediated antitumor immunity.


Conflict of interest statement

B. Jiménez-Lasheras reports a patent for EP21382780 pending. A. Palazon reports a patent for EP21382780 pending. No disclosures were reported by the other authors.

Figures

Figure 1.
Figure 1.
NEDD8 expression is upregulated during the activation and differentiation into effector memory TILs. A, Uniform Manifold Approximation and Projection (UMAP) plot of immune and nonimmune cell populations generated by analyzing publicly available scRNA-seq data of patients with lung cancer (left). Violin plots showing NEDD8 expression in the different immune and nonimmune cell populations associated with lung cancer microenvironment (right). B, Dot plots showing the mean expression levels of NEDD8 in 5-cell interactions (n = 50) across the indicated types of cancer and phenotypes. Cells with zero expression of NEDD8 were not considered in this analysis. C, Representative immunofluorescence images showing NEDD8 expression in mouse CD3+ TILs (n = 3, scale bar = 10 μm; scale bar for zoomed image = 2 μm). D, Relative RNA expression levels of NEDD8, Ube2m, and Nae1 in mouse primary CD8+ T cells upon activation with anti-CD3 and anti-CD28 antibodies, at the indicated timepoints, measured by RT-qPCR using Rplp0 as housekeeping gene (n = 3, each sample was assessed in triplicate). E, Relative RNA expression levels of NEDD8, UBE2M, and NAE1 in human primary CD8+ T cells upon activation with anti-CD3 and anti-CD28 antibodies, at the specified timepoints, measured by RT-qPCR, using 18S as housekeeping gene (n = 4, two independent experiments, each sample was assessed in triplicate). F, Western blot showing the expression of NEDDylated cullins, NAE1, free NEDD8, β-actin, and UBC12 (UBE2M) in mouse CD8+ T cells, under the described activation conditions (n = 3, two independent experiments). The same membrane was sequentially probed and developed after each incubation with the following antibodies: 1°, anti-NAE1 (top half membrane)/anti-UBC12 (bottom half membrane); 2°, anti–β-actin; 3°, anti-NEDD8. The loading control was run on the same blot as the experimental samples. G, Western blot showing the expression of NEDDylated cullins, NAE1, free NEDD8, β-actin, and UBC12 (UBE2M) in human primary CD8+ T cells under the indicated activation conditions (n = 3, two independent experiments). Two separate membranes were used. The first membrane was sequentially probed and developed after each incubation with the following antibodies: 1°, anti-NAE1; 2°, anti-NEDD8; and 3°, anti–β-actin. A second membrane, loaded with the same protein samples, was used to detect: 1°, UBC12; 2°, β-actin. In both membranes, the loading control was run on the same blot as the experimental samples. Data represented as the mean ± SEM, and analyzed using an unpaired t test. *, P ≤ 0.05; ***, P ≤ 0.001; ****, P ≤ 0.0001.
Figure 2.
Figure 2.
NEDDylation promotes the survival and proliferation of CD8+ T cells. A, Schematic representation of the generation of T cell–specific NAE1-KO mouse model. B, Western blot showing the reduction of NEDDylated cullins as a result of the deletion of NAE1 or the pharmacologic inhibition with MLN4924 in mouse CD8+ T cells activated for 3 days (n = 5, four independent experiments). Two separate membranes were used. The first membrane was sequentially probed and developed after each incubation with the following antibodies: 1°, anti-NEDD8; 2°, anti–β-actin. A second membrane, loaded with the same protein samples, was sequentially probed and developed after each incubation with the following antibodies: 1°, anti-NAE1; 2°, anti–β-actin. In both membranes, the loading control was run on the same blot as the experimental samples. C, Western blot showing the reduction of NEDDylated cullins as a result of the pharmacologic inhibition with MLN4924 in CD8+ T cells at the defined doses and activated for 3 days (n = 5, four independent experiments). The same membrane was sequentially probed and developed after each incubation with the following antibodies: 1°, anti-NAE1; 2°, anti-NEDD8; 3°, anti–β-actin. The loading control was run on the same blot as the experimental samples. D, Percentage of alive (7AAD annexin V) and late apoptotic (7AAD+ annexin V+) mouse CD8+ T cells at day 3 (left) and day 6 (right) of activation (n = 3, unpaired parametric t test). E, Percentage of alive human CD8+ T cells (DAPI-negative) at day 3 (left) and day 6 (right) of activation, treated with MLN4924 at the specified doses and analyzed by flow cytometry (n = 3, ordinary one-way ANOVA). F, Percentage of increase in cell count of mouse CD8+ T cells, at the defined timepoints, in control, NAE1-KO or MLN4924-treated CD8+ T cells (n = 3, unpaired parametric t test). G, Representative histograms showing the proliferation of control, NAE1-KO, or MLN4924-treated mouse CD8+ T cells, measured by a CFSE dilution assay at day 3 of activation (n = 3). H, Division index corresponding to the CFSE dilution assay shown in (G)(n = 3, unpaired parametric t test). I, Western blot showing the protein levels of WEE-1 and α-tubulin in control, NAE1-KO, and MLN4924-treated mouse CD8+ T cells, activated for 3 days (n = 4, two independent experiments). The same membrane was sequentially probed and developed after each incubation with the following antibodies: 1°, anti-WEE-1; 2°, anti-β-ACTIN. The loading control was run on the same blot as the experimental samples. J, Representative histograms showing the proliferation of control and MLN4924-treated human CD8+ T cells, measured by a CFSE dilution assay at day 5 of activation (n = 4). K, Division index corresponding to the CFSE dilution assay shown in (I) (n = 4, ordinary one-way ANOVA). L, CD69 expression measured by flow cytometry (gMFI) at day 3 of activation in control (n = 13) and NAE1-KO (n = 14) CD8+ T cells (four independent experiments, unpaired parametric t test. M, CD69 expression measured by flow cytometry (gMFI) 12 hours after activation in control and NAE1-KO CD8+ T cells (ordinary one-way ANOVA. N, NF-κB activity measured in Jurkat TPR cells treated with MLN4924 at the indicated doses, upon activation with anti-CD3 and anti-CD28 for 1 day, and analyzed by flow cytometry (n = 6, two independent experiments, ordinary one-way ANOVA). O, NFAT activity measured in Jurkat TPR cells in the same conditions as in (J) (n = 6, two independent experiments, ordinary one-way ANOVA). Data are represented as the mean ± SEM. *, P ≤ 0.05; **, P ≤ 0.01; ***, P ≤ 0.001; ****, P ≤ 0.0001. gMFI, geometric mean fluorescence intensity.
Figure 3.
Figure 3.
Deletion of NAE1 accelerates tumor growth and decreases the number of TILs, impairing their differentiation into effector CD8+ cells. A, Mean tumor volume of control (n = 14) and NAE1-KO (n = 11) mice after the subcutaneous injection of the LLC tumor cell line (three independent experiments, unpaired nonparametric Mann–Whitney test). B, Tumor volume measurement of control (n = 14) and NAE1-KO (n = 11) mice at endpoint day after subcutaneous injection of the LLC tumor cell line (unpaired nonparametric Mann–Whitney test). C, Absolute number of CD4+ T cells per milligram of tumor at endpoint day in control (n = 14) and NAE1-KO (n = 11) mice after subcutaneous injection of the LLC tumor cell line, analyzed by flow cytometry (unpaired nonparametric Mann–Whitney test). D, Absolute number of CD8+ T cells per milligram of tumor, in the same conditions as in (C). E, Mean tumor volume of control (n = 11) and NAE1-KO (n = 12) mice after the subcutaneous injection of YUMMER 1.7-GFP tumor cell line (two independent experiments, unpaired nonparametric Mann–Whitney test). F, Percentage of T-bet+ CD4+ T cells (unpaired nonparametric Mann–Whitney test). G, Intratumoral CD8+ T-cell phenotype of control (n = 4) and NAE1-KO (n = 6) mice analyzed by flow cytometry (effector: CD44+ CD62L; central memory: CD44+ CD62L+; naïve: CD44 CD62L+, unpaired nonparametric Mann–Whitney test). H, Percentage of intratumoral CD8+ T cells triple-positive for PD-1, TIM-3, and TIGIT (unpaired nonparametric Mann–Whitney test). I, Percentage of intratumoral CD8+ T cells double-positive for CD39 and TIM-3 (unpaired nonparametric Mann–Whitney test). J, Percentage of intratumoral CD8+ T cells double-positive for CD44high and PD-1 (unpaired nonparametric Mann–Whitney test). K, Percentage of TCF7+ cells in intratumoral CD8+ T cells double-positive for CD44high and PD-1 (unpaired nonparametric Mann–Whitney test). L, Percentage of granzyme B+ intratumoral CD8+ T cells (unpaired nonparametric Mann–Whitney test). M, Individual tumor development of untreated (discontinuous black, n = 6), control-OT-I (gray, n = 9), or NAE1-KO-OT-I (red, n = 8) treated mice. Tumor growth was measured at the indicated timepoints (two independent experiments). N, Mean tumor development of untreated (n = 6), control-OT-I (n = 9), or NAE1-KO-OT-I (n = 8)–treated mice between OT-I injection day and day 20, when the first mouse reached endpoint (two independent experiments, one-way ANOVA–Kruskal–Wallis test). O, Mean tumor volume measured in the previously indicated groups at day 20 (one-way ANOVA–Kruskal–Wallis test). P, Kaplan–Meier survival analysis of the specified groups (log-rank Mantel–Cox test). Q, Western Blot showing the expression of NEDDylated proteins in control (hAAVS1 KO as safe harbor gene) and SENP8 KO CD8+ T cells (n = 4, two independent experiments). The same membrane was sequentially probed and developed after each incubation with the following antibodies: 1°, anti-NEDD8; 2°, anti–β-actin; 3°, anti-SENP8. The loading control was run on the same blot as the experimental samples. R, Percentage of lysis of RAMOS-ZsGreen cells cocultured with human SENP8-KO CD8+ CAR T cells. Cytotoxicity assay was performed for 24 hours at the indicated effector (T cell) to target (tumor cell) ratios (E:T ratios). (n = 2, two-way ANOVA). Data are represented as the mean ± SEM. *, P ≤ 0.05; **, P ≤ 0.01; ***, P ≤ 0.001; ****, P ≤ 0.0001; ns, not significant.
Figure 4.
Figure 4.
Deletion or inhibition of NAE1 in activated CD8+ T cells impairs key metabolic pathways. A, Impaired pathways in NAE1-KO and MLN4924-treated CD8+ T cells activated for 3 days, in comparison with control cells. Z-score and P values are obtained by the IPA software (n = 4 per condition, Fisher exact test). B, Heatmap showing row-normalized dysregulated proteins in metabolic pathways (glycolysis, HIF-1α signaling, and oxidative phosphorylation) comparing NAE1-KO and MLN4924-treated CD8+ T cells with control CD8+ T cells. (n = 4 per condition). C, Representative scheme for extracellular acidification rate (ECAR) measurement in control and NAE1-KO activated mouse CD8+ T cells, activated for 3 days and measured using Agilent Seahorse XF Cell Glycolytic Rate Assay Kit (one mouse represented per condition, total n = 3). D, Representative scheme for oxygen consumption rate (OCR) measurement in control and NAE1-KO mouse CD8+ T cells, activated for 3 days and measured with Agilent Seahorse XF Cell Mito Stress Test Kit (one mouse represented per condition, total n = 3). E, Basal glycolysis and (F) compensatory glycolysis expressed as the glycolytic proton efflux rate (GlycoPER, unpaired parametric t test). G, Basal respiration, expressed as OCR measurement (unpaired parametric t tests). H, Representative scheme for ECAR measurement in control and MLN4924-treated human CD8+ T cells, activated for 3 days and measured using Agilent Seahorse XF Cell Glycolytic Rate Assay Kit (one healthy donor represented per condition, total n = 4 from two independent experiments). I, Representative scheme for OCR measurement in control and MLN4924-treated activated human CD8+ T cells, activated for 3 days and measured using Agilent Seahorse XF Cell Mito Stress Test Kit (one healthy donor represented per condition, total n = 3). J, Basal glycolysis and (K) compensatory glycolysis expressed as the GlycoPER (paired parametric t test). L, Basal respiration expressed OCR measurement (paired parametric t test). Data are represented as the mean ± SEM. *, P ≤ 0.05; **, P ≤ 0.01; ***, P ≤ 0.001. Rot/AA, rotenone and antimycin A.
Figure 5.
Figure 5.
NEDD8 binds to three glycolytic enzymes, affecting the transcript levels, the protein expression, and the activity of LDHA. A, Workflow of the process of validation of new NEDD8 targets. B, Dot plot representing enriched biological processes in the list of NEDD8 targets obtained from proteomics analysis (n = 2, two independent experiments). Data obtained from the Gene Ontology (GO) database. C, Western blot showing immunoprecipitated proteins by the NEDD8 antibody in human CD8+ T cells activated for 3 days. Input and IgG controls are shown (n = 3, three independent experiments). NEDDylated cullins are shown as a positive control. Two separate membranes were used. The first membrane was sequentially probed and developed after each incubation with the following antibodies: 1°, anti-NEDD8 (top half)/anti-ENO1 (bottom half); 2°, anti-HK-1 (top half). A second membrane, loaded with the same protein samples, was probed and developed after incubation with anti-LDH antibody. D, Western blot showing the expression of LDHA, ENO1, and HK-1 in activated human CD8+ T cells treated with MLN4924 at the indicated doses for 3 days (n = 3, two independent experiments). The same membrane was sequentially probed and developed after each incubation with the following antibodies: 1°, anti-HK-1 (top half)/anti-LDHA (bottom half); 2°, anti-NEDD8 (top half)/anti-ENO1 (bottom half); 3°, anti–β-ACTIN. The loading control was run on the same blot as the experimental samples. E, Western blot showing the expression of LDHA in control, NAE1-KO, and MLN4924-treated activated mouse CD8+ T cells after 3 days of culture (n = 5, two independent experiments). The same membrane was sequentially probed and developed after each incubation with the following antibodies: 1°, anti-NAE1; 2°, anti-NEDD8; 3°, anti–β-actin; 4°, anti-LDHA. The loading control was run on the same blot as the experimental samples. F, Relative mRNA expression levels of LDHA in activated human primary CD8+ T cells measured by RT-qPCR using 18S as housekeeping gene after 2 days of culture (n = 4, each sample was assessed in triplicate and analyzed using ordinary one-way ANOVA). G, Relative mRNA expression levels of LDHA in activated mouse primary CD8+ T cells measured by RT-qPCR using 36b4 as housekeeping gene after 2 days of culture (n = 4, each sample was assessed in triplicate and analyzed using an unpaired parametric t test). H, LDH activity measured in supernatants of control, MLN4924-treated, and NAE1-KO CD8+ T cells after 3 days of culture. (n = 7, two independent experiments; unpaired parametric t test). Data are represented as the mean ± SEM. *, P ≤ 0.05; **, P ≤ 0.01; ***, P ≤ 0.001.

References

    1. Li W, Li F, Zhang X, Lin H-K, Xu C. Insights into the post-translational modification and its emerging role in shaping the tumor microenvironment. Signal Transduct Target Ther 2021;6:422. - PMC - PubMed
    1. Shah K, Al-Haidari A, Sun J, Kazi JU. T cell receptor (TCR) signaling in health and disease. Signal Transduct Target Ther 2021;6:412. - PMC - PubMed
    1. Liu J, Cheng Y, Zheng M, Yuan B, Wang Z, Li X, et al. Targeting the ubiquitination/deubiquitination process to regulate immune checkpoint pathways. Signal Transduct Target Ther 2021;6:28. - PMC - PubMed
    1. Friend SF, Deason-Towne F, Peterson LK, Berger AJ, Dragone LL. Regulation of T cell receptor complex-mediated signaling by ubiquitin and ubiquitin-like modifications. Am J Clin Exp Immunol 2014;3:107–23. - PMC - PubMed
    1. Sun Y, Wei W, Jin J. Cullin-RING ligases and protein neddylation. Singapore: Springer; 2020. VIII. p. 372.

Grants and funding