

Published Erratum
doi: 10.1007/s11357-025-01616-7.
Correction to: Whole‑body networks: a holistic approach for studying aging
Affiliations
- PMID: 40261453
- PMCID: PMC12397030
- DOI: 10.1007/s11357-025-01616-7
Item in Clipboard
Published Erratum
Correction to: Whole‑body networks: a holistic approach for studying aging
Geroscience.
2025 Aug.
No abstract available
Figures

Example of the signals used in this study. The top signals correspond to fMRI-BOLD activity from the visual (VN) and sensorimotor (SMN) network. The bottom signals correspond to respiration (Lungs) and heart (Heart) rate. a.u.: arbitrary unit, IPM: inspirations per minute, BPM: beats per minute
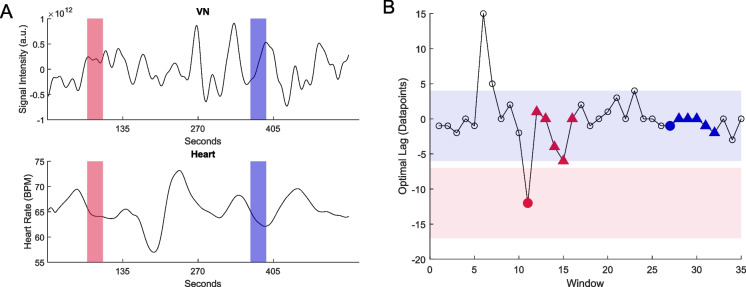
Demonstration of time delay stability (TDS). We started with the signals of visual network (VN) and heart rate (Heart), where we estimated the TDS in two different pairs of windows (red and blue) [Panel A]. In both sets of windows, we removed linear trends and normalized the time series. Then we estimated the optimal lag (where the absolute cross-correlation is maximized) and plotted it [Panel B]. The optimal lag for each window can be seen as a circle. We used the following five segments (50% overlap) (triangles in Panel B) to determine if a connection is stable. A connection is stable if four out of the five triangles are within the shaded areas. The shaded areas range from (optimal lag – 5 datapoints) to (optimal lag + 5 datapoints). The 5 datapoints cutoff corresponds to 7 s of lag in the time domain (7 s × sampling rate ≈ 5 datapoints). In this example, we see that the connection is stable only for the blue segment. a.u.: arbitrary unit, BPM: beats per minute

Regional variability of the constructed whole-body network. The red boxes correspond to connections that were significantly different in the elderly population. The blue boxes correspond to connections that were significantly different in the young population. White boxes represent non-significant differences. DMN: Default Mode Network, FPN: Frontoparietal Network, LN: Limbic Network, VAN: Ventral Attention Network, DAN: Dorsal Attention Network, SMN: Sensorimotor Network, VN: Visual Network
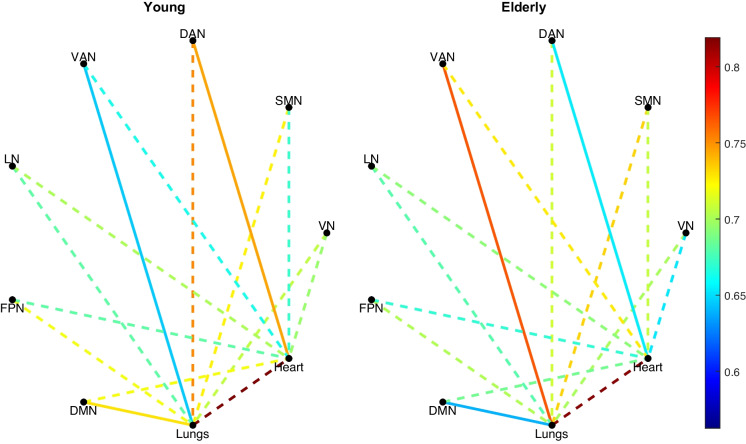
Comparison of young and elderly whole-body networks. The average time-delay stability value of the connections of the whole-body networks of the young (left) and elderly (right) is shown. Solid lines correspond to connections that were statistically different between the two populations. Dashed lines correspond to connections that were not statistically different between the two populations. DMN: Default Mode Network, FPN: Frontoparietal Network, LN: Limbic Network, VAN: Ventral Attention Network, DAN: Dorsal Attention Network, SMN: Sensorimotor Network, VN: Visual Network

Violin plots of the California Verbal Learning Task (CVLT) scores in the young and elderly population. The instructor read 16 words. The participant had to recall as many words as possible from this list. This was repeated four more times, using the same list of 16 words. The scores indicate the number of correct recalls the subjects had in the final (i.e. the fifth) trial

Correlations between network metrics (mean node degree/D and mean path length/L) and California Verbal Learning Task (CVLT) scores in the young population
Erratum for
-
Whole-body networks: a holistic approach for studying aging.Geroscience. 2025 Jun;47(3):4751-4762. doi: 10.1007/s11357-025-01540-w. Epub 2025 Jan 29. Geroscience. 2025. PMID: 39875752 Free PMC article.
Publication types
LinkOut - more resources
Full Text Sources
