. 2025 Aug;16(4):435-454.
doi: 10.1007/s13239-025-00785-y. Epub 2025 Apr 22.

Development of an Anatomy-Mimicking, Wave Transport-Preserving Mock Circulation Loop for Evaluating Pulsatile Hemodynamics as Supported by Cardiovascular Assist Devices

Affiliations

Development of an Anatomy-Mimicking, Wave Transport-Preserving Mock Circulation Loop for Evaluating Pulsatile Hemodynamics as Supported by Cardiovascular Assist Devices

Pong-Jeu Lu et al. Cardiovasc Eng Technol. 2025 Aug.

Abstract

Objective: Assessing circulatory hemodynamics in-vitro is crucial for cardiovascular device design before in-vivo testing. Current mock circulation loops (MCLs) rely on simplified, lumped-parameter hydraulic representations of human circulation. There is a need for a more sophisticated MCL that can accurately represent the human circulatory physiology and allow for critical assessment of device-supported hemodynamics.

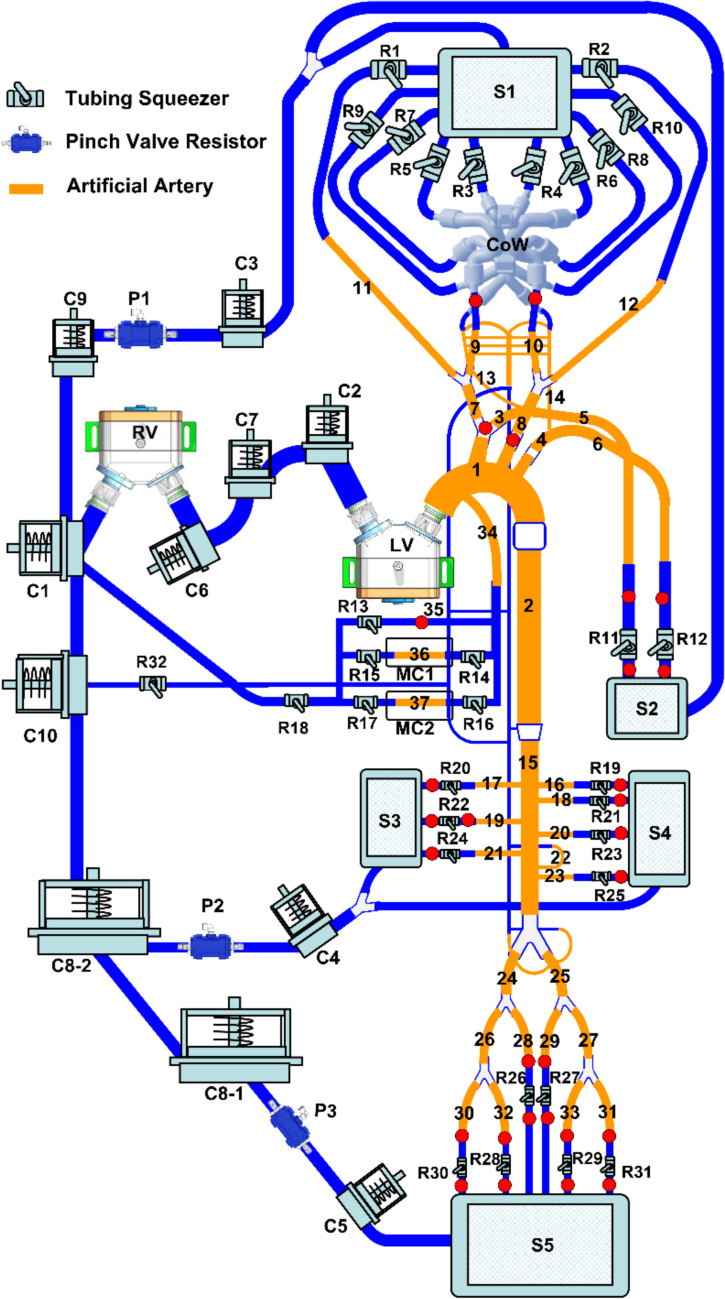
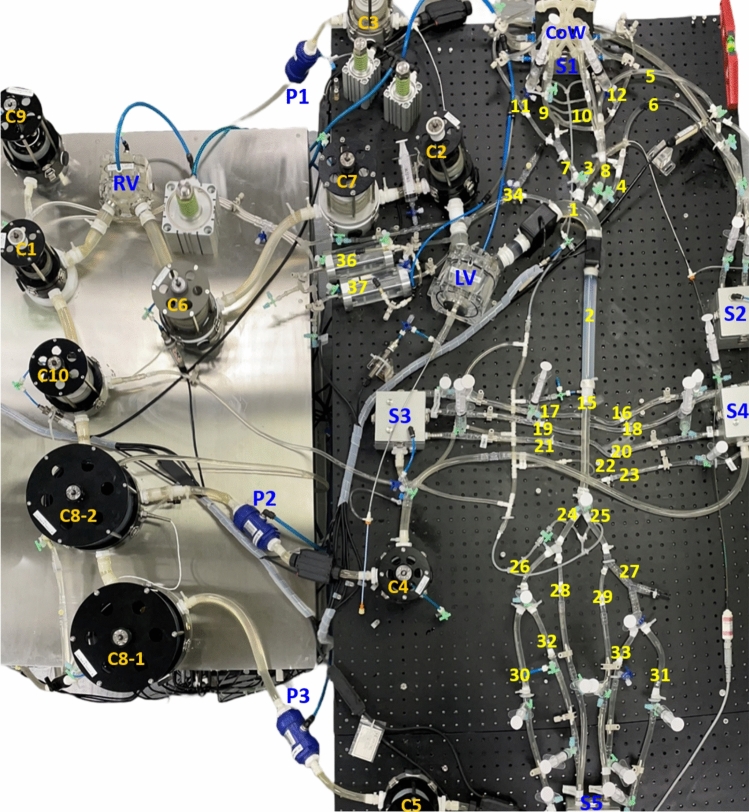
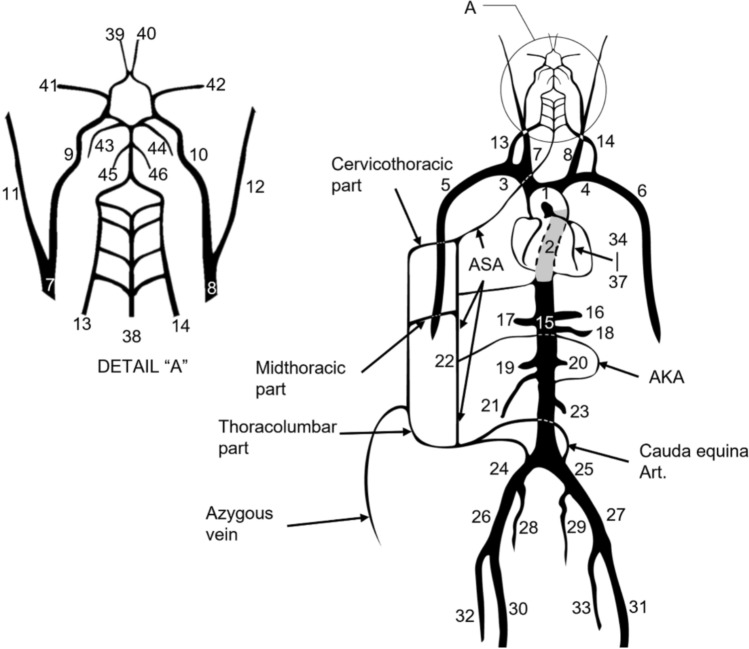
Methods: An anatomy-mimicking MCL design guided by one-dimensional flow models has been developed, using tree-like arterial casts to create a complex system. The MCL comprises cardiac simulators, systemic circulatory subsystems consisting of 46 connected arterial casts, and lumped venous and pulmonary components. A parameter tuning process was also developed to ensure that the simulated MCL baselines are consistent with targeted healthy or heart failure scenarios.

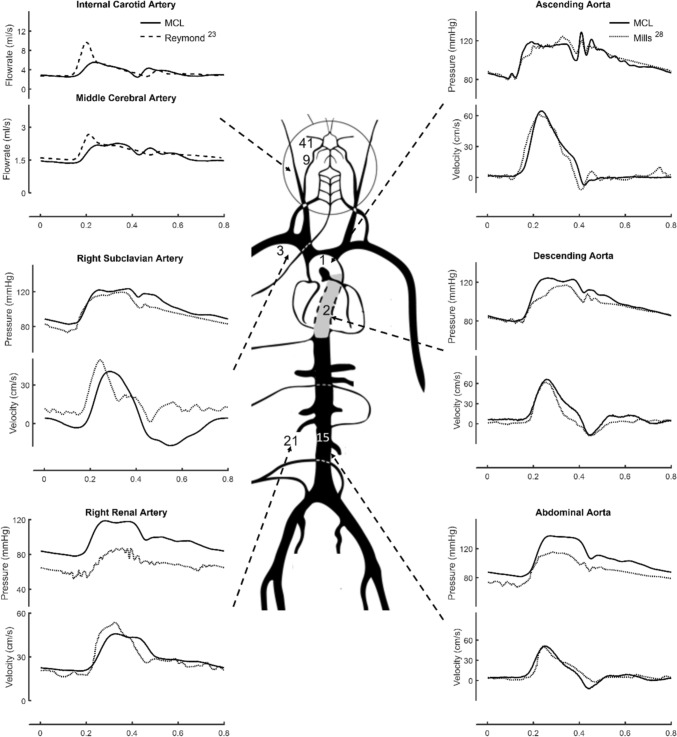
Results: Blood pressure and flow waveforms in the thoracic aorta, upper and lower limb arteries and abdominal organs (kidney, liver, spleen, etc.) were reproduced and validated against published data. Complex afferent and efferent flows in cerebral circulation and phasic coronary flow subjected to myocardial compression effect were replicated with precision. Pulse wave behavior was authentically generated and compared favorably to the published in-vivo and in-silico results.

Conclusion: This wave transport-preserving MCL is able to simulate pulsatile human circulatory hemodynamics with sufficient detail and accuracy. Complex cardiovascular device-intervened hemodynamics in large arteries and end organs can be systematically assessed using this new MCL, potentially contributing to a rapid and accurate in-vitro simulation to help advance device design and functional optimization.

Keywords: Circulatory assist device design; In-vitro hemodynamic testing; Mechanical circulatory support; Mock circulation loop; Pulsatile flow physiology.


Conflict of interest statement

Declarations. Conflict of Interest: Lu, PJ is the Founder and CEO of 3R Life Sciences and was the Professor of Aeronautics and Astronautics and Director of Heart Science Research Center of National Cheng Kung University, Taiwan during the initial design and testing period of the mock circulation loop. Tsui, S is the chief medical officer (honorary) of 3R Life Sciences. Chan, MY and Shen, TT have management/lead roles in 3R Life Sciences. Chang, JC has no conflicts of interest to disclose. Ethical Approval: Not applicable Consent to Participate: Not applicable Consent to Publish: Not applicable

Figures

Fig. 1
Fig. 1
Schematic of the anatomic-mimicking mock circulation loop. Names and station/segment numbers of constituent components are provided in Table. 1. Silicone artificial arteries (orange) and smaller Tygon tubing arteries (blue) form the tree-like arterial system. Lumped pulmonary and venous components are interconnected with the arterial system by larger Tygon tubing (blue). LV, left ventricle; RV, right ventricle; CoW, Circle of Willis; P1–P3, pinch valve resistors; R1–R31, terminal resistors; C1–C10, compliance chambers; S1–S5, settling chambers; MC1, MC2, myocardial compression chambers; Red dots, pressure measurement sites
Fig. 2
Fig. 2
Picture of the anatomy-mimicking mock circulation loop. The numbers marked on the parts are defined in Table 1
Fig. 3
Fig. 3
Cardiac simulator design. Ventricular contraction and relaxation are realized using a computer-controlled pneumatic driving system. A flexible blood sac is housed in a rigid-walled acrylic chamber in communication with a piston/cylinder actuator driven by a pneumatic regulator and air supply system. The inlet and outlet ports of the sac space (ventricle) are installed with two silicon tri-leaflet valves, respectively. A illustrated the schematic of the cardiac simulator design and the pneumatic ventricular actuator motion at systole and diastole. B depicts the control block diagram of pneumatic supply/regulation, driving flow and the commands sent from the control unit to actuate the ventricles. C shows the picture of the mechanical parts of the cardiac simulator
Fig. 4
Fig. 4
Schematic representation of the arterial tree replicas used on the present mock circulation loop. The segment numbers, names, and geometrical parameters are documented in Table 1. Spinal and intercostal circulations are simplified into lumped tubing parts as illustrated in the schematic. The lumped spinal/intercostal circulation parts are connected with the systemic arterial and venous subsystems to provide the afferent and efferent flows in the Circle of Willis as well as in the spinal circulation. AKA, artery of Adamkiewicz; ASA, anterior spinal artery
Fig. 5
Fig. 5
Triple-layered left coronary vasculature model (A) and the electric circuit analogue (B). Intramyocardial compression is imitated using collapsible silicon tubes housed in two air chambers (dash boxes), respectively. Driving pressures in the two air chambers are synchronized with the left ventricular driving system with regulated pressure drops to simulate the transmural muscular compression/relaxation effect. Resistances R13R18 (see Table 1) are parameters used for the tuning of coronary flow distributions in the triple-layered myocardium model
Fig. 6
Fig. 6
Flow chart showing the parameter tuning process of the present mock circulation loop
Fig. 7
Fig. 7
Comparison of the MCL-generated pressure and flowrate waveforms to those computational (Reymond et al. [23]) and clinically observed (Mills et al. [28]) results
Fig. 8
Fig. 8
Phasic coronary flow and wave characteristics analyzed using Wave Intensity Analysis (WIA); MCL (A) vs. animal experiment (B) results. Characteristic coronary waves labeled with numbers can be found in Davies [30]. Wave 2 is the dominant forward-traveling pushing wave resulting from early ventricular contraction. Wave 5 represent the dominant backward-traveling “suction” wave, which is the major coronary perfusion mechanism attributed to vasculature sudden expansion during early diastolic phase
Fig. 9
Fig. 9
Hemodynamic simulation of healthy, heart failure, and heart failure supported by rotary pump left ventricular assist device (LVAD). A shows the left ventricular pressure-volume loops of a heart with and without LVAD support. BE illustrate the pressures, flow and wave intensities corresponding to a healthy heart (B); a heart failure control (C); a heart failure supported by rotary pump with support level barely allowing aortic valve opening (D), and a heart failure having full rotary pump support with aortic valve closed
Fig. 10
Fig. 10
Simulation of heart failure (CO = 3.3 LPM, MAP = 90 mmHg, HR = 85 BPM) supported by intra-aortic balloon pump (IABP). A shows the pressure and flow waveforms at representative end organs and arteries under counterpulsatile IABP support (assist ratio 1:1, full augmentation). The time traces show IABP-standby and IABP-assisted waveforms separated by a line of start. The time-averaged pressure and flow enhancements are expressed as baseline/assisted (% increment). Units of flow and pressure are ml/min and mmHg, respectively. B illustrates the pressures and flows measured in the ascending aorta as well as in the coronary triple-layered (subepi-, subendo- and endo-myocardium layers) myocardial model. The time-varying resistance, resistor and compliance parameters are those adopted in Fig. 5.

References

    1. Cappon, Wu. T., T. Papaioannou, X. Du, P.-L. Hsu, and A. W. Khir. Mock circulatory loops used for testing cardiac assist devices: a review of computational and experimental models. Int. J. Artif. Organs. 44:793–806, 2021. - PubMed
    1. Hubrecht, R. C., and E. Carter. The 3Rs and humane experimental technique: implementing change. Animals. 9:754, 2019. 10.3390/ani9100754. - PMC - PubMed
    1. Timms, D., M. Hayne, K. McNeil, and A. Galbraith. A complete mock circulation loop for the evaluation of left, right, and biventricular assist devices. Artif. Organs. 29:564–572, 2005. - PubMed
    1. Timms, D. L., S. D. Gregory, N. A. Greatrex, M. J. Pearcy, J. F. Fraser, and U. Steinseifer. A compact mock circulation loop for the in vitro testing of cardiovascular devices. Artif. Organs. 35:384–391, 2010. - PubMed
    1. Koenig, S., G. Pantolos, K. Gillars, D. Ewert, K. Litwak, and S. Etoch. Hemodynamic and pressure-volume responses to continuous and pulsatile ventricular assist in an adult mock circulation. ASAIO J. 50:15–24, 2004. - PubMed

LinkOut - more resources