. 2025 Jun 1;328(6):E804-E821.
doi: 10.1152/ajpendo.00438.2024. Epub 2025 Apr 22.

FOXM1 cooperates with ERα to regulate functional β-cell mass

Affiliations

FOXM1 cooperates with ERα to regulate functional β-cell mass

Guihong Peng et al. Am J Physiol Endocrinol Metab. .

Abstract

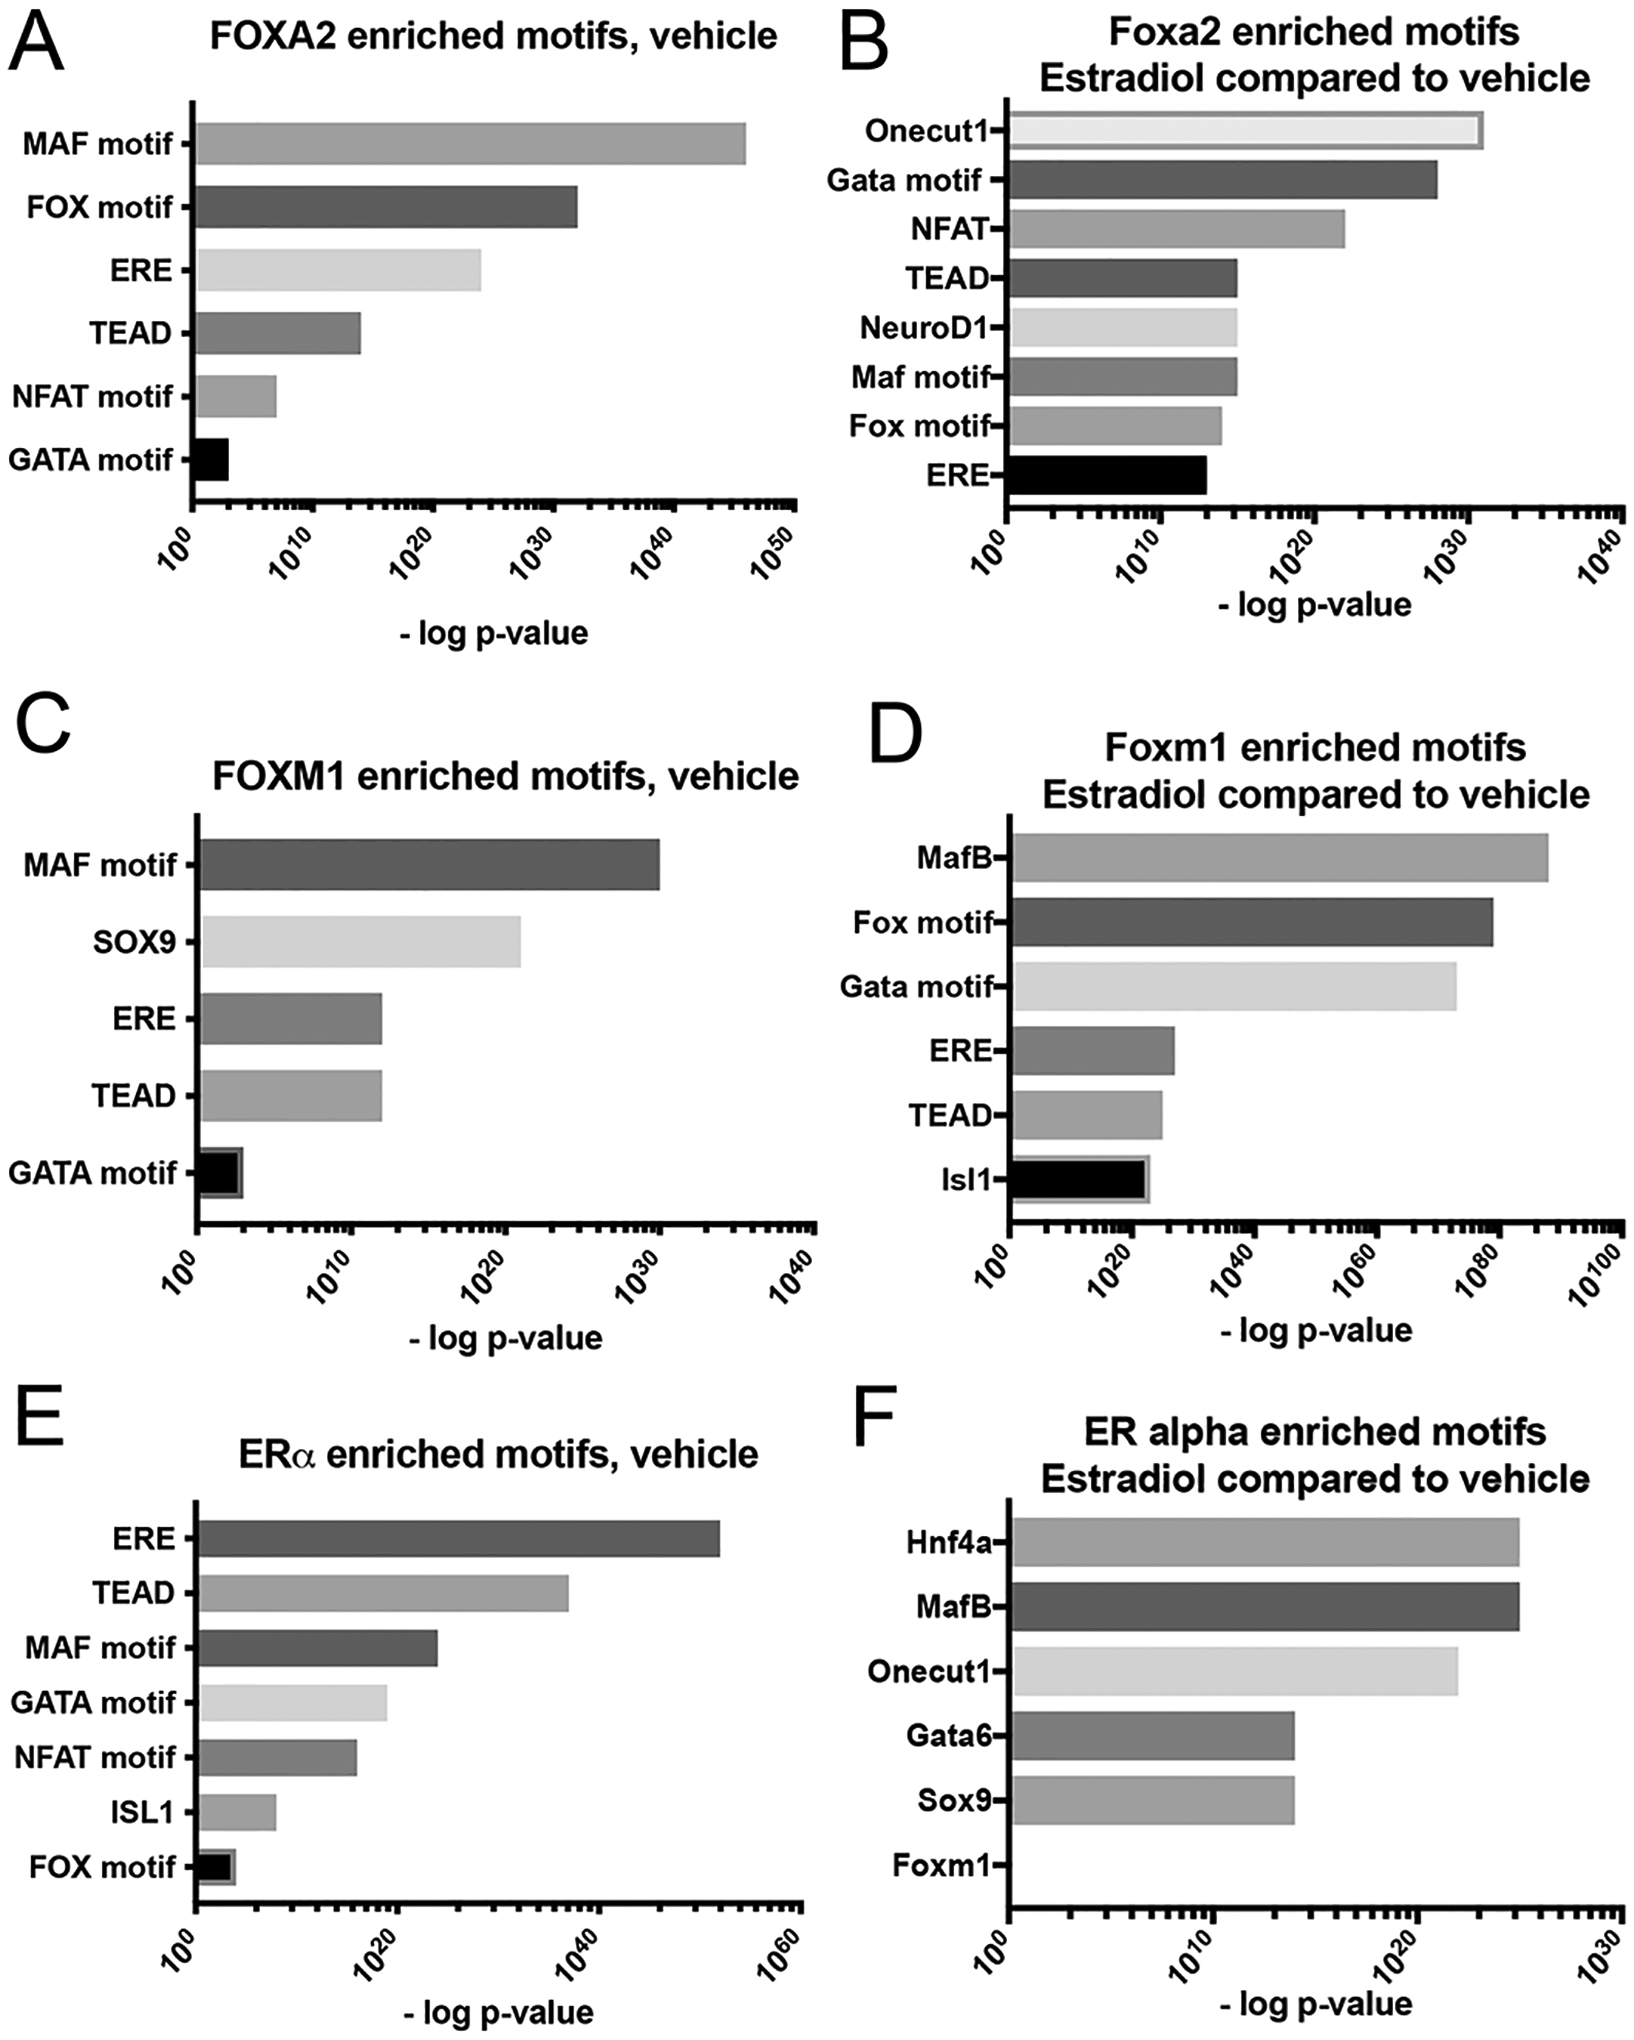
The transcription factor forkhead box (FOX)M1 regulates β-cell proliferation and insulin secretion. Our previous work demonstrates that expressing a constitutively active form of FOXM1 (FOXM1*) in β-cells increases β-cell function, proliferation, and mass in male mice. However, in contrast to what is observed in males, we demonstrate here that in female mice expression of FOXM1* in β-cells does not affect β-cell proliferation or glucose tolerance. Similarly, FOXM1* transduction of male but not female human islets enhances insulin secretion in response to elevated glucose. We therefore examined the mechanism behind this sexual dimorphism. Estrogen contributes to diabetes susceptibility differences between males and females, and estrogen receptor (ER)α is the primary mediator of β-cell estrogen signaling. Moreover, in breast cancer cells, ERα and FOXM1 work together to drive gene expression. We therefore examined whether FOXM1 and ERα functionally interact in β-cells. FOXM1* rescued elevated fasting glucose, glucose intolerance, and homeostatic model assessment of β-cell function (HOMA-B) in female mice with a β-cell-specific ERα deletion. Furthermore, in the presence of estrogen, the FOXM1 and ERα cistromes exhibit significant overlap in βTC6 β-cells. In addition, FOXM1 and ERα binding sites frequently occur in complex enhancers co-occupied by other islet transcription factors. These data indicate that FOXM1 and nuclear ERα cooperate to regulate β-cell function and suggest a general mechanism contributing to the lower incidence of diabetes observed in women.NEW & NOTEWORTHY Here we investigate why the effects of increasing FOXM1 activity in β-cells observed in male mice are not seen in female mice. ERα likely collaborates with FOXM1 and other transcription factors to enhance gene expression related to β-cell function. Higher estrogen levels in females may contribute to their increased insulin secretion and the more severe consequences of losing transcription factors like FOXM1 in males. Overall, these findings shed light on sex differences in diabetes susceptibility.

Keywords: Foxm1; beta cells; estrogen receptor.


Conflict of interest statement

Declaration of Interest

The authors declare no conflicts of interest.

Figures

Figure 1.
Figure 1.
β-cell mass, proliferation, and glucose tolerance in female β-FoxM1* mice. A-B) Representative images for insulin immunolabeling on two-month-old control (A) and β-FoxM1* (B) female pancreata. C-D) Representative images for insulin and Ki67 immunofluorescence on two-month-old control (C) or β-FoxM1* (D) pancreata. (E-F) Representative images for insulin immunolabeling on eight-month-old control (E) and β-FoxM1* (F) female pancreata. G-H) Representative images for insulin and Ki67 immunofluorescence on eight-month-old control (C) or β-FoxM1* (D) pancreata. I-J’) Representative images for insulin and Aurora Kinase on two-month-old control (I-I’) or β-FoxM1* (J-J’) pancreata K-L’) Representative images for insulin and Aurora Kinase on eight-month-old control (K-K’) or β-FoxM1* (L-L’) pancreata. Images denoted with a ‘ symbol are identical to their corresponding images labeled only with a letter but lack the insulin color layer for better visualization of Aurora Kinase. M) Quantification of β-cell mass in two-month-old β-FoxM1* and control female mice; n=8–10. N) Quantification of Ki67+ β-cells in two-month-old β-FoxM1* and control female mice; n=5–6. O) ) Quantification of Aurora Kinase+ β-cells in two-month-old β-FoxM1* and control female mice; n=3–4. P) Quantification of β-cell mass in eight-month-old β-FoxM1* and control female mice; n=4–6. Q) Quantification of Ki67+ β-cells in eight-month-old β-FoxM1* and control female mice; n=5–6. R) Quantification of Aurora Kinase+ β-cells in eight-month-old β-FoxM1* and control female mice; n=3–4. S-T) Glucose tolerance tests for (S) two-month-old (n=14–17) and (T) eight-month-old (n=10) β-FoxM1* and control mice. (U) Quantification of HA+ β cells, with HA acting as a surrogate for FOXM1* expression (n=3). For M-R, significance was evaluated by Student’s t-test. For S-T, significance was evaluated by Two-Way ANOVA with Sidak’s multiple testing correction.
Figure 2.
Figure 2.
Perifusion assays performed on human islets transduced by a virus encoding activated FoxM1 or GFP. A-B) Perifusion assays performed on male donor islets. Each donor’s islet preparation was split, and half were treated with the FoxM1 adenovirus and half with the GFP adenovirus. A) A representative perifusion trace from a single donor. B) Area-under-the-curve (AUC) for insulin secretion in response to high glucose and IBMX, normalized to each donor’s stimulation index. C-D) Perifusion assays performed on female donor islets. Each donor’s islet preparation was split, and half were treated with the FoxM1 adenovirus and half with the GFP adenovirus. C) A representative perifusion trace from a single donor. D) Area under the curve (AUC) for insulin secretion in response to high glucose and IBMX, normalized to high glucose stimulation index. Data from 4 distinct donors is shown. E-F) A small number of islets transduced with the FoxM1* adenovirus were set aside instead of being perifused. After suspension into a single-cell solution, they were cytospun before being immunolabeled with HA (a tag on the constitutively active FOXM1 protein) and insulin. A representative image for male (E) and female (F) are shown. G-H) A small number of islets transduced with the GFP adenovirus were set aside to examine for FOXM1* or GFP expression. They were suspended into a single-cell solution and cytospun before being immunolabeled with insulin or a GFP antibody. A representative image for male (G) and female (H) are shown. n=3–4; significance was evaluated by Student’s t-test; *p>0.05. All mice have one RIP-rtTA allele
Figure 3.
Figure 3.
Glucose homeostasis in female ERαΔβ mice with or without constitutively active FOXM1 in β cells. A) Fasting blood glucose; n=11–22, B) glucose tolerance tests; n=11–22, C) area under the curve for glucose tolerance tests in (B), and D) HOMA-B (n=6) in female RIP-rtTA control mice, β-FoxM1* mice, mice lacking ERα in β cells, and mice lacking ERα in β cells but expressing constitutively active FOXM1 β cells. n=11–22, *p<0.05; **p<0.01. Significance was analyzed by One-Way ANOVA with Tukey’s multiple correction test (A, C, D) or Two-Way ANOVA with Sidak’s multiple testing correction (B). All mice had at least one RIP-rtTA allele.
Figure 4.
Figure 4.
ChIP-seq for FOXM1, FOXA2, and ERα βTC6 cells treated with vehicle or 17β-estradiol. A) SRY genotyping for two male and two female wild-type mice and for five plates of βTC6 cells. Primers for Foxm1 were used as a control to assess DNA presence and quality. B) Venn diagram of FOXM1, FOXA2, and ERα binding-site overlap in the presence of 17β-estradiol. C) Categorization of binding site locations of FOXM1, FOXA2, and ERα in the presence of 17β-estradiol. D) Heatmaps for ERα-, FOXM1-, and FOXA2-bound sites around introns, exons, promoters, and distal intergenic sites. Only sites bound by ERα are shown for each transcription factor. For each column, binding is ordered by the number of reads for called ERα binding sites. Genrich was used for consensus peak calling (32). Differential binding analysis was performed using DESeq2 after merging peaks across treatment groups and determining counts within each peak by sample (33).
Figure 5.
Figure 5.
Known motif analysis for ChIP-seq in vehicle and 17β-estradiol-treated βTC6 cells. p-values for enriched motifs for transcription factor binding sites important for β-cell function in vehicle (A, C, E) or 17-β-estradiol-treated (B, D, F) βTC6 cells for FOXA2 (A-B), FOXM1 (C-D) and ERα (E-F) n=5. HOMER was used to assess significance of motifs.
Figure 6.
Figure 6.
UMAPs representing scRNAseq data from control and male β-FoxM1* islets. A) Clusters generated by Seurat. B) Origin of cells by genotype. C-L) Overlay of expression for cell-type-specific endocrine genes. C-F) β-cell identifiers, although Pdx1 is also expressed in δ cells. G-I) α-cell-specific genes. J-K) δ-cell markers. L) Pancreatic polypeptide hormone marking PP cells.
Figure 7.
Figure 7.
Violin plots demonstrating expression of the 10 most highly enriched genes in clusters comprising cell types of the pancreatic parenchyma. Cluster numbers correspond to clusters in Figure 1A. A-C) Genes enriched in each β-cell cluster. D-E) Genes enriched in each α-cell cluster. F) Genes enriched in the δ-cell cluster. G) Genes enriched in the PP-cell cluster. H) Genes enriched in the exocrine cluster. H) Genes enriched in the ductal cluster.
Figure 8.
Figure 8.
Single-cell RNAseq analysis of β cells in male β-FoxM1* or control mice. A) Violin plots for genes of interest that are upregulated by >1.25-fold and have an adjusted p-value <1.58E-10. Each violin plot represents results from one mouse. Genes displayed are in the top 20 upregulated genes and promote β-cell proliferation or β-cell function or protect against apoptosis. Genes are ordered by fold-change within each functional group, as described in the text. B) DAVID analysis of KEGG pathways for genes significantly differentially regulated by at least 15%. n=4–6.
Figure 9.
Figure 9.
Characterization of male β-FoxM1* islets. A) Insulin content of control and β-FoxM1* islets; n=9–14. B) Exogenous FoxM1 was detected by its HA-tag in male β-FoxM1* islets; the percent of cells within the islet that do not express insulin but do express FoxM1 is presented; n=3. Significance was evaluated by Student’s t-test.
Figure 10.
Figure 10.
Proposed model for how FoxM1 improves β-cell function in males or in females lacking ERα. A) In control females, ERα works in concert with other β-cell transcription factors to promote longer interactions between promoter and enhancers that result in higher transcriptional rates. In addition, it facilitates FOXM1 binding of nearby target sites. B) In females with ERα, the addition of activated FOXM1 does not improve FOXM1 binding or aid in prolonging enhancer-promoter interactions. C) In females lacking ERα in the β cell, ERβ may compensate somewhat for ERα. D) High levels of activated FOXM1 result in increased binding of FOXM1 in the setting of ERα absence, leading to more frequent or longer promoter-enhancer interactions. E) Males may have decreased levels of nuclear ERα due to lower serum estrogen, leading to less frequent or shorter enhancer-promoter interactions and decreased insulin secretion. F) In the setting of lower nuclear ERα levels, in males, high concentrations of activated FOXM1 result in increased binding of FOXM1, leading to more frequent or longer promoter-enhancer interactions. G) In males lacking β-cell ERα, lower serum estrogen may prevent ERβ from compensating for ERα, leading to less enhancer-promoter interaction than in females lacking β-cell ERα. H) High levels of activated FoxM1 could potentially increase promoter-enhancer interactions and improve insulin secretion in male mice lacking β-cell ERα.

Similar articles

References

    1. Saeedi P, Petersohn I, Salpea P, Malanda B, Karuranga S, Unwin N, Colagiuri S, Guariguata L, Motala AA, Ogurtsova K, Shaw JE, Bright D, Williams R, and Committee IDFDA. Global and regional diabetes prevalence estimates for 2019 and projections for 2030 and 2045: Results from the International Diabetes Federation Diabetes Atlas, 9(th) edition. Diabetes Res Clin Pract 157: 107843, 2019. - PubMed
    1. Kautzky-Willer A, Harreiter J, and Pacini G. Sex and Gender Differences in Risk, Pathophysiology and Complications of Type 2 Diabetes Mellitus. Endocr Rev 37: 278–316, 2016. - PMC - PubMed
    1. Kim JH, and Saxton AM. The TALLYHO mouse as a model of human type 2 diabetes. Methods Mol Biol 933: 75–87, 2012. - PubMed
    1. Zhang H, Zhang J, Pope CF, Crawford LA, Vasavada RC, Jagasia SM, and Gannon M. Gestational diabetes mellitus resulting from impaired beta-cell compensation in the absence of FoxM1, a novel downstream effector of placental lactogen. Diabetes 59: 143–152, 2010. - PMC - PubMed
    1. Golson ML, Misfeldt AA, Kopsombut UG, Petersen CP, and Gannon M. High Fat Diet Regulation of beta-Cell Proliferation and beta-Cell Mass. Open Endocrinol J 4: 2010. - PMC - PubMed

LinkOut - more resources