. 2025 Apr 2;37(4):koaf056.
doi: 10.1093/plcell/koaf056.

The protein kinases KIPK and KIPK-LIKE1 suppress overbending during negative hypocotyl gravitropic growth in Arabidopsis

Affiliations

The protein kinases KIPK and KIPK-LIKE1 suppress overbending during negative hypocotyl gravitropic growth in Arabidopsis

Yao Xiao et al. Plant Cell. .

Abstract

Plants use environmental cues to orient organ and plant growth, such as the direction of gravity or the direction, quantity, and quality of light. During the germination of Arabidopsis thaliana seeds in soil, negative gravitropism responses direct hypocotyl elongation such that the seedling can reach the light for photosynthesis and autotrophic growth. Similarly, hypocotyl elongation in the soil also requires mechanisms to efficiently grow around obstacles such as soil particles. Here, we identify KIPK (KINESIN-LIKE CALMODULIN-BINDING PROTEIN-INTERACTING PROTEIN KINASE) and the paralogous KIPKL1 (KIPK-LIKE1) as genetically redundant regulators of gravitropic hypocotyl bending. Moreover, we demonstrate that the homologous KIPKL2 (KIPK-LIKE2), which shows strong sequence similarity, must be functionally distinct. KIPK and KIPKL1 are polarly localized plasma membrane-associated proteins that can activate PIN-FORMED auxin transporters. KIPK and KIPKL1 are required to efficiently align hypocotyl growth with the gravity vector when seedling hypocotyls are grown on media plates or in soil, where contact with soil particles and obstacle avoidance impede direct negative gravitropic growth. Therefore, the polar KIPK and KIPKL1 kinases have different biological functions from the related AGC1 family kinases D6PK (D6 PROTEIN KINASE) or PAX (PROTEIN KINASE ASSOCIATED WITH BRX).


Conflict of interest statement

Conflict of interest statement. None declared.

Figures

Figure 1.
Figure 1.
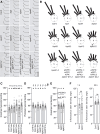
KIPK, KIPKL1, and KIPKL2 are polarly localized plasma membrane-associated protein kinases. A) and B) Representative confocal images of the epidermal cells of hypocotyls with their apical hooks A) and the root tips B) from 3-d-old dark-grown seedlings expressing the fluorescent protein-tagged KIPK/KIPKLs as specified in the figure panels. Scale bars = 50 µm A) and 10 µm B). C) Representative confocal images of root epidermal cells expressing YFP-KIPK and YFP-D6PK following a 30 min mock (DMSO), 25 µM BFA (Brefeldin A) or 30 µM PAO (phenylarsine oxide) treatment. Note that while YFP-D6PK dissociates fully from the plasma membrane after BFA treatment, YFP-KIPK dissociates only partially under these conditions. Scale bar = 20 µm.
Figure 2.
Figure 2.
KIPK and KIPKL1 phosphorylate PIN3 and activate PIN3-mediated auxin transport. A) Autoradiographs (AR) and Coomassie Brilliant Blue- (CBB-)stained gels (loading control) from in vitro phosphorylation experiments with recombinant purified MBP (maltose binding protein)-KIPK and MBP-KIPKLs (MBP-KIPK/L) and the GST (glutathione-S-transferase)-tagged cytoplasmic loop of PIN3 (GST-PIN3CL). B) Results from auxin transport experiments with PIN3 and protein kinases as specified. Shown is the IAA (indole-3-acetic acid) content after injection (grey bars) set to 1 in comparison to the IAA content after 15 min of efflux (white bars) expressed relative to the starting content. Shown are the individual data points from at least 9 individual oocytes, means and standard errors. Groups were compared by a Student's t-test: *P < 0.05; **P < 0.01; ***P < 0.001; ns, not significant.
Figure 3.
Figure 3.
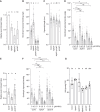
KIPK and KIPKL1 function redundantly in the regulation of negative hypocotyl gravitropism. A) Representative photographs of 3-d-old dark-grown seedlings of the specified genotypes 24 h after reorientation by 90°. Scale bar for all panels = 1 cm. B) Rose diagrams displaying gravitropic hypocotyl bending angles of seedlings from the experiment shown in A). Seedlings were grouped in 15° angle windows. n > 94 seedlings. Statistical significance was assessed using 1-way ANOVA, followed by Dunnett's T3 post hoc test for multiple comparisons. Different letters in the center of each diagram indicate significant differences between groups at P < 0.05. kipk01-2 is a second kipk01 double mutant combination with the kipkl1-2 allele whose phenotype is indistinguishable from kipk01-1 carrying the kipkl1-1 allele used throughout this study. C) to F) Graphs displaying the average and 95% confidence interval, as well as the individual data points from a negative hypocotyl gravitropism experiment C) as shown in A) and B), a hypocotyl phototropism experiment D), a root gravitropism experiment E) and a shoot negative gravitropism experiment using main inflorescence stems F). Since it is known that cotyledon positioning influences the degree of hypocotyl bending (Khurana et al. 1989), seedling responses were evaluated independently for seedlings with downward- (dw-) or upward- (uw-) positioned cotyledons C) or with forward- (fw-) or backward- (bw-) oriented cotyledons with regard to the gravity vector C) or the orientation of the blue light (BL) used for seedling illumination D). n > 41 seedlings or n ≥ 11 inflorescences. Results from a 1-way ANOVA analysis followed by Dunnett's T3 post hoc test for multiple comparisons or a Welch's t-test (P > 0.05, ns, not significant) are displayed on the top of each bar. Different letters indicate significant differences between groups at P < 0.05.
Figure 4.
Figure 4.
PIN-mediated auxin transport is a prerequisite for kipk01 hypergravitropic responses. A) and E) Graphs displaying the average and 95% confidence interval, as well as the individual results, of relative auxin transport rates in wild type (Col-0), kipk01, d6pk012, and pin347 mutants; n ≥ 3 independent experiments A) or kipk01 and abcb19 mutants n = 8 × 5 seedlings E). The individual results from the auxin transport measurements are shown in Supplementary Table S2. B), D), and F) Graphs displaying the average and 95% confidence interval, as well as the individual results, of gravitropic hypocotyl bending experiments with 3-d-old dark-grown wild type (Col-0), kipk01, pin347, pin347 kipk01 seedlings B), 3-d-old dark-grown wild type (Col-0), kipk01 and pin3-3 seedlings after treatments with NPA D), or with 3-d-old dark-grown wild type (Col-0), kipk01, abcb19 seedlings after treatments with NPA F). n > 37 seedlings. Results from a 1-way ANOVA analysis or Welch's t-tests are displayed. Groups were compared by a Welch's t-test D, F): *P < 0.05; **P < 0.01; ***P < 0.001; ****P < 0.0001; ns, not significant. One-way ANOVA, followed by Tukey's A) or Dunnett's T3 B, E) post hoc test for multiple comparisons. Different letters indicate significant differences between groups at P < 0.05. C) Graph displaying the average and 95% confidence interval, as well as the individual results, of hypocotyl lengths measured in 3-d-old dark-grown seedlings of the specified genotypes. Results from a 1-way ANOVA analysis followed by Dunnett's T3 post hoc test for multiple comparisons are displayed. Different letters indicate significant differences between groups at P < 0.05. n > 49 seedlings. G) Graph displaying the average and standard deviation of IAA quantifications in hypocotyls and cotyledons of pools of 4-d-old dark-grown seedlings of the specified genotypes (n = 3 pools). Statistical significance was assessed using 1-way ANOVA, followed by Dunnett's T3 post hoc test for multiple comparisons. Different letters indicate significant differences between groups at P < 0.05.
Figure 5.
Figure 5.
Endodermis-specific expression of KIPK suppresses the kipk01 hypergravitropic responses. A) Representative confocal microscopy images of hypocotyls of 3-d-old dark-grown seedlings expressing pSCR::eGFP-KIPK or pSCR::mCitrine-KIPK. E, endodermal cell file. The colored bar specifies signal intensities (arbitrary units) in the confocal microscopy images. Scale bars = 50 µm. B) Graph displaying the average and 95% confidence interval, as well as the individual results, of gravitropic hypocotyl bending experiments with 3-d-old dark-grown wild type (Col-0), kipk01 and kipk01 pSCR::eGFP-KIPK or kipk01 pSCR::mCitrine-KIPK seedlings. n > 31 seedlings. Statistical significance was assessed using 1-way ANOVA, followed by Dunnett's T3 post hoc test for multiple comparisons. Different letters indicate significant differences between groups at P < 0.05. C) Graph displaying the average and 95% confidence interval, as well as the individual results, of relative auxin transport rates in wild type (Col-0), kipk01 and kipk01 pSCR::eGFP-KIPK or kipk01 pSCR::mCitrine-KIPK seedlings. n = 20 × 5 seedlings. Statistical significance was assessed using 1-way ANOVA, followed by Dunnett's T3 post hoc test for multiple comparisons. Different letters indicate significant differences between groups at P < 0.05. D) Representative confocal images showing the distribution of mCitrine-KIPK before and after gravity stimulation for the times specified in the image in the central axial plane of the hypocotyl (upper images) and in the hypocotyl half cylinder (lower images; z stack). Scale bars = 100 µm.
Figure 6.
Figure 6.
Hypocotyl overbending in kipk01 coincides with the strong tissue level accumulation of auxin as monitored with DR5v2::GUS. A) and C) Representative photographs of 3-d-old dark-grown seedlings that had been exposed, for the times specified in the image, to a 90 °change in the gravitropic vector. Arrowheads mark the sites of auxin accumulation. Note the strong accumulation of auxin in the kipk01 cotyledons, as well as the long staining time (16 h) required for efficient staining in the kipk01 mutant. B) and D) Magnification from the images (squares) shown in A) and C), respectively. Scale bars for all images of one row = 1 mm.
Figure 7.
Figure 7.
KIPK and KIPKL1 are required for efficient soil penetration of seedling hypocotyls. A) Top view of wild-type (Col0) and kipk kipkl1 mutant seedlings sawn on the surface of soil or buried 1 cm below the soil. Scale bar = 1 cm. B) Graph displaying the average and 95% confidence interval, as well as the individual data points from experiments with seeds sown on the soil surface or buried in the soil. n = 5 × 40 seedlings. C) Photographs of seedlings germinated in the soil after emergence from the soil (out of soil) or without emergence from the soil (in soil). Scale bar = 1 cm. D) Graph displaying the average and 95% confidence interval, as well as the individual data points from straightness measurements of seedlings germinated in the soil after emergence from the soil (out) or without emergence from the soil (in), as determined by division of the lengths (L0) and the heights (L) of the seedling hypocotyls. n > 15 seedlings. Welch's t-test B, D). *P < 0.05; **P < 0.01; ns, not significant.

References

    1. Abas L, Benjamins R, Malenica N, Paciorek T, Wisniewska J, Moulinier-Anzola JC, Sieberer T, Friml J, Luschnig C. Intracellular trafficking and proteolysis of the Arabidopsis auxin-efflux facilitator PIN2 are involved in root gravitropism. Nat Cell Biol. 2006:8(3):249–256. 10.1038/ncb1369 - DOI - PubMed
    1. Abas L, Kolb M, Stadlmann J, Janacek DP, Lukic K, Schwechheimer C, Sazanov LA, Mach L, Friml J, Hammes UZ. Naphthylphthalamic acid associates with and inhibits PIN auxin transporters. Proc Natl Acad Sci U S A. 2021:118(1):e2020857118. 10.1073/pnas.2020857118 - DOI - PMC - PubMed
    1. Bailey MJ, Prehoda KE. Establishment of par-polarized cortical domains via phosphoregulated membrane motifs. Dev Cell. 2015:35(2):199–210. 10.1016/j.devcel.2015.09.016 - DOI - PMC - PubMed
    1. Barbosa IC, Shikata H, Zourelidou M, Heilmann M, Heilmann I, Schwechheimer C. Phospholipid composition and a polybasic motif determine D6 PROTEIN KINASE polar association with the plasma membrane and tropic responses. Development. 2016:143(24):4687–4700. 10.1242/dev.137117 - DOI - PubMed
    1. Barbosa IC, Zourelidou M, Willige BC, Weller B, Schwechheimer C. D6 PROTEIN KINASE activates auxin transport-dependent growth and PIN-FORMED phosphorylation at the plasma membrane. Dev Cell. 2014:29(6):674–685. 10.1016/j.devcel.2014.05.006 - DOI - PubMed

MeSH terms

LinkOut - more resources