. 2025 Apr 22;21(4):e1013065.
doi: 10.1371/journal.ppat.1013065. eCollection 2025 Apr.

Quantifying prevalence and risk factors of HIV multiple infection in Uganda from population-based deep-sequence data

Affiliations

Quantifying prevalence and risk factors of HIV multiple infection in Uganda from population-based deep-sequence data

Michael A Martin et al. PLoS Pathog. .

Abstract

People living with HIV can acquire secondary infections through a process called superinfection, giving rise to simultaneous infection with genetically distinct variants (multiple infection). Multiple infection provides the necessary conditions for the generation of novel recombinant forms of HIV and may worsen clinical outcomes and increase the rate of transmission to HIV seronegative sexual partners. To date, studies of HIV multiple infection have relied on insensitive bulk-sequencing, labor intensive single genome amplification protocols, or deep-sequencing of short genome regions. Here, we identified multiple infections in whole-genome or near whole-genome HIV RNA deep-sequence data generated from plasma samples of 2,029 people living with viremic HIV who participated in the population-based Rakai Community Cohort Study (RCCS). We estimated individual- and population-level probabilities of being multiply infected and assessed epidemiological risk factors using the novel Bayesian deep-phylogenetic multiple infection model (deep - phyloMI) which accounts for bias due to partial sequencing success and false-negative and false-positive detection rates. We estimated that between 2010 and 2020, 4.09% (95% highest posterior density interval (HPD) 2.95%-5.45%) of RCCS participants with viremic HIV multiple infection at time of sampling. Participants living in high-HIV prevalence communities along Lake Victoria were 2.33-fold (95% HPD 1.3-3.7) more likely to harbor a multiple infection compared to individuals in lower prevalence neighboring communities. This work introduces a high-throughput surveillance framework for identifying people with multiple HIV infections and quantifying population-level prevalence and risk factors of multiple infection for clinical and epidemiological investigations.


Conflict of interest statement

The authors have declared that no competing interests exist.

Figures
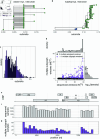
Fig 1
Fig 1. Empiric phylogenetic multiple infection signatures from 2,029 samples from people with viremic HIV in the Rakai Community Cohort Study, 2010-2020.
(A) Representative within-host phylogenetic tree lacking evidence of multiple phylogenetic subgraphs. (B) Representative within-host phylogenetic tree with two subgraphs as indicated by the green and blue shading of the tips. (C) Distribution of branch length distance between the MRCAs of the two subgraphs with the most sequencing reads in all genome windows windows with  ≥ 2 subgraphs from all samples. Bins are shaded according to the 95th and 50th percentile. Vertical dotted line indicates median value. Binwidth is calculated such that there are approximately 50 bins across the range of observed values. (D) Per-sample number of non-overlapping genome windows with sequence data versus the number of non-overlapping genome windows with multiple subgraphs. Samples with at least one window with multiple subgraphs are shown in purple. Points have been jittered along both the X and Y axes for visual clarity. Dotted line shows modeled prediction in the absence of false-positive or false-negative multiple subgraph windows. Marginal densities are shown at right and above the scatter-plot. (E) Schematic of the HIV genome based on the coordinates from HXB2 (Genbank: K03455.1). (F) Number of samples with sequence data in each of the 29 non-overlapping genome windows. (G) Number of samples with evidence of multiple subgraphs in each of the 29 non-overlapping genome-windows.
Fig 2
Fig 2. Verification of model accuracy for estimating multiple infection prevalence on simulated data with incomplete sequencing success and false-negative and false-positive observations.
(A) Number of windows with sequence data (x-axis) v. number of windows with multiple subgraphs (y-axis) for each simulated sample. Data from multiply infected samples is highlighted in red. Marginal distributions are shown at right and above. (B) Estimated posterior probability of multiple infection for each sample. Confidence bounds represent the 95% highest posterior density. Data for each sample is shaded as in (A). (C-H) Posterior distributions of the baseline sequencing success (α0, C), dependence of sequencing success on viral load (log 10 copies/mL) standardized to mean = 0 and standard deviation = 1. (α1, D), standard deviation of per-individual sequencing success random effect (σind, E), the multiple subgraph false-negative rate (λ, F), the multiple subgraph false-positive rate (ε, G), and the population prevalence of multiple infections (δ¯, H). Posterior distributions in (C-H) bins are shaded according to the 95% and 50% HPD. Histogram bin width is calculated such that there are approximately 50 bins over the range of the plotted values. True values are shown as vertical dotted lines.
Fig 3
Fig 3. Individual-level estimates and population-level characteristics of HIV multiple infection in people with viremic HIV in the Rakai Community Cohort Study, 2010-2020.
(A) Estimated posterior probability of multiple infection for each participant. Confidence bounds represent the 95% highest posterior density. Participants with at least one multiple subgraph window are shown in purple. (B) Number of participants with multiple infection as a function of the threshold used to dichotomize the probability of multiple infection. Central estimate uses the median estimated prevalence of multiple infections and shading uses 95% and 50% HPD. Horizontal dotted line plotted at the number of participants needed to match the estimated population prevalence of multiple infection. (C) Posterior distribution of the prevalence of multiple infections among viremic participants in the RCCS after accounting for sampling biases. Bins are shaded according to the 95% and 50% HPD. Histogram width is calculated such that there are approximately 50 bins over the range of the plotted values.
Fig 4
Fig 4. Risk factors of HIV multiple infection among people with viremic HIV in the Rakai Community cohort Study, 2010-2020.
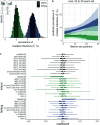
(A) Posterior distribution of the prevalence of multiple infections stratified by community type, accounting for sampling biases, estimated in a multivariate model (age, sex, and community type) with diffuse priors (n =  2,029). Bins are shaded according to the 95% and 50% highest posterior density (HPD). Histogram width is calculated such that there are approximately 50 bins over the range of plotted values. (B) Predicted risk of multiple infection among men aged 25 to 29 years old as a function of lifetime sex partners and community type estimated in a bivariate model with diffuse priors (n =  997). Median of the posterior distribution is plotted as the central estimate and shading represents the 95% and 50% HPD. Colors are as in (A). (C) Logistic coefficients for the association between putative risk factors and the probability of harboring a multiple infection estimated with Bayesian shrinkage priors (n =  1,970). Sex and bar/rest. work variable includes female sex and bar/restaurant worker and men who report having sex with female sex and bar/restaurant workers. Median of the posterior distribution is plotted as the central estimate, horizontal bars extend to the 95% and 50% HPD. Colors are as in (A).

References

    1. Redd AD, Quinn TC, Tobian AAR. Frequency and implications of HIV superinfection. Lancet Infect Dis 2013;13(7):622–8. doi: 10.1016/S1473-3099(13)70066-5 - DOI - PMC - PubMed
    1. Redd AD, Mullis CE, Serwadda D, Kong X, Martens C, Ricklefs SM, et al.. The rates of HIV superinfection and primary HIV incidence in a general population in Rakai, Uganda. J Infect Dis 2012;206(2):267–74. doi: 10.1093/infdis/jis325 - DOI - PMC - PubMed
    1. Wertheim JO, Oster AM, Murrell B, Saduvala N, Heneine W, Switzer WM, et al.. Maintenance and reappearance of extremely divergent intra-host HIV-1 variants. Virus Evol. 2018;4(2):vey030. doi: 10.1093/ve/vey030 - DOI - PMC - PubMed
    1. Fang G, Weiser B, Kuiken C, Philpott SM, Rowland-Jones S, Plummer F, et al.. Recombination following superinfection by HIV-1. AIDS 2004;18(2):153–9. doi: 10.1097/00002030-200401230-00003 - DOI - PubMed
    1. Streeck H, Li B, Poon AFY, Schneidewind A, Gladden AD, Power KA, et al.. Immune-driven recombination and loss of control after HIV superinfection. J Exp Med 2008;205(8):1789–96. doi: 10.1084/jem.20080281 - DOI - PMC - PubMed