. 2025 Jul;643(8071):539-550.
doi: 10.1038/s41586-025-09021-y. Epub 2025 Apr 22.

Custom CRISPR-Cas9 PAM variants via scalable engineering and machine learning

Affiliations

Custom CRISPR-Cas9 PAM variants via scalable engineering and machine learning

Rachel A Silverstein et al. Nature. 2025 Jul.

Abstract

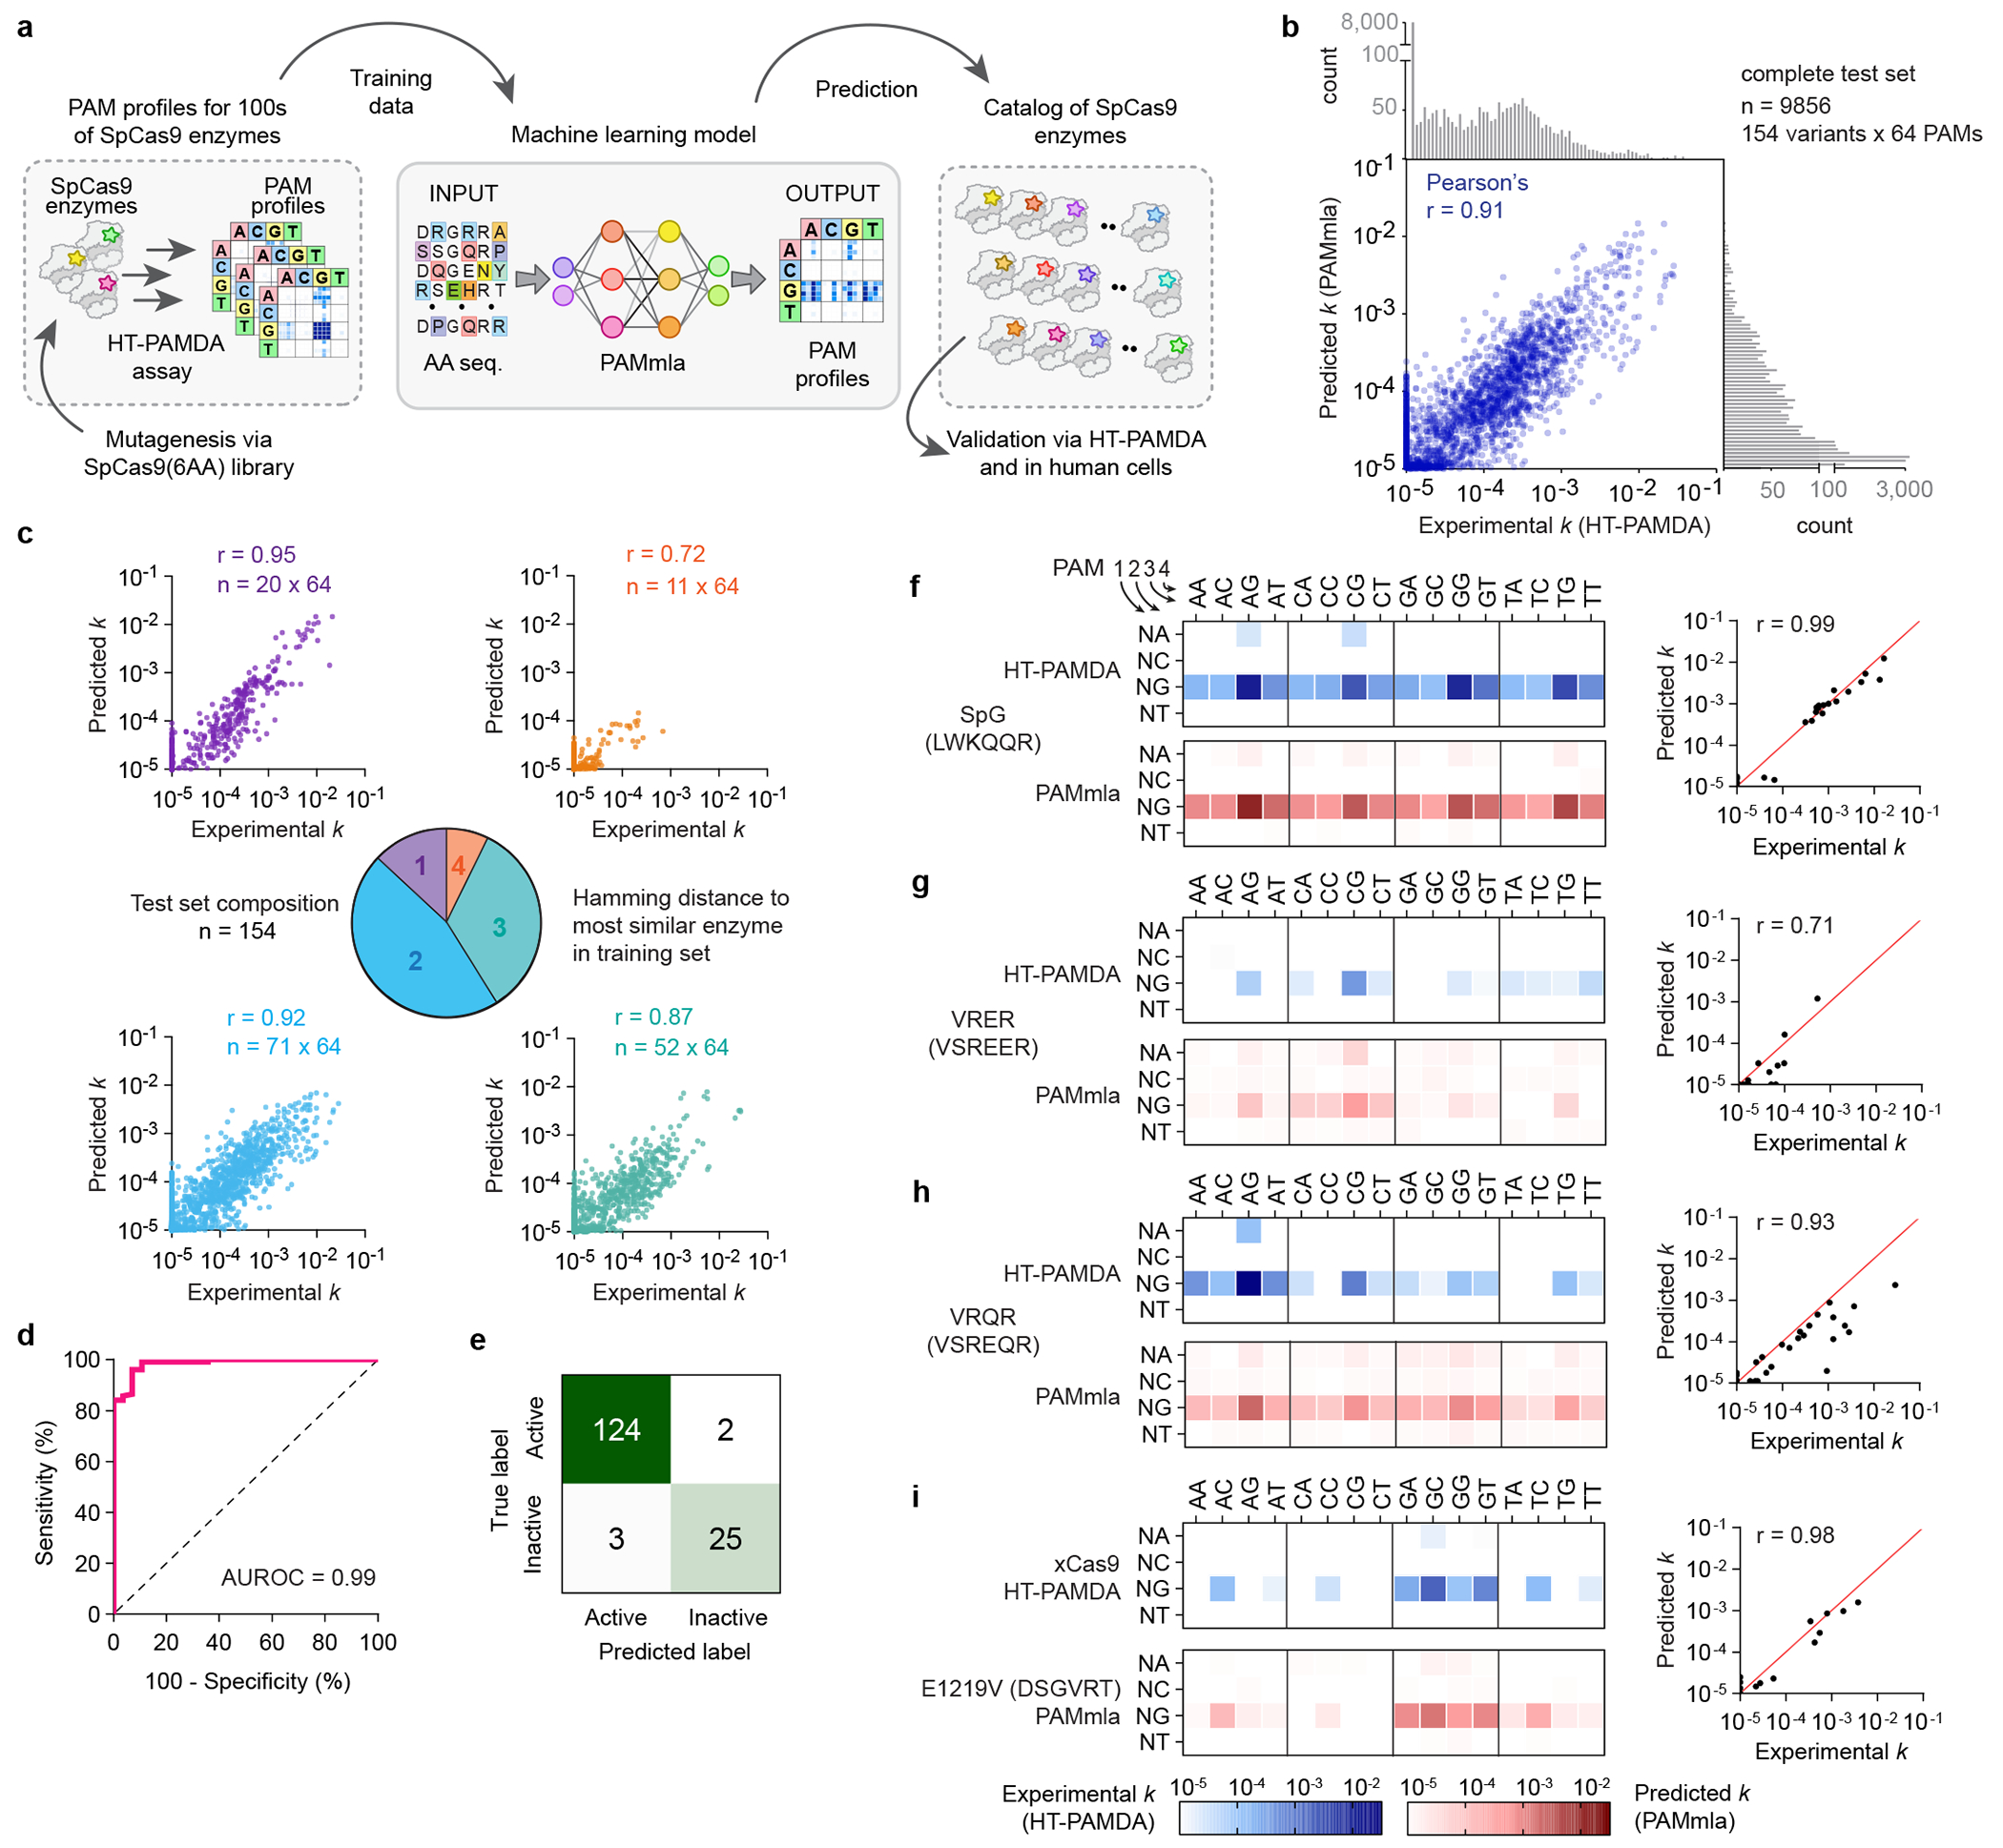
Engineering and characterizing proteins can be time-consuming and cumbersome, motivating the development of generalist CRISPR-Cas enzymes1-4 to enable diverse genome-editing applications. However, such enzymes have caveats such as an increased risk of off-target editing3,5,6. Here, to enable scalable reprogramming of Cas9 enzymes, we combined high-throughput protein engineering with machine learning to derive bespoke editors that are more uniquely suited to specific targets. Through structure-function-informed saturation mutagenesis and bacterial selections, we obtained nearly 1,000 engineered SpCas9 enzymes and characterized their protospacer-adjacent motif (PAM)7 requirements to train a neural network that relates amino acid sequence to PAM specificity. By utilizing the resulting PAM machine learning algorithm (PAMmla) to predict the PAMs of 64 million SpCas9 enzymes, we identified efficacious and specific enzymes that outperform evolution-based and engineered SpCas9 enzymes as nucleases and base editors in human cells while reducing off-targets. An in silico-directed evolution method enables user-directed Cas9 enzyme design, including for allele-selective targeting of the RHOP23H allele in human cells and mice. Together, PAMmla integrates machine learning and protein engineering to curate a catalogue of SpCas9 enzymes with distinct PAM requirements, motivating a shift away from generalist enzymes towards safe and efficient bespoke Cas9 variants.


Conflict of interest statement

Competing interests: R.A.S. and B.P.K. are inventors on a patent application filed by Mass General Brigham (MGB) that describes the development of PAMmla. B.P.K. and R.T.W. are inventors on additional patents or patent applications filed by MGB that describe genome engineering technologies related to the current study. S.Q.T. is an inventor on a patent application for GUIDE-seq, and is a member of the scientific advisory boards of Ensoma and Prime Medicine. L.P. has financial interests in Edilytics and SeQure Dx. Q.L. is a consultant for Entrada Therapeutics. B.P.K. is a consultant for EcoR1 capital, Novartis Venture Fund and Jumble Therapeutics, and is on the scientific advisory boards of Acrigen Biosciences, Life Edit Therapeutics and Prime Medicine. B.P.K. has a financial interest in Prime Medicine, Inc., a company developing therapeutic CRISPR–Cas technologies for gene editing. The interests of L.P. and B.P.K. were reviewed and are managed by MGH and MGB in accordance with their conflict-of-interest policies. The other authors declare no competing interests.

Figures

Extended Data Fig. 1 |
Extended Data Fig. 1 |. Targeting range and characterization of previous engineered SpCas9 PAM variant enzymes.
(a) Quantification of pathogenic and likely pathogenic single nucleotide variants (SNVs) from ClinVar that are theoretically revertible using ABE or CBE based on their proximity to an NGG PAM. SNVs were considered editable if a GG dinucleotide PAM was available at the appropriate distance upstream on the correct DNA strand, positioning the SNV anywhere between positions 5-9 of the spacer sequence (counting from the PAM-distal end of the spacer; typically called the ‘edit window’ of base editors). (b-d) Heatmap representations of the PAM profiles of SpCas9 enzymes determined using the HT-PAMDA assay,, for wild-type SpCas9 (panel b), for enzymes with altered PAM requirements (e.g. SpCas9-VRQR,, SpCas9-VRER, and xCas9; panel c), and for enzymes with relaxed PAM requirements (e.g. SpCas9-NG, SpG and SpRY, and SpCas9-NRRH/NRCH/NRTH); panel d). The log10 rate constants (k) are the mean of n = 2 replicate HT-PAMDA experiments performed using two distinct spacer sequences. Because the HT-PAMDA assay measures the relative depletion of substrates encoding various PAMs, it may underestimate rate constants for enzymes with highly relaxed PAM requirements such as SpRY and Cas9-NRRH.
Extended Data Fig. 2 |
Extended Data Fig. 2 |. Structure-informed saturation mutagenesis and bacterial positive selections for SpCas9 PAM variant enzymes.
(a) Structural representation of the PAM-interacting (PI) domain of SpCas9 showing amino acid residues interacting with a canonical NGG PAM (from PDB ID: 4UN3). (b) Schematic of the bacterial positive selection assay. A plasmid encoding the SpCas9(6AA) library (with randomized NNS codons at SpCas9 positions D1135, S1136, G1218, E1219, R1335, and T1337), a sgRNA expression cassette, and chloramphenicol resistance gene is transfected into an E. coli strain harboring a selection plasmid encoding an inducible toxic gene and the Cas9 target site (with protospacer adjacent to a non-canonical 4 nt PAM of interest). Selections were performed similar to previously described,,, where the ccdB gene (encoding a DNA gyrase toxin) on the selection plasmid is induced by plating on arabinose-containing media. Bacterial colonies survive the selection when they harbor a plasmid that expresses an SpCas9 enzyme variant capable of cleaving the selection plasmid (by recognizing a non-canonical PAM). (c) Summary of the SpCas9 enzymes that survived the bacterial positive selections using selection plasmids encoding each of the 16 NGNN PAMs. The heatmaps depict the percent of SpCas9 enzymes from each of the 16x selections that contain each possible amino acid substitution at each of the six SpCas9(6AA) library positions. Each heatmap is labeled based on the PAM utilized in that set of bacterial selections; the number of enzymes selected from each set of selections is indicated. The bottom panel represents a summary of the composition of amino acid residues at each of the six positions of the SpCas9(6AA) library.
Extended Data Fig. 3 |
Extended Data Fig. 3 |. Machine learning models to predict PAM profile from amino acid sequence.
a, Comparison of machine learning model architectures (linear regression, random forest, and neural network) and amino acid encodings (one-hot, one-hot plus all pairwise amino acid combinations, and Georgiev). The R2 value is shown between the experimentally determined k (via HT-PAMDA) and the predicted k (via each ML model) for an internal 5-fold cross-validation on the training set. Each validation set is sub-divided according to the minimum hamming distance (HD) of each variant to the nearest neighbor in the corresponding training set; thus, validation sets become more challenging as HD increases. b, Performance of the optimal PAM machine learning algorithm (PAMmla; comprised of a neural network with one hot encoding) on two additional 80%/20% random train-test splits. c, Proportion of test set SpCas9 enzymes that have a predominant preference for A, C, G, T in the 3rd position of the PAM, or are inactive (based on HT-PAMDA data). d, Comparison of test set ks broken down by nucleotide preference of each test variant at the 3rd position of the PAM (comparing ks experimentally determined by HT-PAMDA versus predicted by PAMmla). Nucleotide preference is defined as the 3rd position nucleotide of each enzyme variant’s most preferred PAM by HT-PAMDA. e, Proportion of test set SpCas9 enzymes that have a predominant preference for A, C, G, T in the 4th position of the PAM, or are inactive (based on HT-PAMDA data). f, Comparison of test set ks broken down by preference of each test set variant at the 4th position of the PAM (comparing ks experimentally determined by HT-PAMDA versus predicted by PAMmla). Nucleotide preference is defined as 4th position nucleotide of each enzyme variant’s most preferred PAM by HT-PAMDA. g, Effect of random over-sampling by most active PAM. The PAMmla model was trained with and without randomly over-sampling the training set to balance the number of enzyme variants with different PAM preferences. R2 values for the two models were compared on subsets of variants within the test set with different preferences at the 3rd and 4th positions of the PAM. Over-sampling improved performance particularly for under-represented PAM classes (see panels c and e). h, Pearson’s correlations between HT-PAMDA replicates performed with distinct spacer sequences for a set of 28 inactive versus 28 active enzymes within the test set. Dashed line = data median. True labels for active versus inactive enzymes were determined using a cutoff value for maximum k on any PAM of 10−4.3. Enzymes separated into active and inactive classes based on these criteria showed correlation between replicates only for active enzymes, indicating HT-PAMDA data for enzymes with maximum ks below this cutoff are likely due to non-reproducible noise in the HT-PAMDA assay. i, Correlation between ks experimentally determined by HT-PAMDA versus predicted by PAMmla for inactive variants (maximum HT-PAMDA k < 10−4.3) within the test set; PAMmla is not predictive for background noise in the HT-PAMDA determined PAM profiles of inactive enzymes. For all panels that utilize HT-PAMDA data, the log10 rate constants (k) are the mean of n = 2 replicate HT-PAMDA experiments using two distinct spacer sequences. For all scatterplots, each datapoint represents the rate constant activity of one enzyme variant against on one of 64 possible NNNN PAMs.
Extended Data Fig. 4 |
Extended Data Fig. 4 |. PAMmla feature importance for enzymes targeting different PAM classes.
SHapely Additive exPlanations (SHAP) analysis to investigate the impact of amino acid substitutions (i.e. PAMmla features) on model output for each of the 16 NGNN PAMs. SHAP values are shown for 200 enzymes sampled from the training set. Top 10 features with highest mean absolute SHAP values (greatest absolute impact on model output) are plotted for each PAM.
Extended Data Fig. 5 |
Extended Data Fig. 5 |. Homology models of PAMmla predicted PAM-altering mutations.
a, An E1219Y substitution may facilitate interaction with the amino group of bases in the 3rd position of the PAM. b, R1335Q permits major groove readout of both bases of a C-G pair in the 3rd position of the PAM. c, E1219C, R1335M, and T1337V substitutions form a hydrophobic pocket to promote van der Waals interactions with the methyl group of thymine in the 3rd position of the PAM. Representation of the protein surface is colored by lipophilicity potential. d, T1337R results in direct major groove readout of guanine in the 4th position of the PAM. e, T1337K facilitates major groove readout of oxygen group of bases in the 4th position the PAM. f, R1335L and T1337C substitutions form a hydrophobic pocket to promote recognition of thymine in the 4th position of the PAM. Protein surface is colored by lipophilicity potential. g, D1135L disrupts coordination with R1114, enabling improved flexibility of the R1114 side chain to contact the NTS backbone. WT SpCas9 is overlaid in grey. h, Substitution of G1218 to a positive residue establishes additional non-specific contacts with the NTS backbone. i, S1136W and D1135L result in a shift of the NTS and TS backbone towards the PAM-interacting domain, enabling novel base specific interactions in nearby regions. WT SpCas9 is overlaid in grey. For panels a-i, amino acid and PAM DNA base substitutions were modeled on the structure of SpG (PDB: 8U3Y) using Coot107, except for substitutions T1337R, T1337K, and T1337C which were modeled using SpCas9-VRER (PDB: 5FW3). Homology models were visualized using ChimeraX104.
Extended Data Fig. 6 |
Extended Data Fig. 6 |. Genome editing in human cells with PAMmla-predicted enzymes.
(a) PAMmla predicted ks for NGNN PAMs for enzymes targeting seven PAM categories. Hamming distances to the most similar enzyme in the training set are indicated in parentheses for each enzyme. (b) Nuclease-mediated genome editing efficiencies for each of the enzymes in panel a at endogenous target sites in HEK 293T cells harboring the PAMs they are predicted to target by PAMmla. Editing efficiencies were assessed by targeted amplicon sequencing and analyzed using CRISPResso2; data points are the mean of n = 3 biological replicates for enzymes from the training set (hamming distance = 0, shown with blue dots), enzymes predicted by PAMmla (shown in pink), SpG (gray), and wild-type (WT) SpCas9 (white); 3 to 10 genomic target sites were selected for characterization, where the black line represents median editing across all target sites for that enzyme; results at individual loci are shown in Supplementary Figs. 12a–g. (c,d) Base editing efficiencies for one PAMmla enzyme compared to SpG and SpRY, in the context of ABE8e and TadCBEd architectures (panels c and d, respectively). Base editing efficiencies were assessed by targeted amplicon sequencing for each enzyme at 3 endogenous target sites in HEK 293T cells; all edits at bases where any enzyme was observed to edit >5% efficiency are shown; Box minima, center and maxima represent data 25th, 50th, and 75th percentiles respectively; whiskers represent the range of the data. A-to-G and C-to-T base editing results at individual loci are shown in Supplementary Figs. 13a–g and Supplementary Figs. 14a–g, respectively.
Extended Data Fig. 7 |
Extended Data Fig. 7 |. Genome-wide off-target analysis of PAMmla predicted enzymes.
a, Quantification of GUIDE-seq2 double-stranded oligodeoxynucleotide (dsODN) tag integration at the on-target site, in nuclease-based experiments with SpG, SpRY, and PAMmla predicted enzymes targeting endogenous target sites in HEK 293T cells. SpCas9 variant enzymes are named based on their amino acids at each of the six positions in the SpCas9(6AA) library. dsODN integration efficiency was assessed by targeted amplicon sequencing and modified reads were analyzed using CRISPResso2; mean, standard deviation, and individual datapoints shown for n = 3 technical replicates. b, Venn diagram representations of the GUIDE-seq-2 detected off-target sites that are shared between or unique to PAMmla generated, SpG, and SpRY nucleases. c, Nucleotide composition of PAMs adjacent to off-target spacers detected in GUIDE-seq-2 experiments, not including the on-target reads. The y-axis represents the fraction of total off-target GUIDE-seq-2 reads containing each nucleotide at each position of the PAM. d, Quantification of GUIDE-seq-2 double-stranded oligodeoxynucleotide (dsODN) tag integration at the on-target site, in nuclease-based experiments with KWRQLC and SpG when using the CYBB T362I sgRNA but targeting the wild-type genome of HEK 293T cells. SpCas9 variant enzymes are named based on their amino acids at each of the six positions in the SpCas9(6AA) library. dsODN integration efficiency was assessed by targeted amplicon sequencing and modified reads were analyzed using CRISPResso2; mean, standard deviation, and individual datapoints are shown for n = 3 technical replicates. e, GUIDE-seq-2 genome-wide specificity outputs for KWRQLC and SpG nucleases using the CYBB T362I targeted sgRNA; note that HEK 293T cells harbor the wild-type copy of the CYBB gene and are therefore an imperfect match to the sgRNA. Mismatched positions in the spacers of the off-target sites are highlighted in color; GUIDE-seq read counts from consolidated unique molecular events for each variant are shown to the right of the sequence plots.
Extended Data Fig. 8 |
Extended Data Fig. 8 |. Design and validation of in silico directed evolution.
a, Schematic of in silico directed evolution (ISDE) pipeline to rapidly identify bespoke SpCas9 enzymes with user-specifiable PAM profiles. b-d, Effect of ISDE parameter values on the identification of optimized PAMmla predicted enzymes, including varying the number of starting mutations per round (m) (panel b), random variants generated per round (panel c) and number of additional evolution rounds performed once a plateau is reached before decreasing m (panel d). Proof-of-concept PAMmla-ISDE runs were performed to identify enzymes with maximal activity against NGAT, NGCC, or NGTA PAMs. Aside from the parameter being tested, ISDE was run with default parameters of 1,000 random starting sequences, m = 4 starting mutations per enzyme, s = 1,000 sampled enzymes per round, n = 10 top variants to keep per round, and p = 1 additional round of evolution after a plateau is reached. The number of true top 10 predicted enzymes, determined by exhaustive sorting of PAMmla predictions, recovered by ISDE are shown. Top bar graphs represent the number of replicates in which the most optimal enzyme was recovered.
Extended Data Fig. 9 |
Extended Data Fig. 9 |. Characterization of PAMmla-ISDE generated enzymes in human cells.
a, Nuclease-mediated genome editing at endogenous target sites in HEK 293T cells harboring different PAMs for wild-type (WT) SpCas9, SpG, and MRRWMR. b, Nuclease-mediated genome editing of the wild-type RHO or mutant RHO P23H alleles in a heterozygous RHO P23H HEK 293T cell line using wild-type SpCas9, SpG, and various PAMmla generated enzymes. For reads containing indels that span the P23H mutation (and therefore could not be identified as WT or mutant), counts were distributed between WT and mutant alleles with the same ratio as WT:mutant ratio observed for the identifiable edited reads. c, Nuclease-mediated genome editing of the RHO target site in wild-type HEK 293T cells using wild-type SpCas9, SpG, and various PAMmla generated enzymes. d, Unidentifiable sequencing reads that were either P23H or WT due to deletions spanning the mutation for data shown in heterozygous P23H HEK 293T cells from data in Fig. 5f; edited reads were distributed based on the balance in identifiable reads. e, Ratio of editing efficiencies observed on mutant (P23H) versus WT RHO alleles, for each editor tested in Fig. 5f. Editing efficiencies in panels a-c,e were assessed by targeted amplicon sequencing and modified reads were analyzed using CRISPResso2; mean, standard deviation, and individual datapoints shown for n = 3 independent biological replicates.
Extended Data Fig. 10 |
Extended Data Fig. 10 |. Specificity assessment of PAMmla-derived enzymes.
a, Quantification of GUIDE-seq2 double-stranded oligodeoxynucleotide (dsODN) tag integration at on-target sites in nuclease-based experiments with MRRWMR, SpG, and SpRY and sgRNAs targeting two different endogenous sites in HEK 293T cells. SpCas9 variant enzymes are named based on their amino acids at each of the six positions in the SpCas9(6AA) library. dsODN integration efficiency was assessed by targeted amplicon sequencing and modified reads were analyzed using CRISPResso2; mean, standard deviation, and individual datapoints are shown for n = 3 technical replicates. b, Venn diagram representations of the GUIDE-seq-2 detected off-target sites that are shared between or unique to MRRWMR, SpG, and SpRY nucleases using the two sgRNAs targeted to sites with NGTG PAMs (similar to the RHO P23H on-target site). c, Fraction of GUIDE-seq-2 reads attributed to on- and off-target sites for MRRWMR, SpG, and SpRY from experiments using the NGTG-2 or NGTG-3 sgRNAs. d, Quantification of GUIDE-seq-2 dsODN tag integration at the on-target site for experiments in the homozygous RHO P23H cell line, when using the RHO P23H sgRNA and SpCas9-MRRWMR and -KRHWMR, SpG, and SpRY expression plasmids. dsODN integration efficiency was assessed by targeted amplicon sequencing and modified reads were analyzed using CRISPResso2; mean, standard deviation, and individual datapoints are shown for n = 3 technical replicates. e, GUIDE-seq-2 genome-wide specificity outputs for SpCas9-MRRWMR and -KRHWMR, SpG, and SpRY nucleases using the RHO P23H targeted sgRNA in homozygous RHO P23H HEK 293T cells. Mismatched positions in the spacers of the off-target sites are highlighted in color; GUIDE-seq read counts from consolidated unique molecular events for each variant are shown to the right of the sequence plots. f, Venn diagram representation of the GUIDE-seq-2 detected off-target sites that are shared between or unique to SpCas9-MRRWMR and -KRHWMR, SpG, and SpRY nucleases using the RHO P23H sgRNA. g, Unidentifiable sequencing reads unattributable to either WT or P23H alleles due to deletions spanning the base harboring the mutation, for data from heterozygous RHO P23H mice shown in Figs. 5l, h, Ratio of in vivo editing efficiencies observed on mutant (P23H) versus WT RHO alleles, for each SpCas9 nuclease tested in Fig. 5l.
Extended Data Fig. 11 |
Extended Data Fig. 11 |. Analysis of factors contributing to MRRWMR and KRHWMR PAM preferences.
a, Structural prediction of an alternative conformation of the S1136R mutation leading to additional hydrogen bonding with T at position 3 of the PAM. b-e, SHapely Additive exPlanations (SHAP) values for PAMmla predictions for MRRWMR (panels b,c) and KRHWMR (panels d,e) interacting with NGTG (panels b,d) or NGGG PAMs (panels c,e) PAMs. Feature values are shown in gray (1: mutation is present, 0: mutation is absent). Red represents features with positive impact on predicted rate constant and blue represent features with negative impact on predicted rate constant.
Figure 1.
Figure 1.. Scalable characterization of hundreds of SpCas9 PAM variant enzymes.
(a) Schematic of target site recognition by an SpCas9-sgRNA complex. (b) Representation of the balance between targeting range and genome-wide specificity for engineered SpCas9 enzymes. (c) Schematic of the workflow to engineer SpCas9 enzymes via directed evolution. SpCas9 enzymes were obtained from a saturation mutagenesis library (harboring 6 amino acids with NNS codons; SpCas9(6AA)) either via bacterial positive selection (against 16 different substrates encoding NGNN PAMs) or by randomly picking unselected library members. SpCas9 enzymes were cloned into a mammalian expression plasmid, sequenced by a whole-ORF sequencing workflow, and subjected to the HT-PAMDA assay for comprehensive PAM characterization. (d) Heatmap representations of the PAM profiles of 634 SpCas9 enzymes obtained through the 16 selection experiments on NGNN PAMs, determined using HT-PAMDA (where the rate constant (k) on a PAM is a measure of targeting efficiency). PAM profiles were hierarchically clustered, with the 8 largest clusters highlighted and analyzed using sequence logos to display the amino acid composition of the cluster (right panel). PAM profiles for representative enzymes from each cluster are shown (left panel). HT-PAMDA datasets are the mean of n = 2 biological replicates using different target sites. (e) Fraction of PAM variant enzymes maximally active against the specific NGNN PAM that they were selected/designed against (rank = 1st) or where the PAM selected against was within the top 4 most active PAMs (rank = 2nd−4th), as determined by HT-PAMDA. Enzymes obtained from bacterial selections (left) and enzymes rationally designed based on most enriched amino acids from selections (right). (f) SpCas9 enzymes categorized by general PAM preference based on HT-PAMDA data (clustered as in panel d). Enzymes were labeled as inactive when no PAM had a k > 10−4.
Figure 2.
Figure 2.. Development of a machine learning model to predict SpCas9 PAM preference from amino acid sequence.
(a) Schematic a machine learning model that uses HT-PAMDA data from SpCas9 enzymes as the training data to then predict the PAM requirements for novel enzymes bearing combinations of amino acid at SpCas9(6AA) positions in the PI domain. (b) Correlation between the PAM machine learning algorithm (PAMmla) model predictions and experimentally determined rate constants (k) by HT-PAMDA, on a test set comprising 20% of the HT-PAMDA dataset held out from training. (c) Model performance via prediction of ks using PAMmla compared to HT-PAMDA determined ks, amongst different test sets by enzyme similarity to most similar sequence during training. (d) Receiver operating characteristic curve for binary classification of test set enzymes as active or inactive; enzymes are defined as inactive if the maximum HT-PAMDA k on any PAM is < 10−4.3. (e) Classification results on the test set when the threshold for identifying inactive enzymes is a maximum PAMmla predicted k < 10−4.3. (fi) Comparison of experimentally determined PAM profiles (via HT-PAMDA; top panels in blue) to predicted PAM profiles (via PAMmla; bottom panels in red) with correlation between experimental and predicted ks (right panels), for previously published enzymes, including SpG (panel f), VRER (panel g), VRQR, (panel h), and xCas9 (panel i). HT-PAMDA datasets are the mean of n = 2 biological replicates using different target sites.
Figure 3.
Figure 3.. Characterization of the PAM requirements of PAMmla-predicted enzymes.
(a) Schematic of predicting and validating PAMmla enzymes. (b) Experimentally determined PAM profiles for 253 active PAMmla predicted enzymes using HT-PAMDA (enzymes with no k > 10−4 not shown). HT-PAMDA profiles were clustered hierarchically and amino acid enrichment motifs for the 10 largest clusters are shown (sequence logos; right panels). Expanded HT-PAMDA profiles for representative enzymes from each cluster are shown and PAMmla predicted rate constants (ks) are compared to experimentally determined ks (left panels). HT-PAMDA datasets are the mean of n = 2 biological replicates using different target sites. PAMmla datasets are the mean of n = 3 predictions from separate training instances of the model. (c) Correlation between predicted and experimentally determined ks (via PAMmla and HT-PAMDA, respectively) for 281 PAMmla predicted enzymes from panel b. Each data point represents the k of an enzyme on one of 64 NNNN PAMs. (d) Distribution of amino acid hamming distances from the training set for enzymes from panel b. (e) Categorization of enzyme clusters from panel b; inactive enzymes had no k > 10−4 as determined by HT-PAMDA. (f) Distribution of SpCas9 enzymes based on their experimental ks, with enzymes from 3 categories: random from the SpCas9(6AA) library, a bacterial selection, or PAMmla to maximize activity on an NGNN PAM. The plotted k is the rate constant of the PAM used in bacterial selections or the query for maximized PAMmla predictions. (g) Fraction of PAM variant enzymes maximally active against the specific NGNN PAM that they were selected/predicted against (rank = 1st) or where the PAM selected against was within the top 4 most active PAMs, as determined by HT-PAMDA. The three categories of enzymes analyzed are PAMmla enzymes by maximizing activity on the 16 NGNN PAMs, PAMmla enzymes by sorting for selectivity for each of the 16 NGNN PAMs, and enzymes from bacterial selections on each of the 16 NGNN PAMs.
Figure 4.
Figure 4.. Genome editing and off-target analysis in human cells with PAMmla-predicted enzymes.
(a,b) Nuclease-mediated editing at endogenous sites in HEK 293T cells for each PAMmla derived enzyme (colored bars) compared to SpG and WT SpCas9, across sites harboring preferred PAMs (panel a) or NGG PAMs (panel b). Data points represent 3 independent biological replicates on 3-to-11 sites per PAM (Supplementary Fig. 12). (c,d) Summary of ABE8e and TadCBEd base editing efficiencies (panels c and d respectively) for all PAMmla enzymes from panel a on their preferred PAMs compared to SpG and SpRY (Supplementary Figs. 13, 14). Data points represent 3 independent biological replicates on 3 genomic sites per PAM. Bars = data mean. (e) Modification of endogenous sites in HEK 293T cells from GUIDE-seq-2 transfections containing the dsODN tag. Percent modification assessed by targeted sequencing; n = 3 technical replicates. (f) Number of GUIDE-seq-2 detected off-target sites for PAMmla enzymes, SpG, or SpRY, normalized to the number of off-target sites for SpRY. (g, h) Fraction of on- and off-target GUIDE-seq-2 reads with sgRNAs targeted to sites with few or many off-target sites (panels g and h, respectively). (i) Schematic of CYBB T326I mutation with the A8 sgRNA target site encoding an NGAT PAM shown, with intended edit position and bystander edit labeled in blue or red numbering, respectively. (j). Base editing efficiencies to correct the CYBB T326I mutation in a patient-derived B cell line. Base editing assessed by targeted sequencing; mean, SD, and individual data points shown for n = 3 independent biological replicates; all bases edited at >1% efficiency are shown. (k) Fraction of GUIDE-seq-2 reads attributed to on- and off-target sites for KWRQLC and SpG variants in GUIDE-seq-2 experiments using the CYBB T326I A8 sgRNA in HEK 293T cells (see Extended Data Figs. 7d,e).
Figure 5.
Figure 5.. In silico directed evolution of an allele-specific editor for the RHO P23H allele.
(a) Schematic of allele-specific editing of heterozygous RHO P23H alleles. (b,c) Predicted PAM profiles of enzymes resulting from PAMmla-enabled ISDE, using WT SpCas9 as a starting sequence and seeking to maximize activity on NGTG while minimizing on NGGG (k < 10−3.7 and k < 10−4 in panels b and c, respectively). Only the evolutionary trajectories leading to MRRWMR and KRHWMR are shown (Supplementary Fig. 16). (d,e) Fitness functions used to perform the in silico directed evolution experiments in panels b and c respectively; the top 10 enzymes from each round are in gray and the trajectory leading to MRRWMR or KRHWMR are in red. (f) Modification of the WT RHO and P23H alleles in a HEK 293T cell line harboring a 2:1 P23H:P23 allele ratio (see also Extended Data Fig. 9b). Editing assessed by targeted sequencing and CRISPResso2; mean and s.d. shown for n = 3 biological replicates; for reads containing indels that span the P23H mutation, edited counts were distributed using the ratio of WT to mutant as observed for the identifiable edited reads (Extended Data Fig. 9d). (g) Fraction of on- and off-target GUIDE-seq-2 reads for PAMmla predicted enzymes, SpG, and SpRY when paired with the RHO P23H sgRNA in homozygous P23H HEK 293T cells (Extended Data Figs. 10d,e). (h,i) Mutations shared between MRRWMR and KRHWMR modelled on the structure of VRER (PDB: 5FW3) interacting with NGTG or NGGG PAMs (panels h and i, respectively). Protein surface is colored by lipophilicity potential. Hydrogen bonds are represented by dashed lines and Van der Waals interactions are represented by green squiggles. (j, k) Force plots depicting SHAP values for MRRWMR activity on NGTG or NGGG PAMs (panels j and k, respectively). (l) In vivo modification of the RHO P23H or WT alleles in heterozygous humanized P0-P2 mouse pups via subretinal plasmid injection and electroporation. Editing assessed by targeted sequencing of BFP+ sorted retinal cells. Mean and s.d. shown for n = 7, 10, and 4 mice injected with KRHWMR, MRRWMR, or SpG respectively; unidentifiable reads containing indels that span the P23H mutation were discarded ( Extended Data Fig. 10g).

References

    1. Nishimasu H et al. Engineered CRISPR-Cas9 nuclease with expanded targeting space. Science (1979) (2018) doi: 10.1126/science.aas9129. - DOI - PMC - PubMed
    1. Hu JH et al. Evolved Cas9 variants with broad PAM compatibility and high DNA specificity. Nature (2018) doi: 10.1038/nature26155. - DOI - PMC - PubMed
    1. Walton RT, Christie KA, Whittaker MN & Kleinstiver BP Unconstrained genome targeting with near-PAMless engineered CRISPR-Cas9 variants. Science (1979) (2020) doi: 10.1126/science.aba8853. - DOI - PMC - PubMed
    1. Miller SM et al. Continuous evolution of SpCas9 variants compatible with non-G PAMs. Nat Biotechnol (2020) doi: 10.1038/s41587-020-0412-8. - DOI - PMC - PubMed
    1. Zhang W et al. In-depth assessment of the PAM compatibility and editing activities of Cas9 variants. Nucleic Acids Res 49, 8785–8795 (2021). - PMC - PubMed

METHODS SECTION-ONLY REFERENCES

    1. Kleinstiver BP, Fernandes AD, Gloor GB & Edgell DR A unified genetic, computational and experimental framework identifies functionally relevant residues of the homing endonuclease I-BmoI. Nucleic Acids Res 38, 2411 (2010). - PMC - PubMed
    1. Gibson DG et al. Enzymatic assembly of DNA molecules up to several hundred kilobases. Nature Methods 2009 6:5 6, 343–345 (2009). - PubMed
    1. Alves CRR et al. Optimization of base editors for the functional correction of SMN2 as a treatment for spinal muscular atrophy. Nature Biomedical Engineering 2023 1–14 (2023) doi: 10.1038/S41551-023-01132-Z. - DOI - PMC - PubMed
    1. Nelson JW et al. Engineered pegRNAs improve prime editing efficiency. Nat Biotechnol 40, 402 (2022). - PMC - PubMed
    1. Christie KA et al. Precise DNA cleavage using CRISPR-SpRYgests. Nature Biotechnology 2022 41:3 41, 409–416 (2022). - PMC - PubMed

Substances

LinkOut - more resources