

Quantification of baseline amyloid PET in individuals with subjective cognitive decline can identify risk of amyloid accumulation and cognitive worsening: the FACEHBI study
- PMID: 40263206
- PMCID: PMC12316768
- DOI: 10.1007/s00259-025-07270-7
Quantification of baseline amyloid PET in individuals with subjective cognitive decline can identify risk of amyloid accumulation and cognitive worsening: the FACEHBI study
Abstract
Purpose: Amyloid PET imaging is capable of measuring brain amyloid load in vivo. The aim of this study is to assess the relationship of the baseline amyloid with its accumulation over time and with cognition in individuals with subjective cognitive decline (SCD), giving a focus on those below Aβ positivity thresholds.
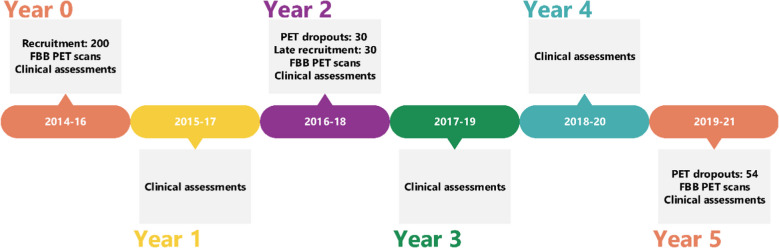
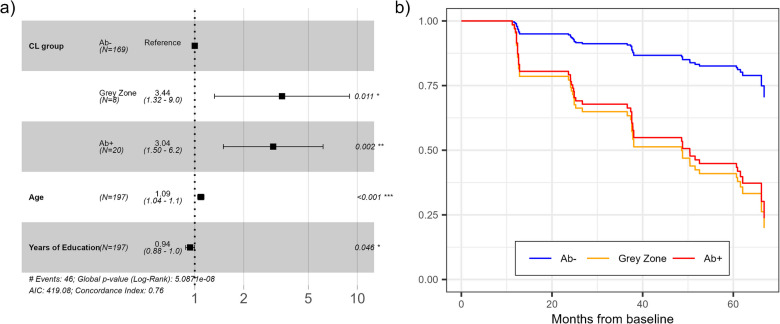
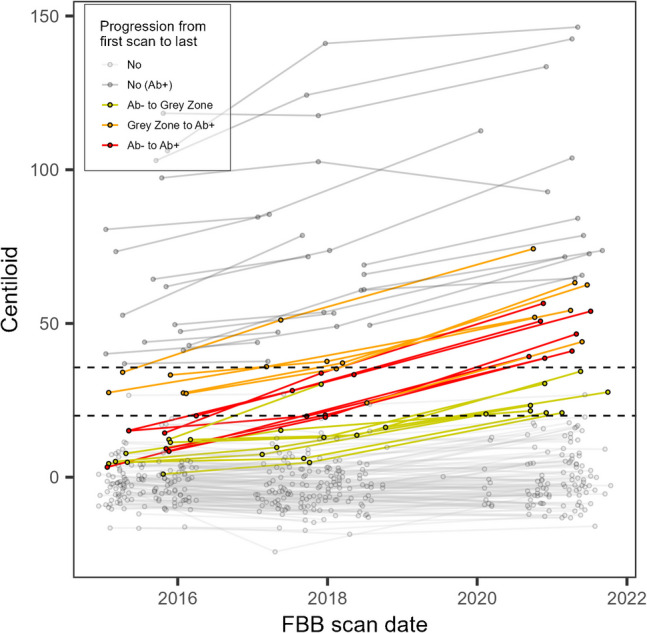
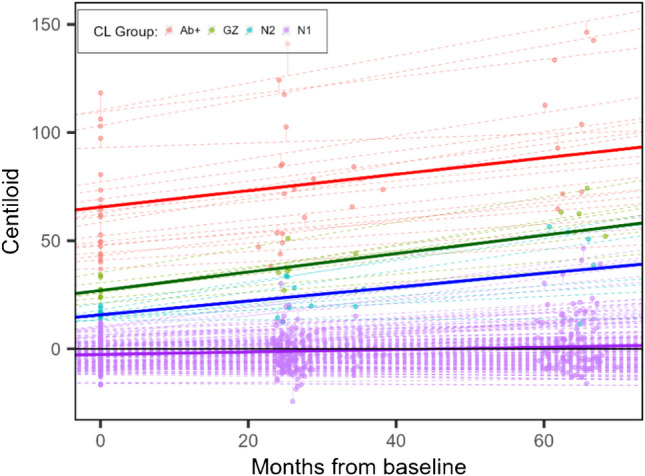
Methods: 118 of 197 individuals with SCD from the Fundació ACE Healthy Brain Initiative underwent three [18F]florbetaben scans and the remaining 79 underwent two scans in a 5-year span. Individuals were categorised based on baseline Centiloid values (CL) into amyloid positive (Aβ+; CL > 35.7), Grey Zone (GZ; 20 < CL ≤ 35.7), and amyloid negative (Aβ-; CL ≤ 20). Relationship between conversion to mild cognitive decline (MCI) and baseline amyloid levels was assessed. Then, to focus on sub-threshold individuals with amyloid accumulation, the Aβ- group was split into two groups (N1 (CL ≤ 13.5) and N2 (13.5 < CL ≤ 20)), Aβ accumulation was determined, and a parametric image analysis of the Aβ accumulators in the N1 group was performed.
Results: At baseline, 20 individuals were Aβ+, 8 GZ, 160 N1, and 9 N2. Higher Aβ load, older and less educated individuals presented increased risk of MCI-conversion. Longitudinally, 19% of N1 individuals were accumulators despite very low Aβ burden at baseline. Meanwhile, 89% of the N2 group accumulated Aβ as well as all GZ individuals (which had the highest rate of amyloid accumulation, 5.1 CL/year). In the parametric image analysis of N1 accumulators, a region within the precuneus was linked to increased Aβ over time.
Conclusion: Baseline amyloid levels differentiate individuals who accumulate amyloid over time and that are at risk for cognitive decline, including those at sub-threshold levels of Aβ. This can be valuable to identify pre-clinical AD in a SCD population.
Keywords: Alzheimer’s disease; Amyloid PET; FACEHBI; Florbetaben; Longitudinal study; Subjective Cognitive Decline.
© 2025. The Author(s).
Conflict of interest statement
Declarations. Ethics approval and consent to participate: A written consent was obtained from all participants prior to the enrolment in the study. The FACEHBI protocol received approval from the ethics committees of Hospital Clínic i Provincial in Barcelona, Spain (EudraCT number 2014–00079 - 38). The referral centre ethics committee approved the patient recruitment, and collection protocols were in accordance with ethical standards according to World Medical Association Declaration of Helsinki—Ethical Principles for Medical Research Involving Human Subjects. Consent to publish: Not applicable. Competing interests: AR is member of the scientific advisory board of Landsteiner Genmed and Grifols SA. AR has stocks of Landsteiner Genmed. MB has consulted for Araclon, Avid, Grifols, Lilly, Nutricia, Roche, Eisai and Servier. She received fees from lectures and funds for research from Araclon, Biogen, Grifols, Nutricia, Roche and Servier. She reports grants/research funding from Abbvie, Araclon, Biogen Research Limited, Bioiberica, Grifols, Lilly, S.A, Merck Sharp & Dohme, Kyowa Hakko Kirin, Laboratorios Servier, Nutricia SRL, Oryzon Genomics, Piramal Imaging Limited, Roche Pharma SA, and Schwabe Farma Iberica SLU, all outside the submitted work. She has not received personal compensations from these organizations. MM has consulted for F. Hoffmann-La Roche Ltd and is a member of the Scientific Advisory Board of Biomarkers of Araclon. GDK, NRV, EPM, NK, AS and SB are employees of Life Molecular Imaging GmbH. The rest of authors declare that they have no competing interests.
Figures


References
-
- García DV, Collij LE, Mastenbroek SE, Alves IL, Gispert JD, Ritchie CW, et al. First results of the AMYPAD Prognostic and Natural History Study: amyloid-PET Centiloid predicts cognitive functioning in a pre-dementia population. Alzheimers Dement. 2022;18:e067114.
-
- McDade E, Cummings JL, Dhadda S, Swanson CJ, Reyderman L, Kanekiyo M, et al. Lecanemab in patients with early Alzheimer’s disease: detailed results on biomarker, cognitive, and clinical effects from the randomized and open-label extension of the phase 2 proof-of-concept study. Alzheimers Res Ther. 2022;14:191. - PMC - PubMed
MeSH terms
Substances
Grants and funding
- 115952/Innovative Medicines Initiative
- 115975/Innovative Medicines Initiative
- 115985/Innovative Medicines Initiative
- PI13/02434/Spanish ISCIII, Acción Estratégica en Salud, integrated in the Spanish National R+D+I Plan and financed by ISCIII Subdirección General de Evaluación and the Fondo Europeo de Desarrollo Regional (FEDER "Una manera de hacer Europa")
- PI16/01861/Spanish ISCIII, Acción Estratégica en Salud, integrated in the Spanish National R+D+I Plan and financed by ISCIII Subdirección General de Evaluación and the Fondo Europeo de Desarrollo Regional (FEDER "Una manera de hacer Europa")
- PI19/01240/Spanish ISCIII, Acción Estratégica en Salud, integrated in the Spanish National R+D+I Plan and financed by ISCIII Subdirección General de Evaluación and the Fondo Europeo de Desarrollo Regional (FEDER "Una manera de hacer Europa")
- PI19/01301/Spanish ISCIII, Acción Estratégica en Salud, integrated in the Spanish National R+D+I Plan and financed by ISCIII Subdirección General de Evaluación and the Fondo Europeo de Desarrollo Regional (FEDER "Una manera de hacer Europa")
- PI22/00258/Spanish ISCIII, Acción Estratégica en Salud, integrated in the Spanish National R+D+I Plan and financed by ISCIII Subdirección General de Evaluación and the Fondo Europeo de Desarrollo Regional (FEDER "Una manera de hacer Europa")
- PI22/01403/Spanish ISCIII, Acción Estratégica en Salud, integrated in the Spanish National R+D+I Plan and financed by ISCIII Subdirección General de Evaluación and the Fondo Europeo de Desarrollo Regional (FEDER "Una manera de hacer Europa")
- PMP22/00022/European Union (NextGenerationEU)
- CB06/05/2004/CIBERNED (ISCIII)
- CB18/05/00010/CIBERNED (ISCIII)
- AC19/00097/Joint program for neurodegenerative diseases (JPND)
- PR067/21/Agency for Innovation and Entrepreneurship
- PI17/01474/ISCIII Subdirección General de Evaluación and the Fondo Europeo de Desarrollo Regional
- TARTAGLIA/Programa Misiones de I+D en Inteligencia Artificial de la Secretaría de Estado de Digitalización e Inteligencia Artificial (SEDIA) del Ministerio de Asuntos Económicos y Transformación Digital
- 796706/HORIZON EUROPE Marie Sklodowska-Curie Actions
- PI19/00335/Subdirección General de Evaluación and the Fondo Europeo de Desarrollo Regional
LinkOut - more resources
Full Text Sources
Medical
Miscellaneous
