. 2025 Apr 22;16(1):3767.
doi: 10.1038/s41467-025-58724-3.

UKB-MDRMF: a multi-disease risk and multimorbidity framework based on UK biobank data

Affiliations

UKB-MDRMF: a multi-disease risk and multimorbidity framework based on UK biobank data

Yukang Jiang et al. Nat Commun. .

Abstract

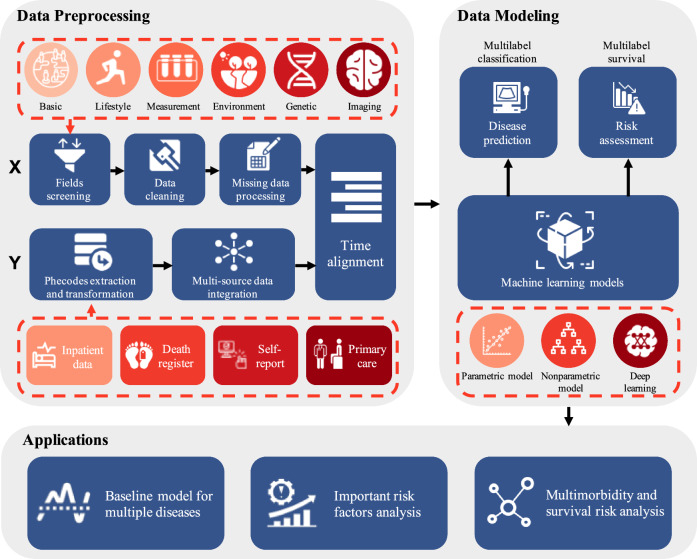
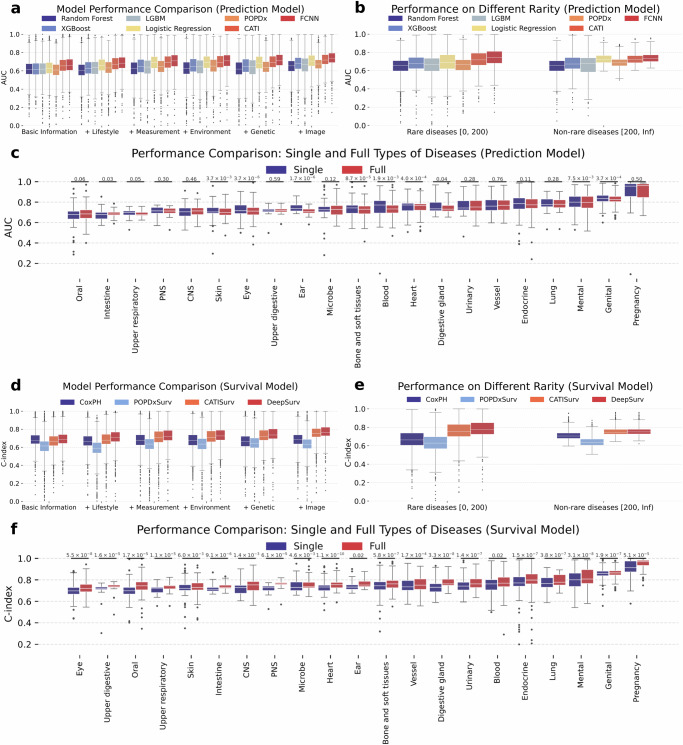
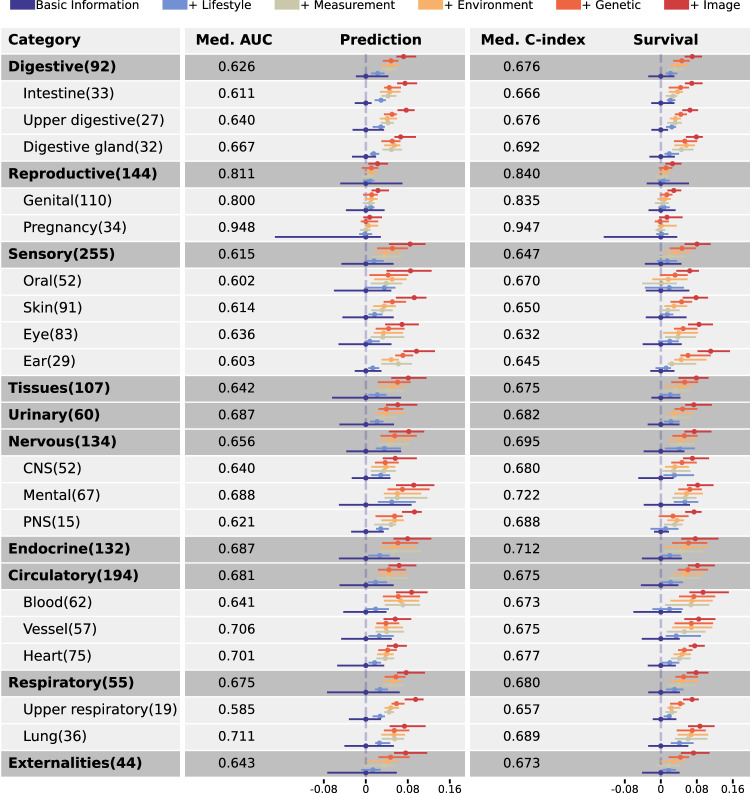
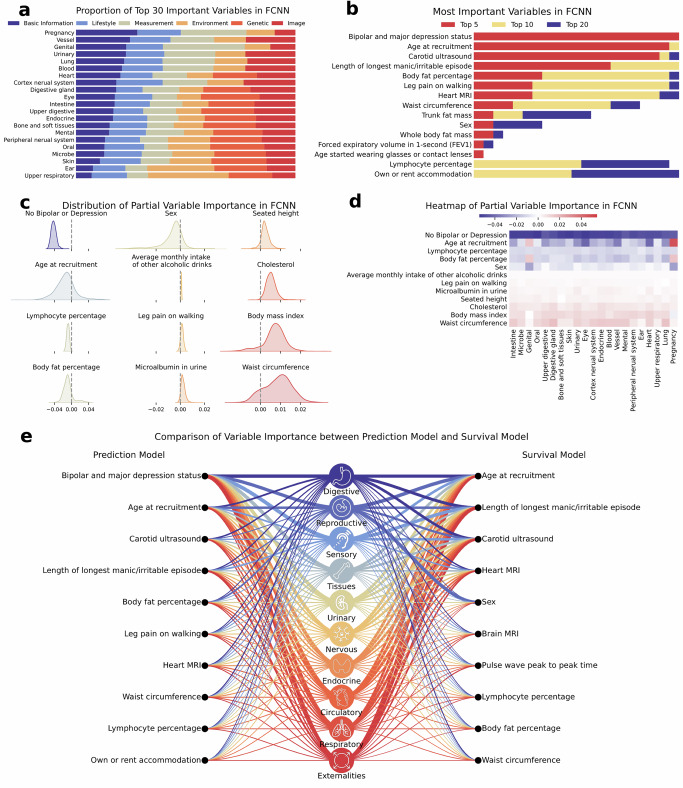
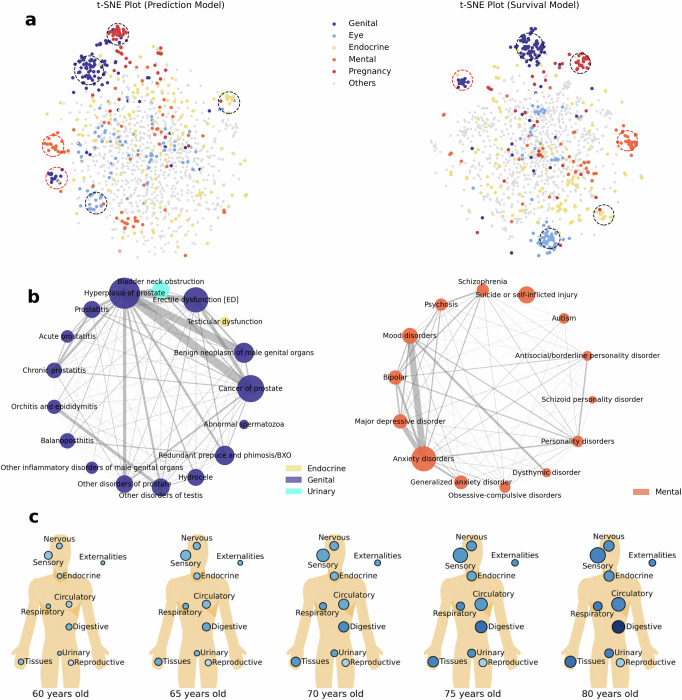
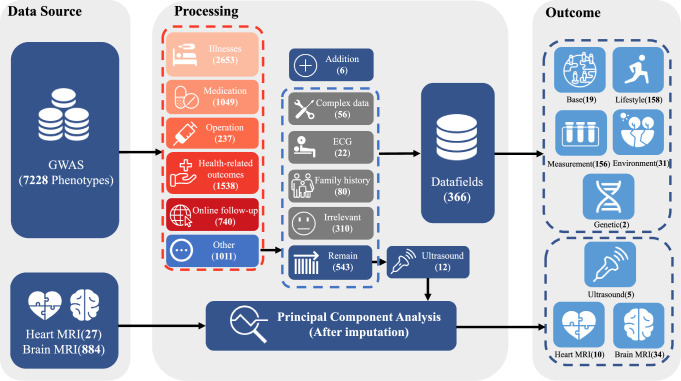
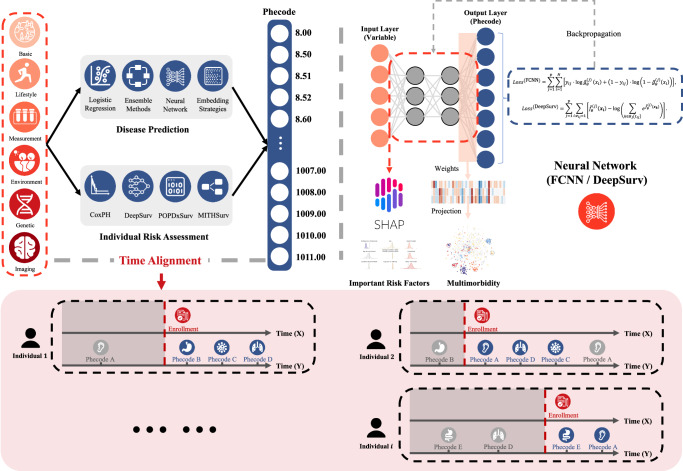
The rapid accumulation of biomedical cohort data presents opportunities to explore disease mechanisms, risk factors, and prognostic markers. However, current research often has a narrow focus, limiting the exploration of risk factors and inter-disease correlations. Additionally, fragmented processes and time constraints can hinder comprehensive analysis of the disease landscape. Our work addresses these challenges by integrating multimodal data from the UK Biobank, including basic, lifestyle, measurement, environment, genetic, and imaging data. We propose UKB-MDRMF, a comprehensive framework for predicting and assessing health risks across 1560 diseases. Unlike single disease models, UKB-MDRMF incorporates multimorbidity mechanisms, resulting in superior predictive accuracy, with all disease types showing improved performance in risk assessment. By jointly predicting and assessing multiple diseases, UKB-MDRMF uncovers shared and distinctive connections among risk factors and diseases, offering a broader perspective on health and multimorbidity mechanisms.


Conflict of interest statement

Competing interests: The authors declare no competing interests.

Figures

Fig. 1
Fig. 1. Construction pipeline of UKB-MDRMF.
This pipeline utilizes input data from the diverse UK Biobank data, including six categories: basic, lifestyle, measurement, environment, genetic, and imaging data. Following field selection, data cleaning, and missing data preprocessing, predictors are generated. Response variables are derived from inpatient, self-reported, and primary care data, initially standardized to ICD-10 codes before conversion to Phecodes. After the temporal alignment of independent and dependent variables, the data is used to construct the UKB-MDRMF framework, encompassing disease prediction and risk assessment models. These models facilitate diverse applications, including establishing baseline conditions for multiple diseases, analyzing significant risk factors, exploring multimorbidity, and assessing survival risks. Icons are provided by Icons8 (https://icons8.com).
Fig. 2
Fig. 2. Comparative performance of prediction and survival models across data categories, disease types, and prevalence levels.
Model performance in disease prediction (ac) and risk assessment (df) on the test set. a Performance of disease prediction models across different data categories. The prediction process initiates with basic information and gradually integrates additional categories. Seven machine learning and deep learning methods are compared. b The box plot illustrates model performance on the testing set with different numbers of positive patients in the training set (horizontal axis). c Disease prediction performance of the FCNN model using six data categories. Individual FCNNs were trained for each disease type and compared with FCNNs trained collectively for all Phecodes. The numerical values above each box plot represent the p values from two-sided Wilcoxon tests in each disease type, and no multiple comparison correction was applied. d Performance of risk assessment models (survival models). Testing set C-index comparisons across four models are used to assess risk assessment model performance, considering various input data categories. e Model performance on the testing set under different numbers of positive patients in the training set (horizontal axis). f Risk assessment performance of the DeepSurv model across 21 disease types. Similar to (c), the numerical values above each box plot represent the p values from two-sided Wilcoxon tests in each disease type, and no multiple comparison correction was applied. Box plots depict the median (central line), interquartile range (box), and whiskers extending to the minimum and maximum values, excluding outliers—defined as points beyond 1.5× the interquartile range from the first and third quartiles.
Fig. 3
Fig. 3. Model performance forest plot for different disease types with FCNN and DeepSurv.
The accuracy of disease prediction and survival modeling for each disease type gradually adding data categories. Med. AUC represents the median AUC of the best-performing disease prediction model, FCNN, for each disease type, using only basic information for prediction. Med. C-Index represents the median C-Index of the best-performing survival model, DeepSurv, for each disease type, using only basic information for survival modeling. All points in the plot represent the median values of the corresponding metrics, with the ends of the lines indicating the 25th and 75th percentiles of disease performance. The number of valid diseases in each category is recorded in parentheses following the disease type name. Additionally, models using image data show slight differences in the number of valid diseases due to variations in truncation times.
Fig. 4
Fig. 4. Assessing the importance of various disease risk factors using SHAP value from FCNN.
a Normalized proportion of the top 30 significant risk factors among six categories of independent variables for each of the 21 disease types. b Frequencies for the top 5, top 10, and top 20 important variables in each of the 21 types of diseases. c Distribution of variable importance for all Phecodes, with colors ranging from blue (negative effect) to red (positive effect). d Average importance values for each variable category and disease type, with blue indicating negative effects and red indicating positive effects. e Comparison of risk factor importance for disease prediction (left, from FCNN) and risk assessment (right, from DeepSurv). Diseases were aggregated into nine major types derived from the 21 disease types. Thicker lines indicate greater importance. Icons provided by Icons8 (https://icons8.com).
Fig. 5
Fig. 5. The multimorbidity mechanisms and age-related risk trends across multiple diseases.
a Two-dimensional projection of the disease prediction model’s multimorbidity mechanisms using t-SNE, where each point represents a predicted Phecode, and each color represents a major disease type. Closer points indicate similar disease patterns. The six circles in the figure delineate specific multimorbidity patterns. b Multimorbidity patterns of selected clusters' internal Phecodes. The size of each data point indicates the number of affected individuals, with larger points representing higher frequencies of occurrence. The thickness of the lines represents the frequency of comorbidity, with thicker lines indicating higher frequencies. c Risk profiles of nine major disease types estimated by the DeepSurv model across different age groups. The size of the circles indicates the cumulative number of affected individuals, with larger circles representing higher numbers. The shading represents the magnitude of risk, with darker shades indicating higher risk levels. Icons provided by Icons8 (https://icons8.com).
Fig. 6
Fig. 6. Data filtering process.
Based on 7228 phenotypes from the GWAS, we selected 542 phenotypes after excluding treatment diagnoses and some that are either irrelevant or difficult to measure. These 542 phenotypes are then grouped into six categories based on their nature. Additionally, principal component analysis (PCA) is performed on the structural data of Heart MRI, Brain MRI, and Ultrasound retaining the top 11, top 89, and top 5 principal components for each, respectively. Icons provided by Icons8 (https://icons8.com).
Fig. 7
Fig. 7. Data cleaning process.
For continuous and integer variables, we first apply special encoding techniques and then determine whether to handle them as continuous or discrete based on whether they have more than 20% identical values. For categorical variables, unordered encodings are transformed into binary variables. Ordered encodings undergo special encoding techniques before discrete handling. Icons provided by Icons8 (https://icons8.com).
Fig. 8
Fig. 8. Process of response variables.
Data originates from three sources: hospital inpatient, self-report, and primary care data. They were separately encoded and standardized as ICD-10 codes. After integration, the standardized codes were mapped to Phecodes to serve as the final response variables. Icons provided by Icons8 (https://icons8.com).
Fig. 9
Fig. 9. Pipeline for constructing UKB-MDRMF.
First, a time alignment process is applied to ensure that disease occurrences post-date the baseline data. The red-shaded section at the bottom illustrates the alignment process for different individuals, where the red dashed line represents the enrollment time. Features such as basic, lifestyle, and other characteristics are collected at the time of enrollment. Phecodes recorded before enrollment are marked in gray and treated as missing values during model training, ensuring they are not used for training purposes. After integrating Phecode data from multiple sources, only the earliest occurrence of the same Phecode post-enrollment is retained. Next, various multi-disease prediction and risk assessment models are applied for comprehensive evaluation. These models are trained separately using distinct loss functions. Finally, model interpretability analysis is performed, incorporating associations between different diseases and risk factors for integrated analysis. Variable importance results are derived from all model weights, while multimorbidity relationships are inferred from the embeddings in the penultimate network layer. Icons provided by Icons8 (https://icons8.com).

Similar articles

References

    1. Sudlow, C. et al. Uk biobank: an open access resource for identifying the causes of a wide range of complex diseases of middle and old age. PLoS Med.12, e1001779 (2015). - PMC - PubMed
    1. Tan, K. H. X. et al. Cohort profile: the Singapore multi-ethnic cohort (mec) study. Int. J. Epidemiol.47, 699–699j (2018). - PubMed
    1. Wan, E.Y.F. et al. Association of covid-19 with short-and long-term risk of cardiovascular disease and mortality: a prospective cohort in UK biobank. Cardiovasc. Res. 119, 1718–1727 (2023). - PubMed
    1. Cui, H. et al. scgpt: toward building a foundation model for single-cell multi-omics using generative AI. Nat. Methods21, 1470–1480 (2024) - PubMed
    1. Beaney, T. et al. Identifying multi-resolution clusters of diseases in ten million patients with multimorbidity in primary care in England. Commun. Med.4, 102 (2024). - PMC - PubMed

LinkOut - more resources