Model-based evaluation of the impact of a potential HIV cure on HIV transmission dynamics
- PMID: 40263248
- PMCID: PMC12015233
- DOI: 10.1038/s41467-025-58657-x
Model-based evaluation of the impact of a potential HIV cure on HIV transmission dynamics
Abstract
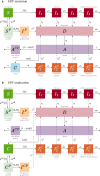
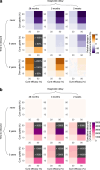
The development of an HIV cure is a global health priority, with the target product profile (TPP) for an HIV cure guiding research efforts. Using a mathematical model calibrated to data from men who have sex with men (MSM) in the Netherlands, we assessed whether an effective cure could help end the HIV epidemic. Following the TPP, we evaluated two scenarios: (i) HIV remission, where the virus is suppressed in an individual without ongoing antiretroviral therapy (ART) but may rebound, and (ii) HIV eradication, which aims to completely remove the virus from the individual. Here, we show that sustained HIV remission (without rebound) or HIV eradication could reduce new HIV infections compared to a scenario without a cure. In contrast, transient HIV remission with a risk of rebound could increase new infections if rebounds are not closely monitored, potentially undermining HIV control efforts. Our findings emphasize the critical role of cure characteristics in maximizing cure benefits for public health and highlight the need to align HIV cure research with public health objectives to end the HIV epidemic.
© 2025. The Author(s).
Conflict of interest statement
Competing interests: A.v.S. reports grants, paid to his institution, from the Dutch Ministry of Health, Welfare and Sport through the Centre for Infectious Disease Control of the National Institute for Public Health and the Environment, and from the European Centre for Disease Prevention and Control (ECDC). All other authors declare no competing interests.
Figures


Similar articles
-
Impact of increased diagnosis of early HIV infection and immediate antiretroviral treatment initiation on HIV transmission among men who have sex with men in the Netherlands.PLoS Comput Biol. 2025 Feb 27;21(2):e1012055. doi: 10.1371/journal.pcbi.1012055. eCollection 2025 Feb. PLoS Comput Biol. 2025. PMID: 40014624 Free PMC article.
-
Modeling of Antilatency Treatment in HIV: What Is the Optimal Duration of Antiretroviral Therapy-Free HIV Remission?J Virol. 2017 Nov 30;91(24):e01395-17. doi: 10.1128/JVI.01395-17. Print 2017 Dec 15. J Virol. 2017. PMID: 29021399 Free PMC article.
-
Population-level impact of an accelerated HIV response plan to reach the UNAIDS 90-90-90 target in Côte d'Ivoire: Insights from mathematical modeling.PLoS Med. 2017 Jun 15;14(6):e1002321. doi: 10.1371/journal.pmed.1002321. eCollection 2017 Jun. PLoS Med. 2017. PMID: 28617810 Free PMC article.
-
Harnessing CD8+ T Cells Under HIV Antiretroviral Therapy.Front Immunol. 2019 Feb 26;10:291. doi: 10.3389/fimmu.2019.00291. eCollection 2019. Front Immunol. 2019. PMID: 30863403 Free PMC article. Review.
-
Latency reversal and viral clearance to cure HIV-1.Science. 2016 Jul 22;353(6297):aaf6517. doi: 10.1126/science.aaf6517. Science. 2016. PMID: 27463679 Free PMC article. Review.
References
-
- The Joint United Nations Programme on HIV/AIDS (UNAIDS). Understanding fast-track accelerating action to end the AIDS epidemic by 2030 https://www.unaids.org/sites/default/files/media_asset/201506_JC2743_Und... (2015).
-
- van Sighem, A. et al. Monitoring Report 2023. Human Immunodeficiency Virus (HIV) infection in the Netherlands. Amsterdam: Stichting HIV monitoring https://www.hiv-monitoring.nl (2023).
MeSH terms
Substances
LinkOut - more resources
Full Text Sources
Medical

