. 2025 Apr 22;16(1):3771.
doi: 10.1038/s41467-025-58776-5.

Subnational variations in the quality of household survey data in sub-Saharan Africa

Affiliations

Subnational variations in the quality of household survey data in sub-Saharan Africa

Valentin Seidler et al. Nat Commun. .

Abstract

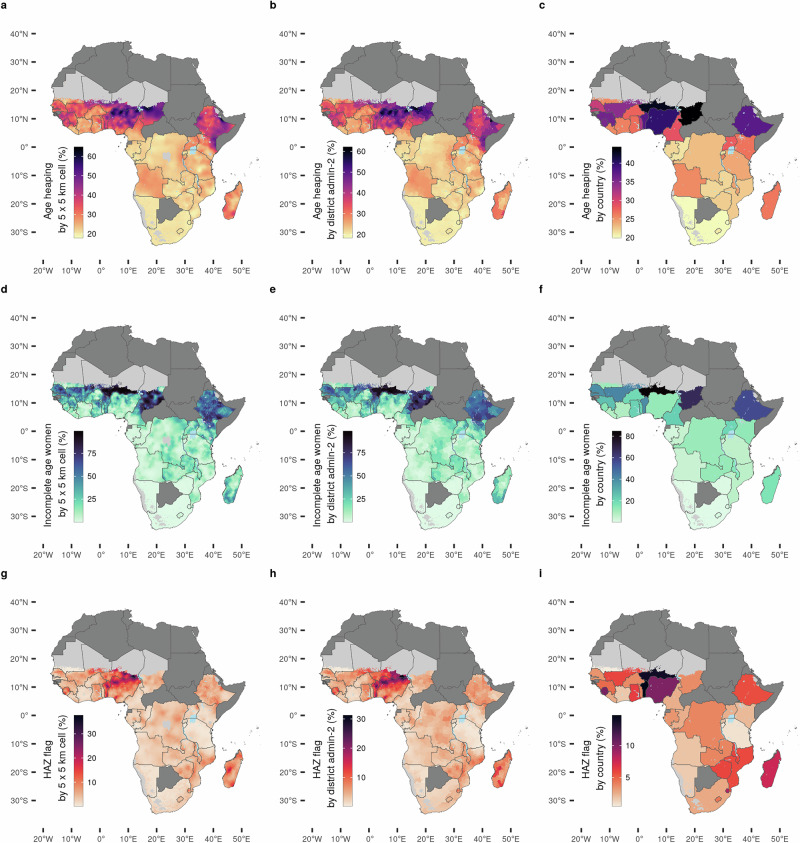
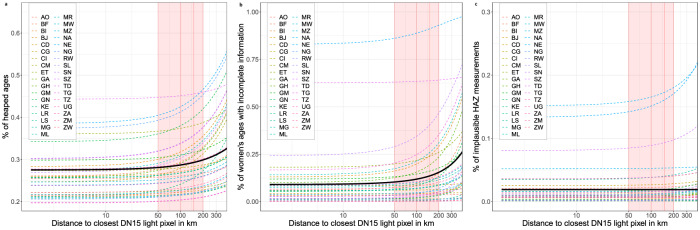
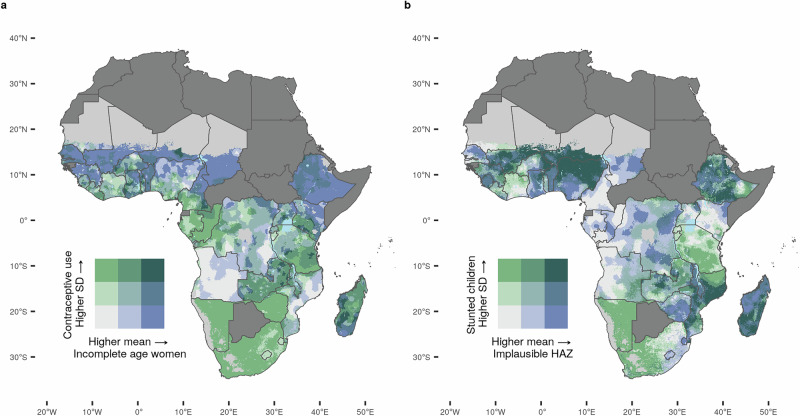
Nationally representative household surveys collect geocoded data that are vital to tackling health and other development challenges in sub-Saharan Africa. Scholars and practitioners generally assume uniform data quality but subnational variation of errors in household data has never been investigated at high spatial resolution. Here, we explore within-country variation in the quality of most recent household surveys for 35 African countries at 5 × 5 km resolution and district levels. Findings show a striking heterogeneity in the subnational distribution of sampling and measurement errors. Data quality degrades with greater distance from settlements, and missing data as well as imprecision of estimates add to quality problems that can result in vulnerable remote populations receiving less than optimal services and needed resources. Our easy-to-access geospatial estimates of survey data quality highlight the need to invest in better targeting of household surveys in remote areas.


Conflict of interest statement

Competing interests: The authors declare no competing interests.

Figures

Fig. 1
Fig. 1. Distribution of measurement errors in Demographic and Health Surveys (DHS) data 2009-2022.
ai Proportion of reported ages ending in 5 or 0 of all adults between 23 and 62 (’age heaping’) at (a) 5 × 5 km grid-cell level; (b) district level (admin-2); (c) country level. Share of interviewed women (15–49 years) with either the year or month of birth missing relative to all interviewed women (’incomplete age’) at (d) 5 × 5 km grid-cell level; (e) district level (admin-2); (f) country level. Missing or biologically implausible values for the attained heights of children (height-for-age z-scores, HAZ) according to World Health Organization (WHO) standards (’flagged HAZ’) at (g) 5 × 5 km grid-cell level; (h) district level (admin-2); (i) country level. Countries in dark grey are not in the sample. Grid cells with fewer than 10 people per 1 × 1 km and classified as barren or sparsely vegetated or grid cells with population data not available are colored light grey,–.
Fig. 2
Fig. 2. Predicted data quality by distance to closest Digital Number (DN) 15 nighttime light emitting source in km (logarithmic scale).
ac Predictions obtained from regional binomial logistic regressions on distance (in km) to closest DN 15 light pixel of (a) share of reported ages ending in 5 or 0 of all adults between 23 and 62 (’age heaping’), (b) share of interviewed women (15–49 years) with either the year or month of birth reported missing (’incomplete age’), and (c) implausible or missing values for the attained height-for-age z-scores (HAZ) of children under five according to World Health Organization (WHO) standards (’flagged HAZ’). All models include country fixed effects.
Fig. 3
Fig. 3. Distribution of measurement errors and uncertainty of predicted estimates of public health indicators in Demographic and Health Surveys (DHS) data 2009–2022.
a, b standard deviations of predicted estimates of contraceptive use of sexually active women (in green) and incomplete age values (in blue) at 5 × 5 km grid-cell level (a), standard deviations of predicted estimates of stunting prevalence among children (in green) and flagged height-for-age (HAZ) values (in blue) at 5 × 5 km grid-cell level (b). Countries in dark grey were not in the sample. Grid cells with fewer than 10 people per 1 × 1 km and classified as barren or sparsely vegetated or grid cells with population data not available are colored light grey,–.

Similar articles

Cited by

References

    1. Devarajan, S. Africa’s Statistical Tragedy. Rev. Income Wealth59, S9–S15 (2013).
    1. Jerven, M. Poor Numbers: How We Are Misled by African Development Statistics and What to Do about It. (Cornell University Press, 2013).
    1. Pelletier, F. Census counts, undercounts and population estimates: The importance of data quality evaluation. Population Division, United Nations Department of Economic and Social Affairs. Technical Paper No2, (2020).
    1. Randall, S. & Coast, E. The quality of demographic data on older Africans. Demographic Res.34, 143–174 (2016).
    1. Chan, M. et al. Meeting the Demand for Results and Accountability: A Call for Action on Health Data from Eight Global Health Agencies. PLoS Med.7, e1000223 (2010). - PMC - PubMed

LinkOut - more resources