. 2025 Apr 22;16(1):3781.
doi: 10.1038/s41467-025-59278-0.

Injectable extracellular vesicle hydrogels with tunable viscoelasticity for depot vaccine

Affiliations

Injectable extracellular vesicle hydrogels with tunable viscoelasticity for depot vaccine

Rimsha Bhatta et al. Nat Commun. .

Abstract

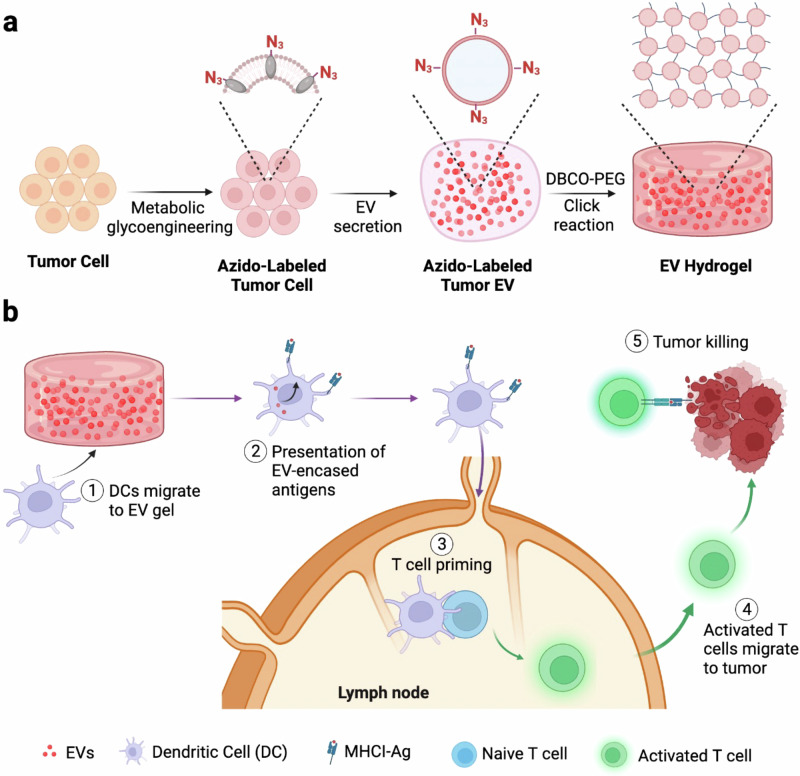
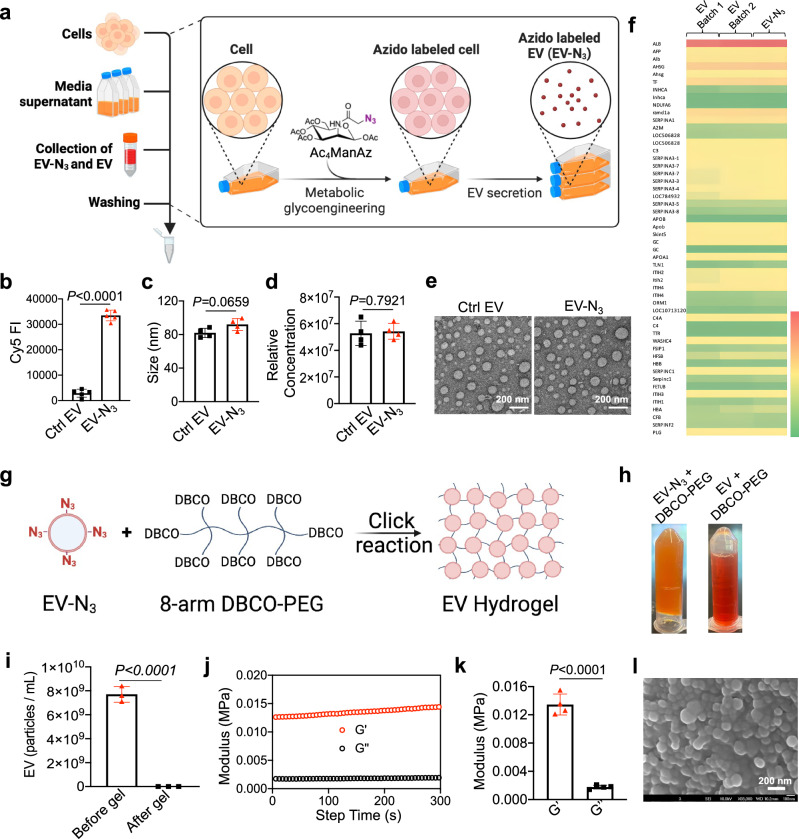
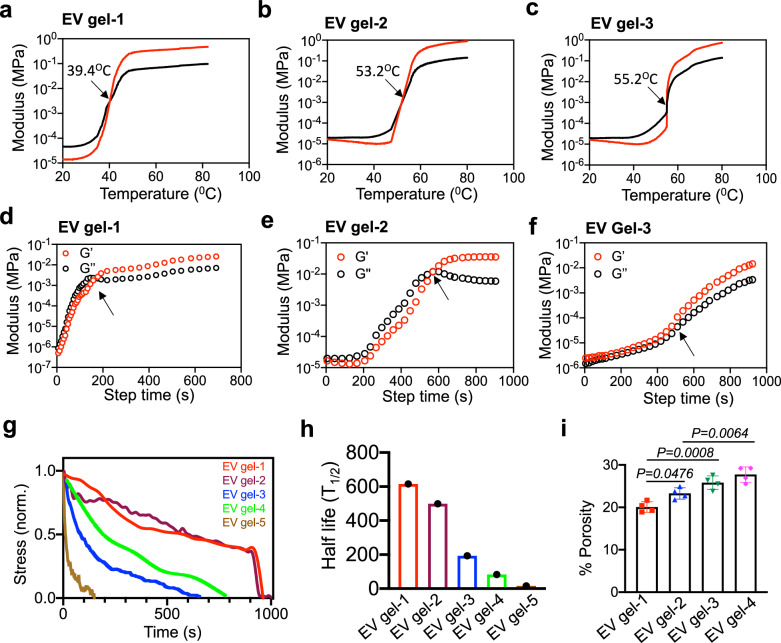
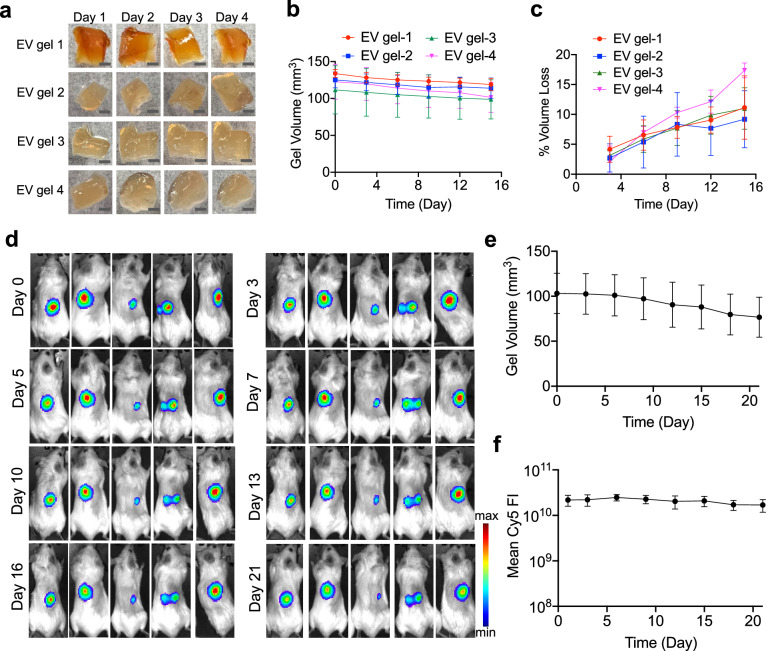
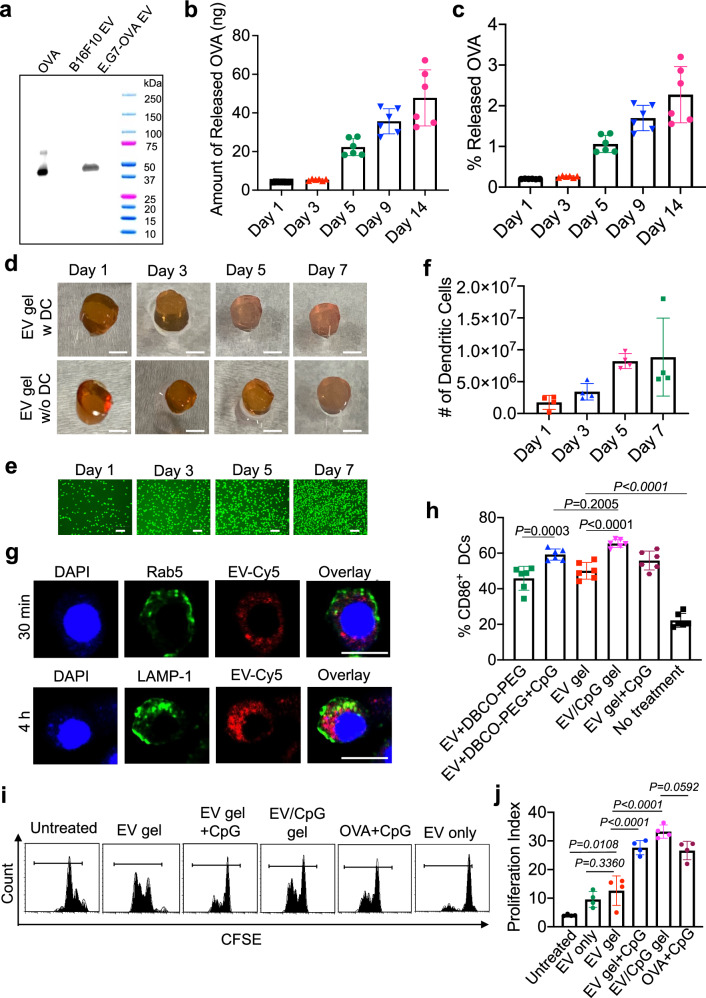
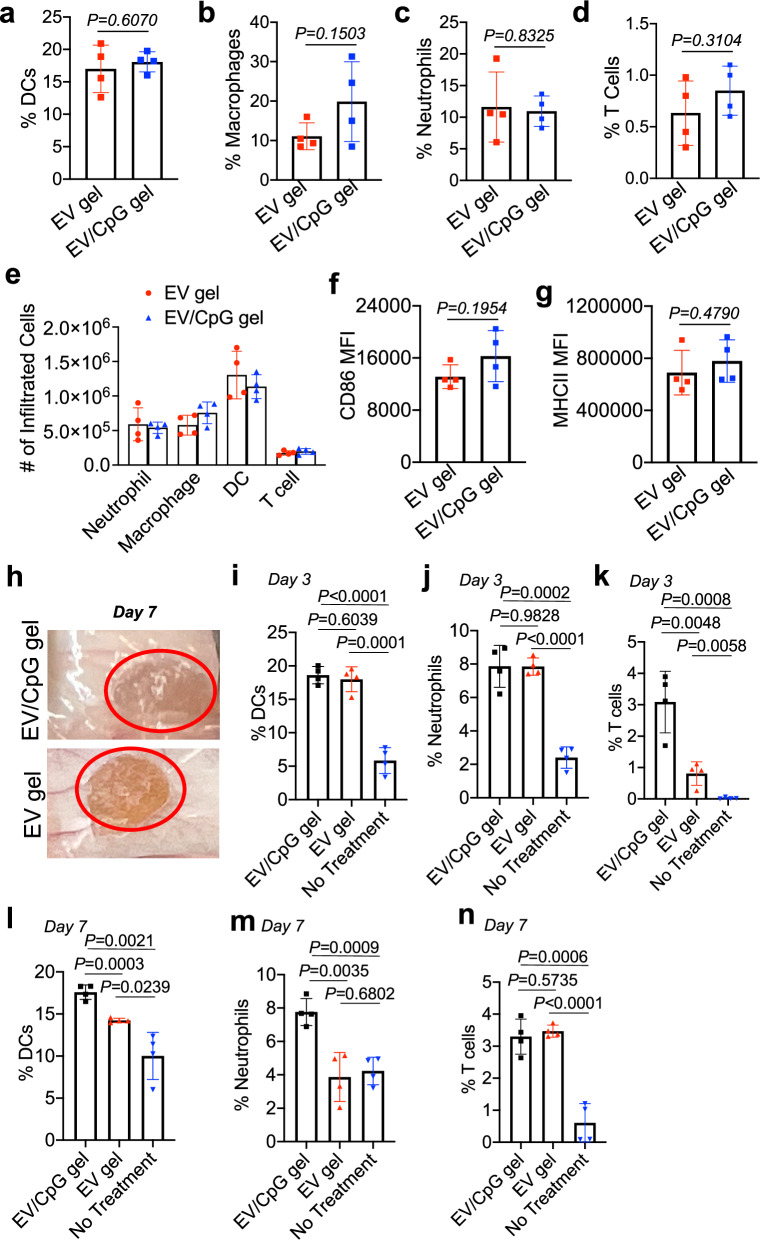
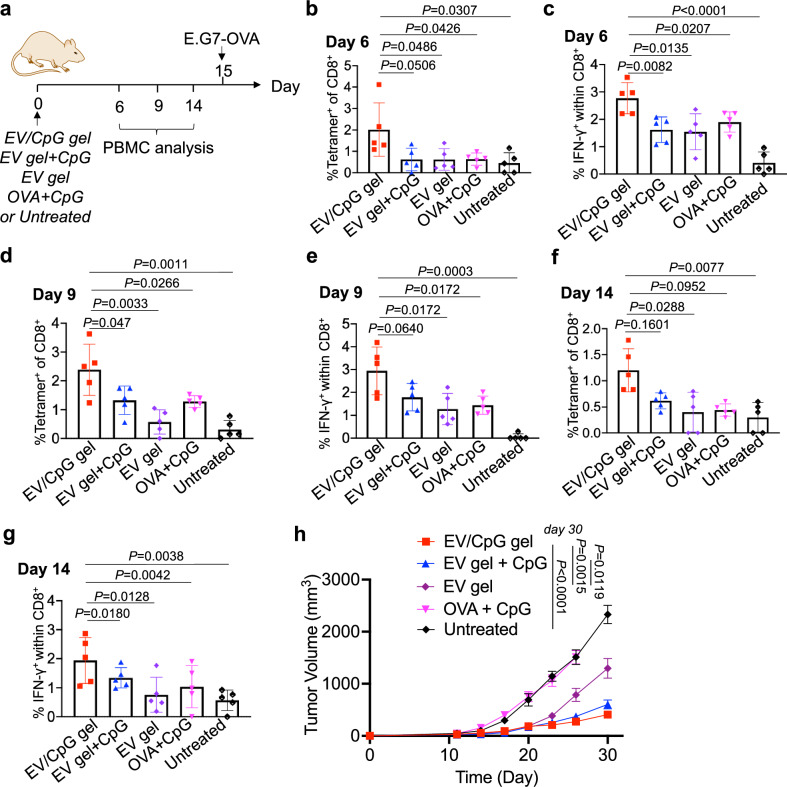
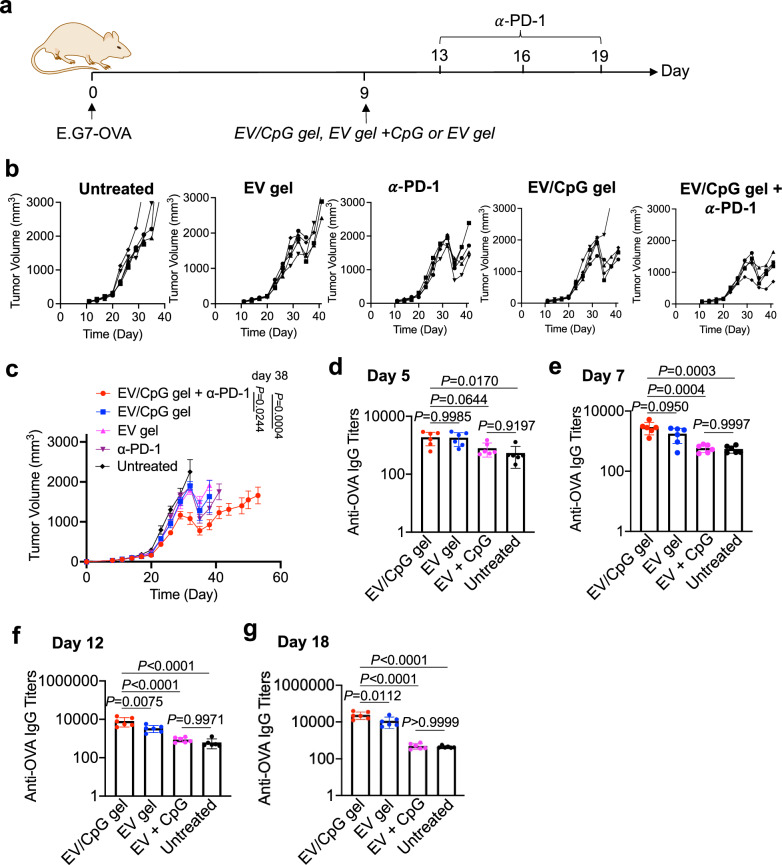
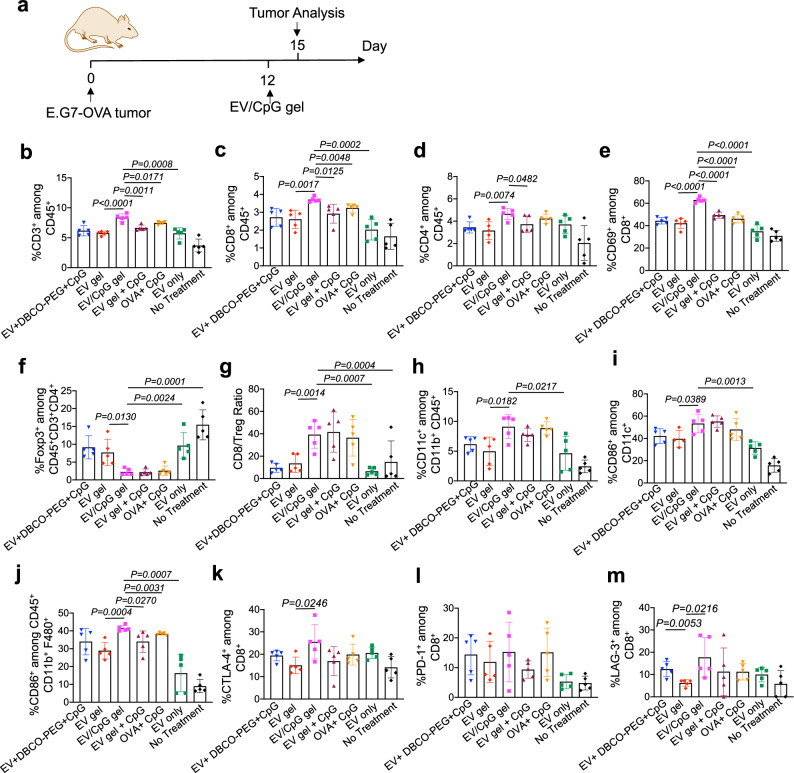
Extracellular vesicles (EVs) have been actively explored for therapeutic applications in the context of cancer and other diseases. However, the poor tissue retention of EVs has limited the development of EV-based therapies. Here we report a facile approach to fabricating injectable EV hydrogels with tunable viscoelasticity and gelation temperature, by metabolically tagging EVs with azido groups and further crosslinking them with dibenzocyclooctyne-bearing polyethylene glycol via efficient click chemistry. One such EV gel has a gelation temperature of 39.4 °C, enabling in situ gelation of solution-form EVs upon injection into the body. The in situ formed gels are stable for over 4 weeks and can attract immune cells including dendritic cells over time in vivo. We further show that tumor EV hydrogels, upon subcutaneous injection, can serve as a long-term depot for EV-encased tumor antigens, providing an extended time for the modulation of dendritic cells and subsequent priming of tumor-specific CD8+ T cells. The tumor EV hydrogel also shows synergy with anti-PD-1 checkpoint blockade for tumor treatment, and is able to reprogram the tumor microenvironment. As a proof-of-concept, we also demonstrate that EV hydrogels can induce enhanced antibody responses than solution-form EVs over an extended time. Our study yields a facile and universal approach to fabricating injectable EV hydrogels with tunable mechanics and improving the therapeutic efficacy of EV-based therapies.


Conflict of interest statement

Competing interests: H.W. and R.B. filed a patent application for the extracellular vesicle hydrogel technology. Other authors declare no competing interests.

Figures

Fig. 1
Fig. 1. Injectable EV hydrogels for depot vaccines.
a Schematic illustration of metabolic tagging of extracellular vesicles (EVs) and subsequent formation of EV hydrogels via click chemistry. b EV hydrogels for therapeutic cancer vaccines. Injectable EV hydrogels can persist for weeks in vivo, allowing for sustained modulation of dendritic cells (DCs) that can process and present EV-encased tumor antigens. Tumor antigen-presenting DCs can then migrate to lymph nodes to prime tumor-specific CD8+ T cells for eventual tumor killing. Figures a and b were created using Biorender.
Fig. 2
Fig. 2. Synthesis and characterization of EV hydrogels.
a Schematic illustration of labeling of cancer cells with azido group and subsequent secretion of azido-labeled EVs (created using Biorender). b Cy5 fluorescence intensity of E.G7-OVA EVs that were incubated with DBCO-Cy5 for 30 min (n = 5 technical replicates). Also shown are the c average diameter (n = 4 technical replicates), d relative concentration (n = 4 technical replicates), and e TEM images of azido-labeled EVs and control EVs derived from E.G7-OVA cells. f Proteomic analysis of azido-labeled and control E.G7-OVA EVs. Two different batches of EVs were analyzed. Proteins with relatively higher concentrations are included. g Schematics showing the formation of EV gels from azido-labeled EVs and DBCO-PEG via click chemistry. h Photos of the mixture of DBCO-PEG and azido-labeled EVs or control EVs at 37 °C. i Quantification of EV-N3 before and after mixing with DBCO-PEG (n = 3 technical replicates). j Representative plots and k average storage moduli (G’) and loss Moduli (G”) of formed EV gels (n = 4 technical replicates). l SEM image of EV gels. All the numerical data are presented as mean ± SD (two-tailed Student’s t test was used; 0.01 <*P ≤ 0.05; **P ≤ 0.01; ***P ≤ 0.001; ****P ≤ 0.0001).
Fig. 3
Fig. 3. EV hydrogels with tunable gelation temperature, storage moduli, and stress relaxation half-lives.
EV gels were formed by mixing 8-arm DBCO-PEG and different concentrations of azido-labeled EVs. An EV concentration of 7 × 109/mL, 1.75 × 109/mL, 1.17 × 109/mL, 0.875 × 109/mL, and 0.70 × 109/mL was used for EV gel-1, EV gel-2, EV gel-3, EV gel-4, and EV gel-5, respectively. Shown are the changes of storage moduli (G’) and loss moduli (G”) of a EV gel-1, b EV-gel 2, and c EV-gel 3 at constant strain (γ = 0.5%) during heating from 20 °C to 80 °C, measured at a heating speed of 5 °C/min. Changes of G’ and G” over step time at 37 °C for d EV gel-1, e EV gel-2, and f EV gel-3. g Representative stress relaxation curves and h stress relaxation half-lives of EV gel 1–5. i Porosity of EV gels (n = 4 technical replicates, ANOVA with a post hoc Fisher’s LSD test was used. 0.01 <*P ≤ 0.05; **P ≤ 0.01; ***P ≤ 0.001; ****P ≤ 0.0001).
Fig. 4
Fig. 4. EV hydrogels are stable in vitro and in vivo.
a Photos of EV gel 1, EV gel 2, EV gel 3, and EV gel 4 immersed in PBS for different times. An EV concentration of 7 × 109/mL, 1.75 × 109/mL, 1.17 × 109/mL, and 0.875 × 109/mL was used for EV gel-1, EV gel-2, EV gel-3, and EV gel-4, respectively. b Change in the volume of gels over time in vitro (n = 4 technical replicates). c Percentage of volume loss for EV gels over time in vitro (n = 4 technical replicates). df Mice were subcutaneously injected with the mixture of Cy5-conjugated/azido-labeled EVs and DBCO-PEG, which formed a gel rapidly after injection. d IVIS images of mice at different times post injection. e Change of EV gel volume over time (n = 5 technical replicates). f Change of Cy5 fluorescence intensity of EV gels over time (n = 5 technical replicates). Numerical data are presented as mean ± SD.
Fig. 5
Fig. 5. EV gels gradually release encased molecules, are biocompatible with DCs, and enable the generation of antigen-presenting DCs in vitro.
a Western blot analysis of OVA in E.G7-OVA derived EVs. Pure OVA protein and EVs collected from B16F10 cells were used as controls. b, c EV gels (EV gel-1) were incubated at 37 °C for up to 2 weeks. Aliquots of the medium were collected on day 1, 3, 5, 9, and 14, respectively for ELISA assay to quantify the released OVA from EV gels. b Accumulated release of OVA from EV gels over time (n = 6 technical replicates). c Percentage of released OVA over time (n = 6 technical replicates). df Calcein AM-stained DCs were loaded on top of the EV gel (4 mm diameter × 2 mm height) and incubated at 37 °C. d Pictures of EV gels with or without DCs over time. Scale bar: 2 mm. e Fluorescence images of DCs on EV gels at different times. Scale bar: 100 μm. f Quantification of DCs on EV gels over time (n = 4 technical replicates). ‘#’ denotes number. g CLSM images of DCs after incubation with EV-Cy5 for 30 min and 4 h, respectively. DCs were stained with Rab5 primary antibody and FITC-conjugated goat anti-rabbit secondary antibody, or Alexa Fluor 488-conjugated anti-LAMP-1. Scale bar: 10 µm. This experiment was repeated independently at least three times with similar results. h Percentages of CD86+ DCs after incubation with different groups for 16 h (n = 6 technical replicates). DCs were added to the top of EV gels (EV gel, CpG-conjugated EV gel, or CpG-encapsulating EV gel) or incubated with the solution of non-crosslinked EVs (without or with CpG). i, j DCs were loaded into EV gel, CpG-encapsulating EV gel, CpG-conjugated EV gel, or incubated with a solution of OVA and CpG or the solution of EVs for 16 h, harvested, and then cocultured with CFSE-stained OT-I cells for three days. Shown are (i) representative CFSE histograms of OT-I cells and (j) proliferation index of OT-I cells in different groups (n = 4 technical replicates). All the numerical data are presented as mean ± SD (ANOVA with a post hoc Fisher’s LSD test was used. 0.01 <*P ≤ 0.05; **P ≤ 0.01; ***P ≤ 0.001; ****P ≤ 0.0001).
Fig. 6
Fig. 6. Immune cells including DCs migrate to subcutaneously injected EV gels.
Mice were subcutaneously injected with the mixture of azido-labeled EVs (with or without conjugation of DBCO-CpG) and DBCO-PEG, which formed gels rapidly after injection. Gels were harvested after three days. Shown are percentages of a DCs, b macrophages, c neutrophils, and d T cells among CD45+ cells at the gel site (n = 4 mice). e Number of neutrophils, macrophages, DCs, and T cells at the gel site (n = 4 mice). ‘#’ denotes number. f CD86 MFI of DCs at the gel site (n = 4 mice). g MHCII MFI of DCs at the gel site (n = 4 mice). h Pictures of EV/CpG gel and EV gel at 7 days after subcutaneous injection. Also shown are the percentages of i DCs, j neutrophils, and k T cells in the fibrous capsule surrounding the gel at 3 days post gel injection (n = 4 mice). Percentages of l DCs, m neutrophils, and n T cells in the fibrous capsule surrounding the gel at 7 days post gel injection (n = 4 mice). All the numerical data are presented as mean ± SD (two-tailed Student’s t test was used. 0.01 <*P ≤ 0.05; **P ≤ 0.01; ***P ≤ 0.001; ****P ≤ 0.0001).
Fig. 7
Fig. 7. CpG-conjugated EV gels exhibit enhanced CTL response and antitumor efficacy.
a Timeframe of the vaccination study. EV gel, EV gel+CpG, EV/CpG gel, OVA+CpG or PBS were subcutaneously injected into C57BL/6 mice on day 0. E.G7-OVA tumor cells were inoculated on day 15. Shown are the percentages of (b, d, f) MHCI-SIINFEKL tetramer+ CD8+ T cells and (c, e, g) IFN-r+ CD8+ T cells (after ex vivo SIINFEKL restimulation) in PBMCs on day 6, 9, and 14, respectively (n = 5 mice). h Average E.G7-OVA tumor volume of each group over the course of the prophylactic tumor study (n = 5 mice). Statistical analyses on day 30 are provided. All the numerical data are presented as mean ± SD except for (h) where data are presented as mean ± SEM (ANOVA with a post hoc Fisher’s LSD test was used. 0.01 <*P ≤ 0.05; **P ≤ 0.01; ***P ≤ 0.001; ****P ≤ 0.0001).
Fig. 8
Fig. 8. CpG-conjugated EV gel shows synergy with α-PD-1 for tumor treatment and induces enhanced antibody responses.
a Timeframe of the therapeutic tumor study against E.G7-OVA tumors for (ad). E.G7-OVA tumor was inoculated on day 0. EV/CpG gel or EV gel was subcutaneously injected on day 9. α-PD-1 was i.p. administered on days 13, 16 and 19. b Individual tumor curves for each group. c Average E.G7-OVA tumor volume of each group over the course of the therapeutic tumor study (n = 5 mice). Statistical analyses on day 38 are provided. dg C57BL/6 mice were subcutaneously injected with EV/CpG gel, EV gel, the mixture of uncrosslinked EV and CpG, or PBS on day 0. Shown are the anti-OVA IgG titers in the serum of mice on d day 5, e day 7, f day 12, and g day 18, respectively (n = 6 mice). Anti-OVA titers were measured via ELISA assay. Data in (c) are presented as mean ± SEM and data in (dg) are presented as mean ± SD (ANOVA with a post hoc Fisher’s LSD test was used. 0.01 <*P ≤ 0.05; **P ≤ 0.01; ***P ≤ 0.001; ****P ≤ 0.0001).
Fig. 9
Fig. 9. CpG-conjugated EV gel reprograms the tumor microenvironment.
E.G7-OVA tumor was inoculated to C57BL/6 mice on day 0, followed by the subcutaneous injection of CpG-conjugated EV gel (EV/CpG gel), CpG-encapsulating EV gel, EV gel, the solution of OVA and CpG, EV alone, the non-crosslinked solution of EV, DBCO-PEG and CpG, or PBS on day 12. Tumors were harvested for analysis on day 15. a Timeframe of immune cell analysis study. b % CD3+ cells among CD45+ population (n = 5 mice). c % CD8+ cells among CD45+ population (n = 5 mice). d % CD4+ cells among CD45+ population (n = 5 mice). e % CD69+ cells among CD8+ population (n = 5 mice). f % FoxP3+ cells among CD45+CD3+CD4+ population (n = 5 mice). g Number ratio of CD8+ T cells to Tregs (n = 5 mice). h % CD11c+ DCs among CD11b+CD45+ population (n = 5 mice). i % CD86+ cells among CD11c+ DCs (n = 5 mice). j % CD86+ cells among CD11b+F4/80+ macrophages (n = 5 mice). k % CTLA-4+ cells among CD8+ T cells (n = 5 mice). l % PD-1+ cells among CD8+ T cells (n = 5 mice). m % LAG-3+ cells among CD8+ T cells (n = 5 mice). All the numerical data are presented as mean ± SD (ANOVA with a post hoc Fisher’s LSD test was used. 0.01 <*P ≤ 0.05; **P ≤ 0.01; ***P ≤ 0.001; ****P ≤ 0.0001).

Similar articles

Cited by

References

    1. Kang, T., Atukorala, I. & Mathivanan, S. Biogenesis of Extracellular Vesicles. Subcell. Biochem97, 19–43 (2021). - PubMed
    1. Herrmann, I. K., Wood, M. J. A. & Fuhrmann, G. Extracellular vesicles as a next-generation drug delivery platform. Nat. Nanotechnol.16, 748–759 (2021). - PubMed
    1. Gurung, S., Perocheau, D., Touramanidou, L. & Baruteau, J. The exosome journey: from biogenesis to uptake and intracellular signalling. Cell Commun. Signal19, 47–47 (2021). - PMC - PubMed
    1. Kalluri, R. & LeBleu, V. S. The biology, function, and biomedical applications of exosomes. Science367, eaau6977 (2020). - PMC - PubMed
    1. Tenchov, R. et al. Exosomes─Nature’s Lipid Nanoparticles, a Rising Star in Drug Delivery and Diagnostics. ACS Nano16, 17802–17846 (2022). - PMC - PubMed

MeSH terms

LinkOut - more resources