. 2025 Apr 22;11(1):61.
doi: 10.1038/s41522-025-00698-7.

Multi-omics profiling of dairy cattle oxidative stress identifies hindgut-derived Phascolarctobacterium succinatutens exhibiting antioxidant activity

Affiliations

Multi-omics profiling of dairy cattle oxidative stress identifies hindgut-derived Phascolarctobacterium succinatutens exhibiting antioxidant activity

Duo Gao et al. NPJ Biofilms Microbiomes. .

Abstract

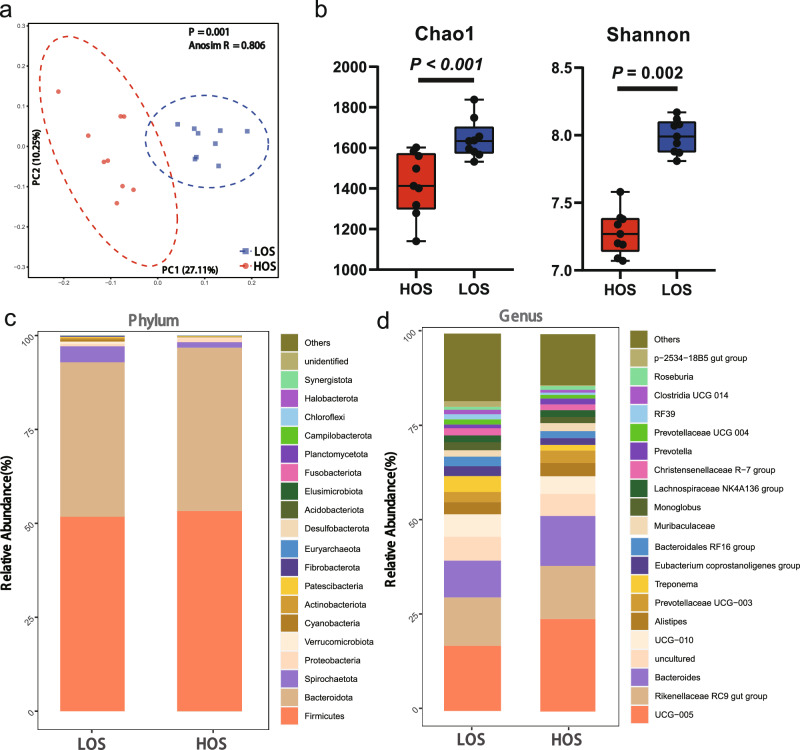
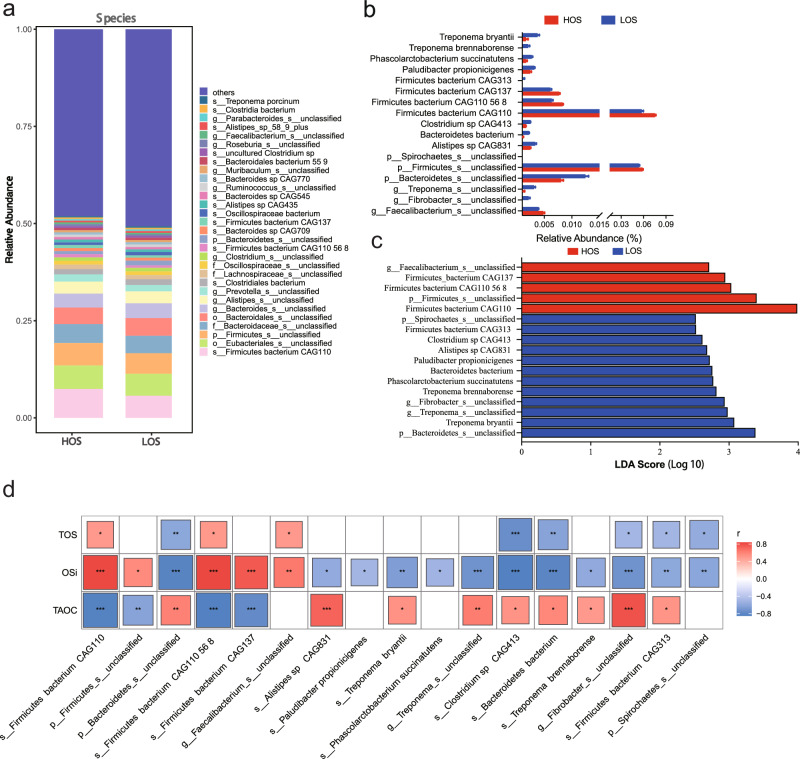
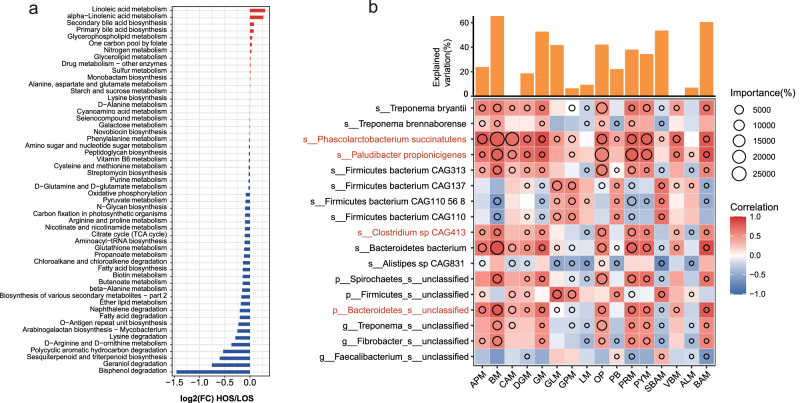
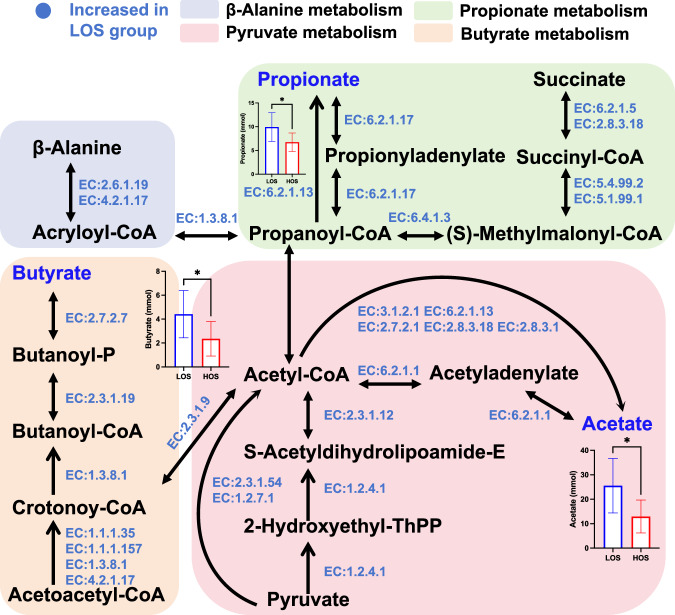
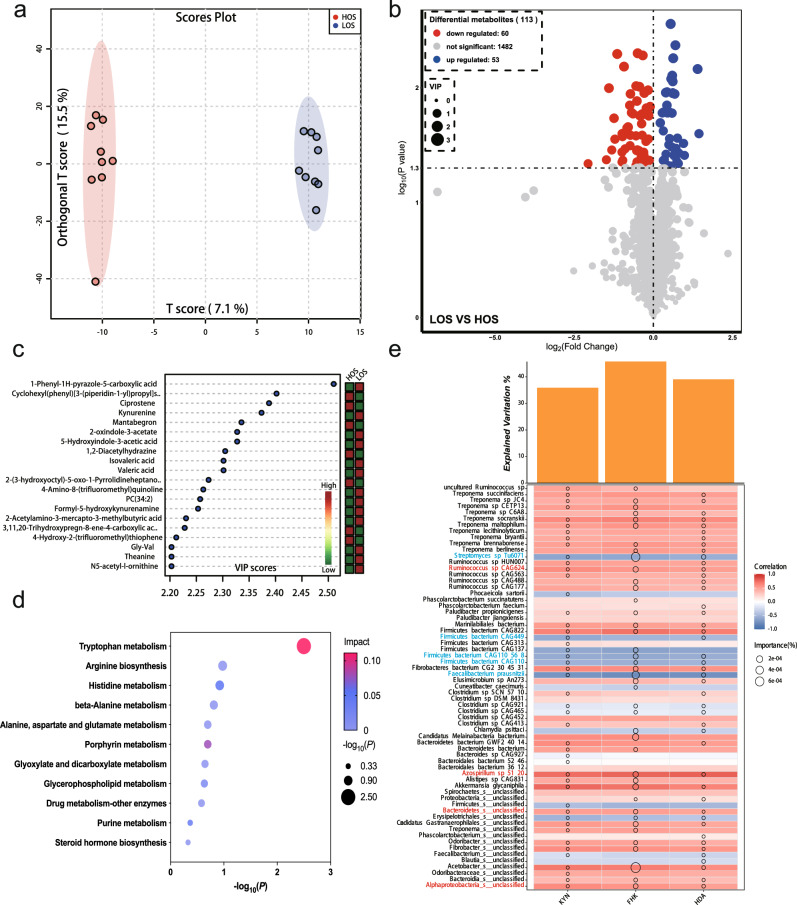
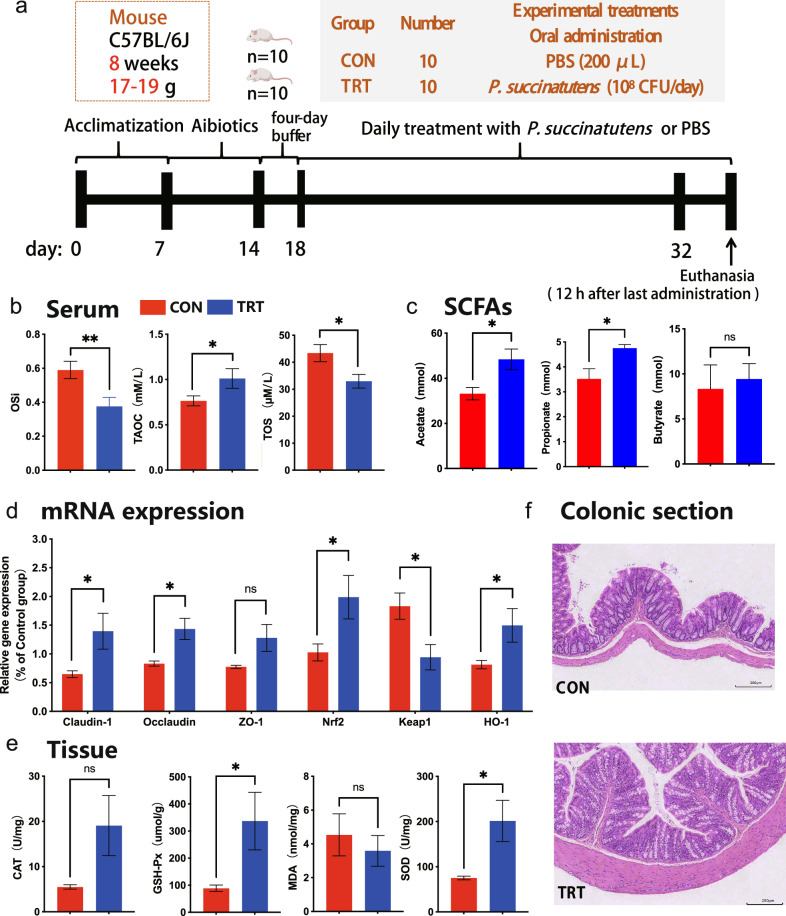
An imbalance between oxidative and antioxidant processes in the host can lead to excessive oxidation, a condition known as oxidative stress (OS). Although changes in the hindgut microbiota have been frequently linked to OS, the specific microbial and metabolic underpinnings of this association remain unclear. In this study, we enrolled 81 postpartum Holstein cows and stratified them into high oxidative stress (HOS, n = 9) and low oxidative stress (LOS, n = 9) groups based on the oxidative stress index (OSi). Using a multi-omics approach, we performed 16S rRNA gene sequencing to evaluate microbial diversity, conducted metagenomic analysis to identify functional bacteria, and utilized untargeted metabolomics to profile serum metabolites. Our analyses revealed elevated levels of kynurenine, formyl-5-hydroxykynurenamine, and 5-hydroxyindole-3-acetic acid in LOS dairy cows. Additionally, the LOS cows had a higher abundance of short-chain fatty acids (SCFAs)-producing bacteria, including Bacteroidetes bacterium, Paludibacter propionicigenes, and Phascolarctobacterium succinatutens (P. succinatutens), which were negatively correlated with OSi. To explore the potential role of these bacteria in mitigating OS, we administered P. succinatutens (108 cfu/day for 14 days) to C57BL/6 J mice (n = 10). Oral administration of P. succinatutens significantly increased serum total antioxidant capacity, decreased total oxidants, and reduced OSi in mice. Moreover, this treatment promoted activation of the Nrf2-Keap1 antioxidant pathway, significantly enhancing the enzymatic activities of GSH-Px and SOD, as well as the concentrations of acetate and propionate in the colon. In conclusion, our findings suggest that systemic tryptophan metabolism and disordered SCFAs production are concurrent factors influenced by hindgut microbiota and associated with OS development. Modulating the hindgut microbiota, particularly by introducing specific SCFAs-producing bacteria, could be a promising strategy for combating OS.


Conflict of interest statement

Competing interests: The authors declare no competing interests. Ethics approval: The animal care protocol received approval from the Animal Care and Use Committee of China Agricultural University (Protocol Number: AW10803202-3-1) and the Beijing Laboratory Animal Research Center (Protocol Number: BLARC-LAWER-202404003).

Figures

Fig. 1
Fig. 1. Hindgut microbial diversity in cows based on the 16S rRNA gene sequencing data (n = 9).
a The PCoA of the Bray–Curtis distances of the fecal microbiome between the LOS and HOS groups. b The Shannon and Chao1 indices of the fecal microbiome between the LOS and HOS groups. c Relative abundance of phyla between the LOS and HOS groups. d Relative abundance of genera between the LOS and HOS groups. Differences in alpha diversity between groups were assessed using Tukey’s test. Beta-diversity distances were calculated using the Bray-Curtis algorithm. PCoA with UPGMA clustering was performed. ANOSIM with 999 permutations was used to evaluate differences between the LOS and HOS groups. The significance threshold was set at P < 0.05.
Fig. 2
Fig. 2. The interaction network of microbial genera in the HOS and LOS groups.
a The co-occurrence network of microbial genera in the HOS group. b The co-occurrence network of microbial genera in the LOS group. Nodes are sized and colored by their degree, while edges are thickened based on R value magnitude and colored red for positive or green for negative correlation. c The average degree of networks in the two groups. d The natural connectivity of networks in the two groups.
Fig. 3
Fig. 3. Association of altered hindgut microbial species and oxidative stress parameters according to metagenomic sequencing data (n = 9).
a Relative abundance of the fecal microbiome at the species level in the LOS and HOS groups. b Identification of the signature species in the LOS and HOS groups using linear discriminant analysis (LDA) effect size (P < 0.05, LDA > 2.5). c Relative abundance of the signature species in the LOS and HOS groups. d Signature microbial species linked to oxidative stress parameters. Correlations between variables were tested by Spearman’s analysis. *P < 0.05, **P < 0.01, ***P < 0.001.
Fig. 4
Fig. 4. Interaction network based on the top 50 bacterial species.
a The interaction network of HOS species. b The interaction network of LOS species. Nodes are sized by their degree and colored by node grouping, while edges are thickened based on R value magnitude and colored red for positive or green for negative correlation. Only P < 0.05 and the correlation coefficient > |0.5| for the top 50 most abundant species are retained. c The closeness and degree of species in the LOS network.
Fig. 5
Fig. 5. Significance of key microbial species involved in functional KEGG pathways (n = 9).
a Hindgut microbiota KEGG pathways for metabolism that were perturbed between the HOS and LOS groups (P < 0.10), along with the average transcripts per million for each pathway in each group. P values calculated using the Wilcoxon test. b Spearman’s correlations between altered fecal microbial species and their impact on functional KEGG pathways (level C). The circles overlaid on diamonds represent the significance of individual microbial species. The bar chart summarizes the total explained variations in microbial species, integrating this information with the heatmap. APM, BM, CAM, DGM, GM, GLM, GPM, LM, OP, PB, PRM, PYM, SBAM, VBM, ALM, and BAM denote arginine and proline metabolism, butanoate metabolism, cysteine and methionine metabolism, D-glutamine and D-glutamate metabolism, glutathione metabolism, glycerolipid metabolism, glycerophospholipid metabolism, linoleic acid metabolism, one carbon pool by folate, oxidative phosphorylation, primary bile acid biosynthesis, propanoate metabolism, pyruvate metabolism, secondary bile acid biosynthesis, vitamin B6 metabolism, alpha-linolenic acid metabolism, and beta-alanine metabolism, respectively. Signature bacteria names are labeled red.
Fig. 6
Fig. 6. Metabolic networks of the hindgut microbiome based on metagenomic data (n = 9).
The metabolic pathways are presented based on information from the KEGG database. The SCFAs (acetate, propionate, and butyrate) measured in this study are represented in dark blue font, and the EC numbers indicate the enzyme whose genes were enriched in the hindgut in the LOS group. EC numbers and corresponding enzyme names: EC:1.1.1.157: 3-hydroxybutyryl-CoA dehydrogenase; EC:1.1.1.35: 3-hydroxyacyl-CoA dehydrogenase; EC:1.2.4.1: pyruvate dehydrogenase E1 component; EC:1.2.7.1: pyruvate ferredoxin oxidoreductase alpha subunit; EC:1.3.8.1: butyryl-CoA dehydrogenase; EC:2.3.1.12: pyruvate dehydrogenase E2 component; EC:2.3.1.19: phosphate butyryltransferase; EC:2.3.1.54: formate C-acetyltransferase; EC:2.3.1.9: acetyl-CoA C-acetyltransferase; EC:2.6.1.19: 4-aminobutyrate aminotransferase; EC:2.7.2.1: acetate kinase; EC:2.7.2.7: butyrate kinase; EC:2.8.3.1: propionate CoA-transferase; EC:2.8.3.18: succinyl-CoA:acetate CoA-transferase; EC:3.1.2.1: acetyl-CoA hydrolase; EC:4.2.1.17: enoyl-CoA hydratase; EC:5.1.99.1: methylmalonyl-CoA epimerase; EC:5.4.99.2: methylmalonyl-CoA mutase; EC:6.2.1.1: acetyl-CoA synthetase; EC:6.2.1.13: acetate-CoA ligase subunit alpha; EC:6.2.1.17: propionyl-CoA synthetase; EC:6.2.1.5: succinyl-CoA synthetase alpha subunit; EC:6.4.1.3: propionyl-CoA carboxylase alpha subunit.
Fig. 7
Fig. 7. Serum metabolomic profiles in LOS and HOS cows (n = 9).
a OPLS-DA scores plot of the serum metabolome. b Volcanic plot of differential serum metabolites in the LOS and HOS (control) groups. Metabolites in the LOS group compared with those in the HOS group showed varying degrees of up- or downregulation (red and blue, respectively) (P < 0.05). c VIP score scatter plot of the top 20 differential metabolites between LOS and HOS groups (P < 0.05). Colors denote upregulation (red) or downregulation (green) in corresponding group. d The KEGG enrichment analysis bubble chart. Each bubble represents a metabolic pathway. The bubble size indicates pathway significance, and its color reflects the pathway impact value from topology analysis. Lighter colors denote lower impact, and darker colors denote higher impact. e Spearman’s correlations between altered signature microbial species and their impact on differential serum metabolites. The circles superimposed on diamonds represent the significance of individual microbial species. The bar chart summarizes the total explained variations of microbial species, integrating this information with the heatmap. KYN, FHK, and HDA denote the kynurenine, formyl-5-hydroxykynurenamine, and 5-hydroxyindole-3-acetic acid, respectively. Signature bacteria names are labeled red.
Fig. 8
Fig. 8. Effects of P. succinatutens administration on host antioxidant capacity, colonic gene expression, and enzyme activity in mice (n = 5).
a Experimental design. b Serum oxidative stress parameters. c Short-chain fatty acid concentrations in colonic contents. d Relative expression of genes related to colon integrity and the Nrf2 pathway. e Activities of superoxide dismutase (SOD), glutathione peroxidase (GSH-Px), catalase (CAT), and malondialdehyde (MDA) in the colon tissue. f Representative H&E staining of colon sections from each group, observed at 100× magnification. Scale bar, 200 μm. *P < 0.05, **P < 0.01.

Similar articles

Cited by

References

    1. Bhattacharyya, A., Chattopadhyay, R., Mitra, S. & Crowe, S. E. Oxidative stress: an essential factor in the pathogenesis of gastrointestinal mucosal diseases. Physiol. Rev.94, 329–354 (2014). - PMC - PubMed
    1. Darenskaya, M. A., Kolesnikova, L. I. & Kolesnikov, S. I. Oxidative stress: pathogenetic role in diabetes mellitus and its complications and therapeutic approaches to correction. Bull. Exp. Biol. Med.171, 179–189 (2021). - PMC - PubMed
    1. Forman, H. J. & Zhang, H. Targeting oxidative stress in disease: promise and limitations of antioxidant therapy. Nat. Rev. Drug Discov.20, 689–709 (2021). - PMC - PubMed
    1. Jadeja, R. N., Devkar, R. V. & Nammi, S. Oxidative stress in liver diseases: pathogenesis, prevention, and therapeutics. Oxid. Med. Cell Longev.2017, 8341286 (2017). - PMC - PubMed
    1. Abuelo, A., Hernández, J., Benedito, J. L. & Castillo, C. The importance of the oxidative status of dairy cattle in the periparturient period: revisiting antioxidant supplementation. J. Anim. Physiol. Anim. Nutr.99, 1003–1016 (2015). - PubMed

LinkOut - more resources