. 2025 Apr 23;15(1):14004.
doi: 10.1038/s41598-025-98740-3.

Shenfu injection alleviates lipopolysaccharide-induced liver injury in septic mice

Affiliations

Shenfu injection alleviates lipopolysaccharide-induced liver injury in septic mice

Bai-Tao Lu et al. Sci Rep. .

Abstract

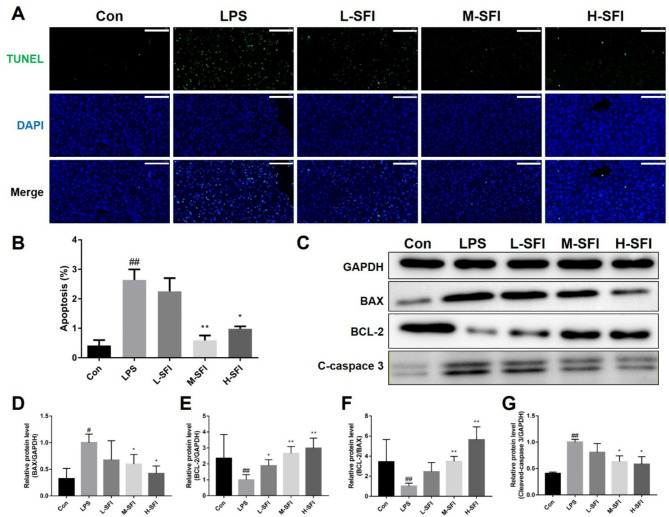
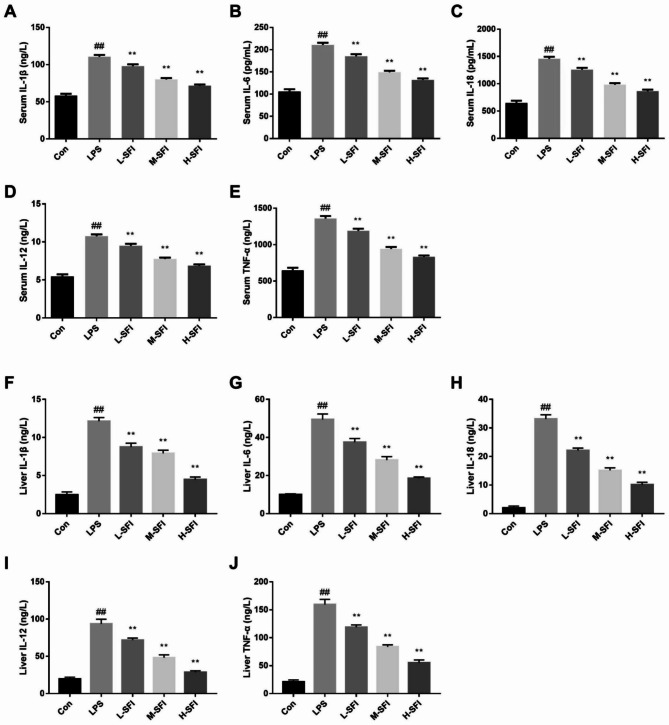
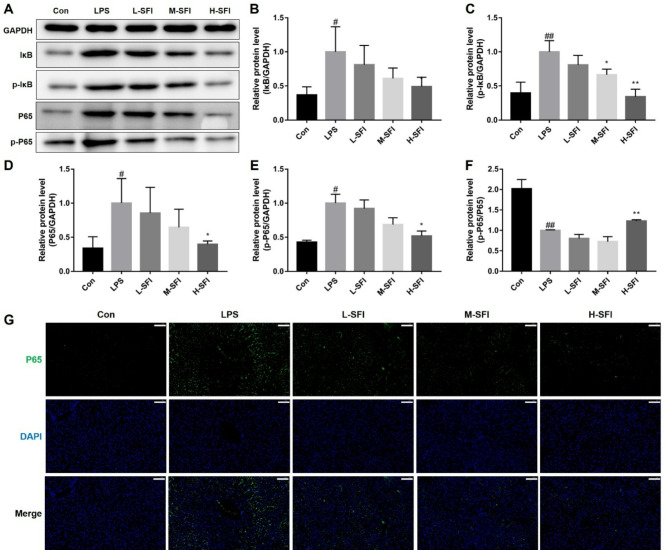
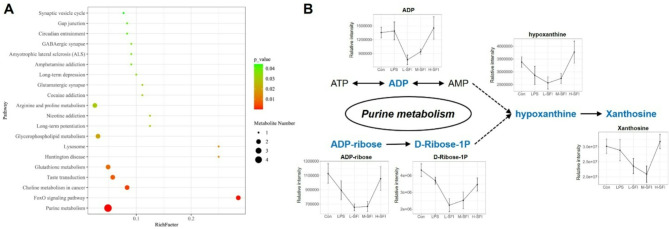
Shenfu injection (SFI) is a traditional Chinese medicine (TCM) for treating sepsis. The purpose of this study was to evaluate the protective effect of SFI on lipopolysaccharide (LPS)-induced liver injury in septic mice. The results showed that SFI intervention reduced liver/body weight and significantly improved the survival rate of septic mice. SFI could relieve the apoptosis of liver cells and ameliorate liver function in LPS-induced septic mice. SFI also diminished the serum and liver levels of the inflammatory factors IL-1β, IL-6, IL-18, IL-12, and TNF-α in a dose-dependent manner. SFI enhanced the mitochondrial membrane potential and alleviated the mitochondrial damage of liver in septic mice. Western blot revealed that the phosphorylation levels of IκB and NF-κB p65 increased significantly in the liver of LPS-induced septic mice. After SFI intervention, the phosphorylation levels of IκB and NF-κB p65 gradually recovered, especially at high concentration. SFI treatment reduced nuclear transduction, thus reducing transcriptional activity, which indicated that NF-κB p65 signal pathway might contribute to the anti-inflammatory and anti-apoptotic activities of SFI in the liver of LPS-induced septic mice. In addition, the metabolic profile of liver tissue in the model group was different from that in the control group, and SFI significantly regulated liver purine metabolism. These valuable findings suggested that SFI could improve mitochondrial function and mitigate inflammation and apoptosis, and thus alleviate LPS-induced liver injury in septic mice. SFI may be a promising drug to treat septic liver injury.

Keywords: Apoptosis; Inflammation; Liver injury; Purine metabolism; Sepsis; Shenfu injection; Traditional Chinese medicine.


Conflict of interest statement

Declarations. Competing interests: The authors declare no competing interests. Ethics approval: The study was conducted in accordance with ARRIVE guidelines and executed in compliance with the Ethics Committee of the Second Affiliated Hospital of Harbin Medical University (IRB number: SYDW2019-229).

Figures

Fig. 1
Fig. 1
SFI alleviates LPS-induced liver injury in septic mice. (A) SFI significantly improved the survival rate of septic mice. (B) SFI significantly reduced liver/body weight of septic mice. (C) Liver phenotype and HE staining of mice in each group (scale bar, 200 μm). Con, blank control group with i.p. equivalent saline only; LPS, model group with i.p. 10mg/kg LPS only; L-SFI, LPS injection + low dosage SFI group (2 ml/kg); M-SFI, LPS injection + medium dosage SFI group (4 ml/kg); H-SFI, LPS injection + high dosage SFI group (8 ml/kg). Compared with the blank control group, # p < 0.05 and ## p < 0.01 were considered to be significant. Compared with the LPS group, *p < 0.05 and **p < 0.01 were considered to be significant. Data were expressed as mean ± SD.
Fig. 2
Fig. 2
SFI relieved LPS-induced hepatocyte apoptosis in septic mice. (A) Representative images of TUNEL staining showed apoptotic and non-apoptotic nuclei in each group—blue dots indicate normal nuclei and green dots represent apoptotic nuclei (scale bar, 100 μm). (B) Percentage of TUNEL-positive cells in each group. (C) Western blot demonstrated the expression levels of BAX, BCL-2, and cleaved-caspase 3 in each group. (DG) SFI reversed the increased expression levels of BAX and cleaved-caspase 3, and the decreased expression levels of BCL-2 and BCL-2/BAX in liver tissue. Con, blank control group with i.p. equivalent saline only; LPS, model group with i.p. 10mg/kg LPS only; L-SFI, LPS injection + low dosage SFI group (2 ml/kg); M-SFI, LPS injection + medium dosage SFI group (4 ml/kg); H-SFI, LPS injection + high dosage SFI group (8 ml/kg). Compared with the blank control group, #p < 0.05 and ##p < 0.01 were considered to be significant. Compared with the LPS group, *p < 0.05 and **p < 0.01 were considered to be significant. Data were expressed as mean ± SD.
Fig. 3
Fig. 3
SFI attenuated LPS-induced inflammation in septic mice. (A) SFI decreased the serum levels of IL-1β in septic mice. (B) SFI decreased the serum levels of IL-6 in septic mice. (C) SFI decreased the serum levels of IL-18 in septic mice. (D) SFI decreased the serum levels of IL-12 in septic mice. (E) SFI decreased the serum levels of TNF-α in septic mice. (F) SFI decreased the liver levels of IL-1β in septic mice. (G) SFI decreased the liver levels of IL-6 in septic mice. (H) SFI decreased the liver levels of IL-18 in septic mice. (I) SFI decreased the liver levels of IL-12 in septic mice. (J) SFI decreased the liver levels of TNF-α in septic mice. Con, blank control group with i.p. equivalent saline only; LPS, model group with i.p. 10mg/kg LPS only; L-SFI, LPS injection + low dosage SFI group (2 ml/kg); M-SFI, LPS injection + medium dosage SFI group (4 ml/kg); H-SFI, LPS injection + high dosage SFI group (8 ml/kg). Compared with the blank control group, #p < 0.05 and ##p < 0.01 were considered to be significant. Compared with the LPS group, *p < 0.05 and **p < 0.01 were considered to be significant. Data were expressed as mean ± SD.
Fig. 4
Fig. 4
SFI ameliorated LPS-induced liver dysfunction in septic mice. (A) SFI reduced the serum activity of ALT in septic mice. (B) SFI reduced the serum activity of AST in septic mice. (C) SFI reduced the serum activity of LDH in septic mice. (D) SFI reduced the serum activity of MPO in septic mice. (E) SFI reduced the serum level of total bilirubin in septic mice. (F) SFI reduced the serum level of direct bilirubin in septic mice. Con, blank control group with i.p. equivalent saline only; LPS, model group with i.p. 10mg/kg LPS only; L-SFI, LPS injection + low dosage SFI group (2 ml/kg); M-SFI, LPS injection + medium dosage SFI group (4 ml/kg); H-SFI, LPS injection + high dosage SFI group (8 ml/kg). Compared with the blank control group, #p < 0.05 and ##p < 0.01 were considered to be significant. Compared with the LPS group, *p < 0.05 and **p < 0.01 were considered to be significant. Data were expressed as mean ± SD.
Fig. 5
Fig. 5
SFI alleviated LPS-induced mitochondrial damage of liver in septic mice. (A) Representative TEM images of ultrastructural morphology in the liver subjected to different interventions (magnification, ×10,000 and ×25,000; scale bar, 2 or 1 μm; the red arrows indicate mitochondrial). (B) Representative images of JC-1 staining in the liver (magnification, ×200; scale bar, 100 μm). (C) The ratio of aggregated and monomeric JC-1. Con, blank control group with i.p. equivalent saline only; LPS, model group with i.p. 10mg/kg LPS only; L-SFI, LPS injection + low dosage SFI group (2 ml/kg); M-SFI, LPS injection + medium dosage SFI group (4 ml/kg); H-SFI, LPS injection + high dosage SFI group (8 ml/kg). Compared with the blank control group, #p < 0.05 and ##p < 0.01 were considered to be significant. Compared with the LPS group, *p < 0.05 and **p < 0.01 were considered to be significant. Data were expressed as mean ± SD.
Fig. 6
Fig. 6
SFI inhibited NF-κB p65 signal pathway of liver in septic mice. (A) Representative western blot expressions of IκB, p-IκB, P65 and p-P65 proteins in each group. (BF) SFI reversed the increased expressions of IκB, p-IκB, P65, p-P65 and p-P65/P65 proteins in the liver of septic mice. (G) Nuclear translocation of NF-κB p65 was detected by immunofluorescence (scale bar, 100 μm). Con, blank control group with i.p. equivalent saline only; LPS, model group with i.p. 10mg/kg LPS only; L-SFI, LPS injection + low dosage SFI group (2 ml/kg); M-SFI, LPS injection + medium dosage SFI group (4 ml/kg); H-SFI, LPS injection + high dosage SFI group (8 ml/kg). Compared with the blank control group, #p < 0.05 and ##p < 0.01 were considered to be significant. Compared with the LPS group, *p < 0.05 and **p < 0.01 were considered to be significant. Data were expressed as mean ± SD.
Fig. 7
Fig. 7
Liver metabolic profiles in mice. (A) Based on untargeted metabolomics analysis, liver metabolic profiles were analyzed using PCA models (n = 6). (B) Venn diagram based on the number of differential metabolites screened by the VIP > 1.0 criteria in OPLS-DA models and p < 0.05 in Student’s t-test. (C) 313 metabolites were clustered by Mfuzz analysis into significant discrete clusters to illustrate the relative expression changes of the metabolomics data. Each line represents the relative abundance of each metabolism. (D) Heatmap of 38 dysregulated matabolites in five groups. #p < 0.05 and ##p < 0.01 compared with the blank control group. *p < 0.05 and **p < 0.01 compared with the LPS group based on Student’s t-test. Con, blank control group with i.p. equivalent saline only; LPS, model group with i.p. 10mg/kg LPS only; L-SFI, LPS injection + low dosage SFI group (2 ml/kg); M-SFI: LPS injection + medium dosage SFI group (4 ml/kg); H-SFI: LPS injection + high dosage SFI group (8 ml/kg).
Fig. 8
Fig. 8
SFI significantly regulated liver purine metabolism pathway in septic mice. (A) Enriched metabolic pathways of liver differential metabolites between the QFPDD and LPS group using MetaboAnalyst 5.0. (B) SFI regulated metabolites related to liver purine metabolism. (HMDB ID: ADP, HMDB0001341; ADP-ribose, HMDB0001178; D-Ribose-1P, HMDB0250796; hypoxanthine, HMDB0000157; Xanthosine, HMDB0000299.) Con, blank control group with i.p. equivalent saline only; LPS, model group with i.p. 10mg/kg LPS only; L-SFI, LPS injection + low dosage SFI group (2 ml/kg); M-SFI: LPS injection + medium dosage SFI group (4 ml/kg); H-SFI: LPS injection + high dosage SFI group (8 ml/kg).

References

    1. Bauer, M. et al. Mortality in sepsis and septic shock in Europe, North America and Australia between 2009 and 2019- results from a systematic review and meta-analysis. Crit. Care24(1), 239 (2020). - PMC - PubMed
    1. Cecconi, M. et al. Sepsis and septic shock. Lancet392(10141), 75–87 (2018). - PubMed
    1. Luo, S. et al. Application of ultrasound-guided external jugular vein puncture in intensive care unit (ICU) patients with severe sepsis: A randomised trial. Ann. Palliat. Med.10(1), 530–537 (2021). - PubMed
    1. Rudd, K. E. et al. Global, regional, and national sepsis incidence and mortality, 1990–2017: Analysis for the Global Burden of Disease Study. The Lancet395(10219), 200–211 (2020). - PMC - PubMed
    1. Xie, L. et al. Wenqingyin suppresses ferroptosis in the pathogenesis of sepsis-induced liver injury by activating the Nrf2-mediated signaling pathway. Phytomedicine114, 154748 (2023). - PubMed

MeSH terms