. 2025 Apr 22;16(1):3785.
doi: 10.1038/s41467-025-59149-8.

Antibody function predicts viral control in newborn monkeys immunised with an influenza virus HA stem nanoparticle

Affiliations

Antibody function predicts viral control in newborn monkeys immunised with an influenza virus HA stem nanoparticle

Kali F Crofts et al. Nat Commun. .

Abstract

The lack of an approved influenza vaccine for infants <6 months, coupled with the requirement for annual updates of current vaccines, warrants the development of a universal vaccine that can confer protection in young infants. Here we test the ability of a ferritin nanoparticle universal influenza vaccine (H1ssF) containing the stem region of hemagglutinin (HA) adjuvanted with AddaVax to elicit responses in newborn African green monkeys (AGM). Vaccinated newborns show robust HA stem-specific IgG responses but, despite the high antibody levels, viral load in the lung following H1N1 Ca09 challenge is variable among animals. Further analysis indicates that viral clearance is correlated with the presence of antibodies with neutralizing and antibody-dependent cellular phagocytosis activity. Our findings show that newborn AGM can generate functional HA stem-specific antibodies for viral clearance following vaccination with H1ssF+AddaVax and support further investigation of H1ssF as a universal vaccine for this vulnerable human population.


Conflict of interest statement

Competing interests: M.K. is listed as inventor of patents and patent applications on vaccine immunogens used in this study filed by the U.S. Department of Health and Human Services. The remaining authors declare no competing interests.

Figures

Fig. 1
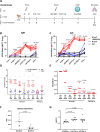
Fig. 1. Vaccination with H1ssF+AddaVax elicits robust HA stem-specific Abs with broad HA recognition that are associated with viral clearance in adult AGMs after Ca09 challenge.
Adult AGM vaccination and sampling schedule (A). Circulating levels of NC99 stem-specific IgM (B) and IgG (C) were assessed by ELISA. HA-specific IgG cross-reactivity was measured against group 1 and group 2 HA molecules in the plasma at d45 p.b. The stem-reactive mAb FI6V3 (grey triangle) served as a positive control (D). Circulating levels of IgG binding to the full-length NC99 HA, H1-N27, H1-N45, or H1-N27/45 were assessed by ELISA at d45 p.b. Central and anchor Abs were quantified by subtracting AUC for H1-27/45 from the H1-27 (central) or H1-N45 (anchor) AUC values (E). NC99 stem-specific IgG avidity was measured by determining the NaSCN concentration that gave a 50% reduction in optical absorbance compared to the untreated sample (F). Adult AGMs were challenged with 5 × 107 TCID50 of Ca09 H1N1 at d45 p.b. Viral genomes were measured in BAL collected at d7 p.c. (G). NC99 HA stem-specific IgG (H) and IgA (I) were measured in the BAL at d7 p.c. The dotted line represents the limit of detection (LOD). Threshold titre (TT) is defined as the highest dilution resulting in an OD450 greater than 3X the assay background. Ctrl (n = 3), H1ssF + AddaVax (n = 3). Symbols represent individual animals. The line in each column represents the median. Statistical significance: two-way ANOVA with Tukey’s post hoc analysis (B, C, H), a one-way ANOVA with either Tukey’s (D, F) post hoc analysis, or a paired (E), or unpaired two-tailed t test (G, I, J). Not significant p 0.05 (not indicated on graph). Figure 1A was created in BioRender. Alexander-Miller, M. (2025) https://BioRender.com/017wbod. Source data are provided as a Source Data file.
Fig. 2
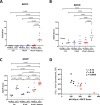
Fig. 2. Antibody quality increases after challenge in adult AGMs that were vaccinated and boosted with H1ssF + AddaVax.
Neutralising IC80 titres against H1N1 A/New Caledonia/20/1999 (A), H1N1 A/California/07/2009 (B), and H5N1 A/Vietnam/1203/04 (C) were assessed by reporter-based microneutralization (MN) assays. The MN IC80 titre was measured at the plasma dilution at which 80% of virus infection was inhibited. ADCC activity against HA Ca09 was measured using KHYG-1 cells expressing rhesus macaque CD16. ADCC activity was measured as the percentage of CD107a+ KHYG-1 cells present after sequential gating of cells by FSC/SSC and Zombie Violet negativity (D). ADCD scores were determined by calculating the percentage of HA FluoSpheres beads that were C3 + × GMFI/1000 at the highest dilution (1:5) (E). ADCP was measured by THP-1 uptake of Ab-opsonised HA FluoSpheres beads. THP-1 were gated through FSC/SSC and singlet gates prior to FITC bead analysis. Phagocytosis scores were determined by measuring the percentage of bead-positive THP-1 cells×the the geometric mean fluorescence/1000 at the 1:800 dilution. (F). The dotted line represents the limit of detection (LOD) for each assay. Ctrl (n = 3), H1ssF + AddaVax (n = 3). The line in each column represents the median. Statistical significance was determined using a one-way ANOVA with a Fisher’s LSD post hoc analysis. Not significant p = > 0.05 (not indicated on graph). Source data are provided as a Source Data file.
Fig. 3
Fig. 3. Vaccination with H1ssF+AddaVax promotes cross-reactive HA stem-specific Abs in newborn AGMs.
Newborn AGM vaccination and sampling schedule (A). Circulating levels of NC99 stem-specific IgM (B) and IgG (C) were assessed by ELISA. IgG reactivity was measured against group 1 and group 2 HA molecules in the plasma at d41/45 p.b. The stem-reactive mAb FI6V3 was included as a positive control (D). The ratio of the TT for each HA divided by that for NC99 HA was calculated as a measure of the efficiency of recognition of each HA molecule (E). Circulating levels of IgG that binds to full-length NC99 HA, H1-N27, H1-N45, or H1-N27/45 were assessed by ELISA at d41/45 p.b. The quantity of central and anchor region Abs was determined by subtracting the AUC for H1-27/45 from that of H1-27 (central) and H1-N45 (anchor) (F). NC99 stem-specific IgG avidity was measured by determining the concentration of NaSCN that resulted in a 50% reduction in optical absorbance compared to the untreated sample (G). The dotted line represents the LOD. TT was defined as the highest dilution resulting in an OD450 greater than 3X assay background. Ctrl (n = 5), H1ssF (n = 4), H1ssF + AddaVax (n = 8). Symbols represent individual animals and are maintained throughout the datasets. The line in each column represents the median (F, G). Statistical analysis: two-way ANOVA with Tukey’s post hoc analysis (BD, G), a one-way ANOVA with a Dunnet’s (H1 NC99 is the control) (E), or a two-sided paired t test (F). Statistics represent H1ssF + AddaVax vs. Ctrl. (Fig. 3B, C, and D). Ctrl vs. H1ssF was not significant. Statistical analysis in Fig. 3E is for each HA vs. WT NC99 HA. Not significant p = >0.05 (not included on graph). Figure 3A was created in BioRender. Alexander-Miller, M. (2025) https://BioRender.com/vqpx526. Source data are provided as a Source Data file.
Fig. 4
Fig. 4. Vaccination with H1ssF+AddaVax resulted in viral clearance following H1N1 challenge in a subset of newborn AGMs.
Newborn AGMs were challenged with 1×10⁷ TCID50 of Ca09 H1N1 at d41/45 p.b. Viral genomes were measured in the BAL at d7p.c. (A). IL-6 levels were measured in the BAL at d7 p.c. (B). NC99 stem-specific IgG (C) and IgA (D) were assessed in the BAL at d7 p.c. in newborn AGM. The dotted line represents the LOD for the assay. The line in each column represents the median. Statistical significance was determined by using a one-way ANOVA with pairwise comparisons between groups (A), a non-parametric Wilcoxon rank scores with Kruskal-Wallis analysis (B), or a one-way ANOVA with Tukey’s post hoc analysis (C, D). Not significant p 0.05 (not indicated on graph). Source data are provided as a Source Data file.
Fig. 5
Fig. 5. Vaccination with H1ssF+AddaVax results in broadly neutralising antibody in a subset of newborn AGM that is correlated with viral clearance.
Neutralising Ab was measured using a reporter-based microneutralization (MN) assay at d1 p.v., d41/45 p.b., and d7 p.c. Neutralising IC80 titres against H1N1 A/New Caledonia/20/1999 (A), H1N1 A/California/07/2009 (B), and H5N1 A/Vietnam/1203/04 (C) were quantified. A Spearman’s correlation analysis was performed on A/New Caledonia/20/1999 nAb IC80 titre from d41/45 p.b and the NC99 central epitope IgG AUC from d41/45 p.b in H1ssF + AddaVax newborns (D). A Spearman’s correlation analysis was performed on A/New Caledonia/20/1999 nAb IC80 titre and viral genomes/mL in the BAL at d7 p.c. (E). Ctrl (n = 5), H1ssF (n = 4), H1ssF+AddaVax (n = 8). The dotted line represents the limit of detection (LOD) for the assay. The line in each column represents the median. Statistical significance was determined using a one-way ANOVA with a Fisher’s LSD post hoc analysis. Not significant p 0.05 (not indicated on graph). Source data are provided as a Source Data file.
Fig. 6
Fig. 6. Vaccination of newborn AGM with H1ssF+AddaVax results in antibody with ADCP activity that is correlated with viral clearance.
Plasma samples were assessed for Ab function at d41/45 p.b. and d7 p.c. in newborn AGM. ADCC activity was quantified using the percent of CD107a + KHYG-1 cells. Cells were sequentially gated as follows: FSC/SSC and viability staining, followed by CD107a positivity (A). ADCD scores were determined as follows: percent C3 + beads × GMFI/1000 at a 1:5 dilution of plasma (B). ADCP scores were determined using the percent of bead-positive THP-1 cells X the geometric mean/1000 at a 1:800 dilution of plasma. THP-1 were gated through FSC/SSC and singlet gates prior to FITC bead+ analysis (C). A Pearson correlation analysis was performed on viral genomes/mL in the BAL at d7 p.c. versus d41/45 p.b. ADCP scores (D). Ctrl (n = 4), H1ssF (n = 4), H1ssF + AddaVax (n = 8)). The dotted line represents the limit of detection (LOD) for the assay. The line in each column represents the median. Statistical significance was determined using a one-way ANOVA with a Fisher’s LSD post hoc analysis. Not significant p 0.05 (not indicated on graph). Source data are provided as a Source Data file.

References

    1. Esposito, S. & Principi, N. The rational use of influenza vaccines in healthy children and children with underlying conditions. Curr. Opin. Infect. Dis.22, 244–249 (2009). - PubMed
    1. Lafond, K. E. et al. Global role and burden of influenza in pediatric respiratory hospitalizations, 1982-2012: A systematic analysis. PLoS Med.13, e1001977 (2016). - PMC - PubMed
    1. Crofts, K. F. & Alexander-Miller, M. A. Challenges for the newborn immune response to respiratory virus infection and vaccination. Vaccines8, 10.3390/vaccines8040558 (2020). - PMC - PubMed
    1. Levy, O. Innate immunity of the newborn: basic mechanisms and clinical correlates. Nat. Rev. Immunol.7, 379–390 (2007). - PubMed
    1. Halasa, N. B., Gerber, M. A., Chen, Q., Wright, P. F. & Edwards, K. M. Safety and immunogenicity of trivalent inactivated influenza vaccine in infants. J. Infect. Dis.197, 1448–1454 (2008). - PMC - PubMed

MeSH terms

LinkOut - more resources