. 2025 Jun;39(6):1464-1475.
doi: 10.1038/s41375-025-02621-7. Epub 2025 Apr 22.

Age-related mesenchymal stromal cell senescence is associated with progression from MGUS to multiple myeloma

Affiliations

Age-related mesenchymal stromal cell senescence is associated with progression from MGUS to multiple myeloma

Natalya Plakhova et al. Leukemia. 2025 Jun.

Abstract

The risk of progression of monoclonal gammopathy of undetermined significance (MGUS) to multiple myeloma (MM) increases with advancing age, suggesting that progression may be influenced by age-related changes within the bone marrow (BM) microenvironment. We hypothesise that senescent mesenchymal stromal cells (MSCs), which accumulate in the BM with age, may contribute to MGUS progression to MM. Here, we show that, like BM MSCs from aged non-cancer controls, BM MSCs from both MM and MGUS patients exhibit a senescent phenotype characterised by enlarged, flattened morphology, increased β-galactosidase activity and CDKN2A expression, and decreased proliferation rate compared with BM MSCs from healthy young individuals. While coculture with BM MSCs suppresses the proliferative capacity of MM cell lines in vitro, induction of senescence via irradiation or replicative exhaustion in healthy MSCs relieves this suppression, compared with non-senescent MSCs. This may, in part, be attributable to upregulated expression of the BMP antagonist Gremlin1 in senescent MSCs, which facillitates MM cell proliferation. Notably, the risk of progression to MM was significantly elevated in MGUS patients with increased MSC senescence. Collectively, our data provide evidence that age-related accumulation of senescent MSCs may be a driver of MGUS to MM progression.


Conflict of interest statement

Competing interests: The authors declare no competing interests.

Figures
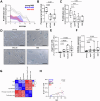
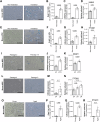
Fig. 1
Fig. 1. MSCs from MGUS and MM patients are characterised by an age-related senescent phenotype.
A Human BM MSCs cultures were passaged twice weekly until cessation of proliferation. Once per week, cell proliferation rate (populations doublings per day) was assessed after 3 days in culture. Graph depicts the mean (solid line) and SEM (dotted lines) proliferation rate over sequential passage for young non-cancer controls (n = 8), MGUS (n = 10) or MM (n = 9) MSC donors. B Passage at which MSCs ceased proliferating is shown for young non-cancer controls (n = 8), MGUS (n = 10) or MM (n = 9) individual MSC donors. C MSCs from young (n = 8) or aged (n = 8) non-cancer controls and MGUS (n = 9) or MM (n = 8) patients at passage 5 were seeded and cell proliferation rate was assessed by conducting cell counts after 3 days in culture. D MSCs from young (n = 8) or aged (n = 8) non-cancer controls and MGUS (n = 9) or MM (n = 8) patients at passage 5 were seeded and stained for β-gal activity (blue) after 24 hours of culture. Representative images are shown; scale bar: 50 µm. E Percentage of β-gal-positive cells, as a proportion of total cells (identified by DAPI co-stain), was calculated for young (n = 8) or aged (n = 8) non-cancer controls and MGUS (n = 9) or MM (n = 8) patients. F Expression of CDKN2A, normalised to ACTB, was analysed by qRT-PCR in passage 5 MSCs from young non-cancer controls (n = 11), aged non-cancer controls (n = 8) and newly diagnosed MGUS (n = 11) and MM (n = 12) patients. G Correlation matrix (Pearson’s) showing association between donor age and senescent phenotype in MSCs from young and aged non-cancer controls and MGUS and MM patients. * indicates p < 0.05 for Pearson's correlation. H Scatter dot plot showing correlation between donor age and % β-gal positivity in MSCs from young and aged non-cancer controls and MGUS and MM patients. Box and whisker plots (B, C, E, F) depict median and interquartile ranges. p values are shown for Kruskal-Wallis test with Dunn’s post-test (B, C, E, F) or Pearson’s correlation (H).
Fig. 2
Fig. 2. Increased MSC senescence in MGUS patients is associated with increased risk of MGUS to MM progression.
A ROC curve analysis for MSC β-gal staining in MGUS patients, showing the sensitivity and specificity for distinguishing MGUS to MM progressors from non-progressing patients. B MGUS patients stratified as β-galhi (≥27.5% β-gal-positive MSCs; n = 6), MGUS patients stratified as β-galmid (10-27.5% β-gal-positive MSCs; n = 8) and β-gallo (<10% β-gal-positive MSCs; n = 10) were assessed for rate of MGUS to MM progression using Kaplan-Meier analysis. C Scatter dot plot showing correlation between % β-gal positivity in MSCs and bone marrow PC burden in MGUS patients. p values are shown for the log-rank test (B) or Pearson’s correlation (C).
Fig. 3
Fig. 3. In vitro growth of MM cells is suppressed by MSCs, but suppression inversely correlates with the level of MSC senescence.
A Luciferase-expressing MM cell lines were cultured alone (monoculture) or in coculture with MSCs from young non-cancer controls (KMM1, RPMI-8226) or eight-week-old mice (5TGM1). After 3 days, the relative number of MM cells was quantified by bioluminescence imaging (BLI). Graphs depict mean ± SEM of three (KMM1, RPMI-8226) or four independent experiments (5TGM1). B Luciferase-expressing MM cell lines were cultured in conditioned media (CM) from MSCs from young non-cancer controls (KMM1, RPMI-8226) or eight-week-old mice (5TGM1) or non-conditioned medium (αMEM media). After 3 days, the relative number of MM cells was quantified by BLI. Graphs depict mean ± SEM of three independent experiments (KMM1, RPMI-8226) or mean ± range of two independent experiments (5TGM1). C MSCs from young (n = 8) or aged (n = 8) non-cancer controls or MGUS (n = 8) or MM (n = 8) patients were seeded 24 hours prior to adding luciferase-expressing KMM1 cells. After 3 days, relative KMM1 cell numbers per well were quantitated using BLI and normalised to KMM1 cell numbers in monoculture. Box and whisker plots depict median and interquartile ranges. Scatter dot plots showing correlation of MSC % β-gal positivity (D) and CDKN2A expression (E) with relative KMM1 cell number in coculture with MSCs from young and aged non-cancer controls and MGUS and MM patients, normalised to cell numbers in monoculture. p values are shown for pairedt tests (A, B), Kruskal-Wallis test with Dunn’s post-test (C) or Pearson’s correlation (D, E).
Fig. 4
Fig. 4. Irradiation-, replication- and ageing-induced MSC senescence alleviates MSC-induced suppression of MM cell growth in vitro.
A Human MSCs from young non-cancer controls were irradiated at 60 Gy and β-gal activity (blue) was evaluated after 10 days and compared with non-irradiated cells. B β-gal-positive cells were quantitated in irradiated and non-irradiated cultures relative to total cell number (identified by DAPI co-stain). C Expression of CDKN1A was assessed in irradiated and non-irradiated MSCs and normalised to ACTB. D Irradiated MSCs (day 7) from young non-cancer controls and donor-matched non-irradiated controls were cocultured with luciferase expressing KMM1 cells. After 3 days, the relative number of KMM1 cells was enumerated using BLI. E MSCs from eight-week-old C57BL/KaLwRij mice were irradiated at 60 Gy and β-gal activity (blue) was evaluated after 4 days and compared with donor-matched non-irradiated cells. F β-gal-positive cells were quantitated relative to total DAPI-positive cell number. G Expression of Cdkn1a was assessed, normalised to Gapdh. H Irradiated and non-irradiated C57BL/KaLwRij MSCs were seeded and, after adhering overnight, coculture was initiated with luciferase-expressing 5TGM1 cells. After 3 days, the relative number of 5TGM1 cells was enumerated by BLI. I Human MSCs cultures, isolated from young non-cancer controls were passaged twice weekly until they reached replicative senescence (passage 13–15), as demonstrated by assessment of β-gal activity. J Expression of CDKN2A, normalised to ACTB, was analysed at passage 3 and at the passage of senescence (passage 13–15) in MSCs from young non-cancer controls. K MSCs from young non-cancer controls were cocultured with luciferase-expressing KMM1 cells for 3 days and the relative number of KMM1 cells was enumerated using BLI. L β-gal activity was assessed in MSC cultures from eight-week-old C57BL/KaLwRij mice at passage 4 and passage 6. M Expression of Cdkn2a, normalised to Gapdh, was analysed in C57BL/KaLwRij mouse MSCs. N Luciferase-expressing 5TGM1 cells were cocultured with mouse MSCs at passage 4, 5 and 6 and, after 3 days, 5TGM1 cells were enumerated using BLI. O MSCs were isolated by plastic adherence from long bones from young (eight-week-old) and aged (18-month-old) C57BL/KaLwRij mice, cultured for two weeks in vitro and cells were stained for β-gal activity at passage 3. P The percentage of β-gal-positive cells, was calculated relative to DAPI-positive cell number. Q Expression of Cdkn2a, normalised to Gapdh, was analysed in mouse MSCs from young and aged donors (n = 3–4 donors/group). R Mouse MSCs from young and aged donors were cocultured with luciferase-expressing 5TGM1 MM PCs for 3 days and 5TGM1 cells were quantitated by BLI. Representative images of β-gal-stained cells are shown (A, E, I, L, O). Scale bar: 200 µm. Graphs depict mean ± SEM of three (C, D, G, PR), four (F, H, J, M, N, Q), five (B) or six (K) independent donors. p values are shown for paired t test (BD, F-H, J, K, M), one-way ANOVA with Holm-Šídák’s post-test (N) or unpaired t test (PR).
Fig. 5
Fig. 5. Identification of Gremlin1 as a pro-myeloma SASP factor that is expressed by MGUS and MM MSCs.
A In silico analysis of gene expression in BM MSCs from MM patients (n = 4) and age-matched healthy controls (n = 3) in publicly available microarray dataset GSE36474. Heat map shows the average z-score for significantly up- or down-regulated genes. B Expression of GREM1, normalised to ACTB, was analysed in passage 5 MSCs from young non-cancer controls (n = 11), aged non-cancer controls (n = 8) and newly diagnosed MGUS (n = 11) and MM (n = 12) patients. Box and whisker plots depict median and interquartile ranges. C Human MSCs from young non-cancer controls (n = 6) were irradiated (60 Gy) to induce senescence and GREM1 expression, normalised to ACTB, was assessed. Data are normalised to non-irradiated cells. D Replicative senescence was induced in human MSCs from young non-cancer controls (n = 11) by sequential passage (passage 13–15) and GREM1 expression, normalised to ACTB, was analysed. Data are normalised to low passage (passage 3) cells. Luciferase-expressing KMM1 (E), RPMI-8226 (F) and 5TGM1 (G) cells were cocultured with OP9 cells overexpressing Gremlin1 (OP9-Grem1), and empty vector control cells (OP9-EV) and, after three days, the relative number of MM cells was quantitated using BLI (n = 3 independent experiments). Graphs depict mean ± SEM. p values are shown for Kruskal-Wallis test with Dunn’s post-test (B) or Wilcoxon matched-pairs signed rank test (C, D) or paired t tests (E–G).

References

    1. Zhou L, Yu Q, Wei G, Wang L, Huang Y, Hu K, et al. Measuring the global, regional, and national burden of multiple myeloma from 1990 to 2019. BMC Cancer. 2021;21:606. - PMC - PubMed
    1. Landgren O, Weiss BM. Patterns of monoclonal gammopathy of undetermined significance and multiple myeloma in various ethnic/racial groups: support for genetic factors in pathogenesis. Leukemia. 2009;23:1691–97. - PubMed
    1. Kyle RA, Larson DR, Therneau TM, Dispenzieri A, Kumar S, Cerhan JR, et al. Long-term follow-up of monoclonal gammopathy of undetermined significance. N Engl J Med. 2018;378:241–9. - PMC - PubMed
    1. Cesana C, Klersy C, Barbarano L, Nosari AM, Crugnola M, Pungolino E, et al. Prognostic factors for malignant transformation in monoclonal gammopathy of undetermined significance and smoldering multiple myeloma. J Clin Oncol. 2002;20:1625–34. - PubMed
    1. Gran C, Liwing J, Wagner AK, Verhoek A, Gezin A, Alici E, et al. Comparative evaluation of involved free light chain and monoclonal spike as markers for progression from monoclonal gammopathy of undetermined significance to multiple myeloma. Am J Hematol. 2021;96:23–30. - PMC - PubMed