. 2025 Apr 22;15(1):13901.
doi: 10.1038/s41598-025-96683-3.

Multi-omics analysis constructs a novel neuroendocrine prostate cancer classifier and classification system

Affiliations

Multi-omics analysis constructs a novel neuroendocrine prostate cancer classifier and classification system

Junxiao Shen et al. Sci Rep. .

Abstract

Neuroendocrine prostate cancer (NEPC), a subtype of prostate cancer (PCa) with poor prognosis and high heterogeneity, currently lacks accurate markers. This study aims to identify a robust NEPC classifier and provide new perspectives for resolving intra- tumoral heterogeneity. Multi-omics analysis included 19 bulk transcriptomics, 14 single-cell transcriptomics, 1 spatial transcriptomics, 16 published NE signatures and 10 cellular experiments combined with multiple machine learning algorithms to construct a novel NEPC classifier and classification. A comprehensive single-cell atlas of prostate cancer was created from 70 samples, comprising 196,309 cells, among which 9% were identified as NE cells. Within this framework and in combination with bulk transcriptomics, a total of 100 high-quality NE-specific feature genes were identified and differentiated into NEPup sig and NEPdown sig. The random forest (RF) algorithm proved to be the most effective classifier for NEPC, leading to the establishment of the NEP100 model, which demonstrated robust validation across various datasets. In clinical settings, the use of the NEP100 model can greatly improve the diagnostic and prognostic prediction of NEPC. Hierarchical clustering based on NEP100 revealed four distinct NEPC subtypes, designated VR_O, Prol_N, Prol_P, and EMT_Y, each of which presented unique biological characteristics. This allows us to select different targeted therapeutic strategies for different subtypes of phenotypic pathways. Notably, NEP100 expression correlated positively with neuroendocrine differentiation and disease progression, while the VR-NE phenotype dominated by VR_O cells indicated a propensity for treatment resistance. Furthermore, AMIGO2, a component of the NEP100 signature, was associated with chemotherapy resistance and a poor prognosis, indicating that it is a pivotal target for future therapeutic strategies. This study used multi-omics analysis combined with machine learning to construct a novel NEPC classifier and classification system. NEP100 provides a clinically actionable framework for NEPC diagnosis and subtyping.

Keywords: Computational biology and bioinformatics; Multi-omics; Neuroendocrine prostate cancer (NEPC); Tumor biomarkers; Tumor heterogeneity.


Conflict of interest statement

Declarations: All the authors have approved the manuscript and agree with its submission. Competing interests: The authors declare no competing interests. Ethics approval: Patient specimens were collected in accordance with ethical standards set forth in the Declaration of Helsinki, and written informed consent was obtained from all participants. The study was approved by the Ethics Committee of the Fourth Affiliated Hospital of Zhejiang University Medical College, Yiwu, Zhejiang, China.

Figures

Fig. 1
Fig. 1
Flow diagram of this research. Image created with BioRender.com, with permission.
Fig. 2
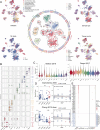
Fig. 2
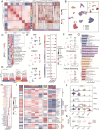
Large-scale comprehensive single-cell atlas of human prostate cancer (PCa). (A), A comprehensive analysis of 196,309 cells from 70 PCa tissues; (B), Violin plot showing the expression levels of selected signature genes in PCa tissues; (C), Violin plot showing previous neuroendocrine (NE) signatures across cell types. The lines inside represent the means ± SDs; (D), Box plots showing previous NE signatures across sample types. Unpaired two-sided Wilcoxon test. Correlation plots showing the correlation of previous NE signatures with the ISUP. Spearman correlation test; (E), Bubble heatmap showing the expression of the top 50 previously common genes in PCa tissues. The dot size indicates the fraction of expressing cells, which are colored on the basis of average normalized expression levels.
Fig. 3
Fig. 3
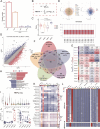
Integration of bulk and single-cell transcriptomics screening for NE signatures. (A), Bar plot showing the sample composition of the PCaProfilter cohort; (B), definition of tumor heterogeneous entropy (THEnt) based on Shannon entropy; (C), box plots showing THE across sample types; (D), dot plot showing the distribution of PCa samples in the PCaProfilter cohort after principal component analysis (PCA), with a single dot being a sample. The bar plot shows the average gene expression of the normalized samples. (E), Heatmap showing the relationships of genetic modules with clinical traits according to WGCNA. Spearman correlation test; All heatmaps shown in this article are provided by the ‘ComplexHeatmap’ package (version 2.22.0, https://bioconductor.org/packages/ComplexHeatmap/). (F), Venn plot showing 5 methods to identify up-regulated NE signature in this study (NEPup sig); (G), Volcano plot showing differentially expressed genes (DEGs) in NEPC vs. ARPC. (H) Bar plot showing the results of pathway enrichment analysis of DEGs. (I), Violin plot showing NEPup sig across cell types; lines inside represent the mean ± SD. (J), Box plot showing the NE signature identified in this study (NEPup sig and NEPdown sig) across sample types. Unpaired two-sided Wilcoxon test; (K), Heatmap showing all NE signatures (both from the previous study and this study) across cell types. Bar plot highlighting differences between luminal and NE cells. (L), Heatmap showing the expression (Z score) of 90 upregulated and 10 downregulated NE feature genes identified in this study.
Fig. 4
Fig. 4
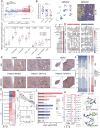
Establishment and validation of the NEPC classifier. (A), The area under the curve (AUC) of the 6 algorithms and 17 NE signatures in the 7 validation cohorts. The error bars denote the SDs. (B), Bar plot showing the importance of the 100 NE feature genes inferred via random forest (RF). Greater importance suggests greater contributions to the RF model when predicting NEPC diagnosis. (C) Definition of the NEPC classifier (NEP100) based on the RF algorithm. (D-F), Violin plots showing NEPup sig across cell types in external single-cell validation datasets. Lines inside represent the mean ± SD; box plot showing NE vs. luminal cells for NEP100. Unpaired two-sided Wilcoxon test; (G), Box plot showing the distribution of NEP100 among different NE features in PDX tumors (n = 112). Unpaired two-sided Wilcoxon testBox plot showing the distribution of NEP100 among different types of PCa progression in organoid tumors. Unpaired two-sided Wilcoxon test; (I), H&E staining and heatmaps of the spatial; (H), distributions of NEPup, NEPdown and NEP100 in multiple regions.
Fig. 5
Fig. 5
Prognostic validation of NEP100 in multiple human PCa cohorts. (A), C-indexes of the top 50 algorithmic combinations (excluding RF) and 17 NE signatures in the 9 validation cohorts. The error bars denote the SDs. (B) Meta-analysis of univariate Cox analysis results for the NEP100_group among different cohorts. (C), K‒M survival curves for overall survival (OS) or biochemical recurrence (BCR) among different cohorts. (D), Box plots showing the NEP100 between pre- and post-castration treatment in PCa patients. ENZ, enzalutamide; (F), Box plots showing NEP100 between different groups of Gleason scores (GSs) in PCa; (F), Heatmap showing the correlation of NEP100 with the activities of multiple signaling pathways in 18 bulk transcriptomic cohorts.
Fig. 6
Fig. 6
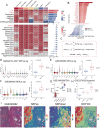
Single-cell heterogeneity landscape of the four subtypes of NE cells. (A), Heatmap showing the correlation of NEP100 sig expression between NE subtypes. (B), UMAP plot showing the four subtypes of NE cells. (C), GSVA enrichment analysis showing the activation status of biological pathways among the four subtypes. (D), Differential gene expression analysis showing up- and downregulated genes across all four subtypes. An adjusted p value < 0.05 is indicated in red. (E), UMAP plots showing the expression of marker genes of the four subtypes in NE cells. (F), Bubble heatmap showing the expression of three key biological pathway genes of the four subtypes in NE cells. The dot size indicates the fraction of expressing cells, which are colored on the basis of average normalized expression levels. (G), Bar plot showing the GO enrichment of specific biological processes, which is based on the highly differentially expressed genes (HDEGs) of three subtypes of tumor cells. (H), Top master TF regulators of each subtype inferred via CaCTS. The color and size of each point were correlated with the normalized values of the CaCTS score and TF expression, respectively. (I), Differential expression profiles of subtype markers, AR-regulated genes (AR panel), REST-repressed genes (NEURO I panel), NE-associated TFs (NEURO II panel), and mesenchymal differentiation genes (MES panel) among the four subtypes of NE cells. Red and blue indicate high and low expression, respectively. (J) Violin plots showing the expression patterns of each classic NE marker and NEPup sig among the four subtypes. The lines inside represent the means ± SDs; (K), Box plot showing the differences in NEP100 among the four subtypes.
Fig. 7
Fig. 7
Trajectories of NEPC subtypes and sample-level heterogeneity. (A), UMAP plot showing the distribution of NEP100, THEnt and pseudotime analysis of NEPC subtypes inferred by Monocle3; (B), Scatter plot showing the relationships among NEP100, THEnt and pseudotime score; (C), Bar chart showing the relationships between pseudotime score and certain biological processes. Red and blue indicate positive and negative correlations, respectively. (D-E), Box plot showing the THEnt and pseudotime scores among the four subtypes. (F), Fan chart showing the percentages of the four subtypes in the NEPC sample. (G), Box plots showing the PSA levels among the four subtypes. (H), Heatmap of the single-sample gene set enrichment analysis (ssGSEA) scores of the four subtypes in the NEPC sample. Red indicates a greater proportion of certain subtypes. (I), The ternary plot is positioned according to the proportion of different isoforms of marker genes expressed by the cell (greater than the average expression), and the three vertices of the graph correspond to cells that express only a certain isoform of marker genes. Cells expressing the same number of isoforms of marker genes are located in the center of the plot. (J), Box plot showing the expression of marker genes (Z score) among the three sample-level phenotypes. (K), Bubble heatmap showing the comparison among the three sample-level phenotypes in terms of relative sensitivity to platinum and topoisomerase (TOP) inhibitors, DNA damage agents, antimetabolites, and inhibitors of BCL2, Aurora kinase (AURK), and PARP. The dot size indicates the proportion of samples with drug resistance, colored on the basis of the half maximal inhibitory concentration (IC50, Z score); (L), Box plots showing indicators related to immunotherapy among the three sample-level phenotypes;
Fig. 8
Fig. 8
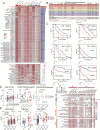
The key NEP100 gene AMIGO2 has potential as a new NEPC marker. (A), Comparison of DEGs in VR-NE vs. EMT-NE (y-axis) with DEGs in VR_O vs. EMT_R (x-axis). NEP100 genes are indicated by filled circles; (B), Box plot showing the expression of AMIGO2 (Z score) among the three sample-level phenotypes (left panel). UMAP plot showing the expression of AMIGO2 in the four subtypes of NE cells (middle panel). Heatmap showing the spatial distribution of AMIGO2 in multiple regions (right panel). (C) Box plots showing the expression of AMIGO2 (normalization) between NEPC and ARPC in 7 bulk transcriptomic cohorts. (D) Heatmap showing the correlation of AMIGO2 with NE- and AR-related genes in 18 bulk transcriptomic cohorts. (E), Representative IHC staining of AR and AMIGO2 in tissues from patients with CSPC, CRPC or NEPC (scale bar in the left panel: 800 μm). Scale bar in the right panel: 200 μm). (F), Expression patterns of AR and AMIGO2 among CSPC, CRPC, and NEPC. Shades of color indicate the intensity scores; (G), Heatmap showing the IHC scores of AR and AMIGO2 among different stages of PCa progression; (H), Scatter plot showing the relationships among the IHC scores of AR and AMIGO2; (I), K‒M survival curves for disease-free survival (DFS) between the high and low AMIGO2 expression groups; (J), Bar plot showing the changes in AMIGO2 expression after AR activation or inhibition in different datasets. The red bars indicate the upregulation of AMIGO2, and the red text indicates activated AR. (K), Bubble heatmap showing the correlation between sensitivity to drugs and the expression of AMIGO2. The dot size indicates the degree of statistical significance, which is colored on the basis of the correlation. Lollipop plot showing the predicted binding energy of the drug molecule to the AMIGO2 protein. 3D structure showing the key interactions and their respective types in the drug with AMIGO2. Cyan indicates hydrogen bonds; white indicates hydrophobic bonds; yellow indicates π-stacking; magenta indicates salt bridges; yellow spheres indicate aromatic ring centers; and magenta spheres represent metal ions.

Similar articles

References

    1. Bray, F. et al. Global cancer statistics 2018: GLOBOCAN estimates of incidence and mortality worldwide for 36 cancers in 185 countries. CA Cancer J. Clin.68(6), 394–424 (2018). - PubMed
    1. Aurilio, G. et al. Androgen receptor signaling pathway in prostate cancer: From genetics to clinical applications. Cells10.3390/cells9122653 (2020). - PMC - PubMed
    1. Desai, K., McManus, J. M. & Sharifi, N. Hormonal therapy for prostate cancer. Endocr. Rev.42(3), 354–373 (2021). - PMC - PubMed
    1. Liu, S., Alabi, B. R., Yin, Q. & Stoyanova, T. Molecular mechanisms underlying the development of neuroendocrine prostate cancer. Semin. Cancer Biol.86(Pt 3), 57–68 (2022). - PubMed
    1. Fei, X. et al. Promising therapy for neuroendocrine prostate cancer: Current status and future directions. Ther. Adv. Med. Oncol.16, 17588359241269676 (2024). - PMC - PubMed

MeSH terms

Substances

LinkOut - more resources