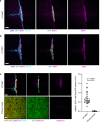
. 2025 May;27(5):863-874.
doi: 10.1038/s41556-025-01660-7. Epub 2025 Apr 22.

Metastatic medulloblastoma remodels the local leptomeningeal microenvironment to promote further metastatic colonization and growth

Affiliations

Metastatic medulloblastoma remodels the local leptomeningeal microenvironment to promote further metastatic colonization and growth

Namal Abeysundara et al. Nat Cell Biol. 2025 May.

Abstract

Leptomeningeal metastases are the major source of morbidity and mortality for patients with medulloblastoma. The biology of the leptomeningeal metastases and the local tumour microenvironment are poorly characterized. Here we show that metastasis-associated meningeal fibroblasts (MB-MAFs) are transcriptionally distinct and signal extensively to tumour cells and the tumour microenvironment. Metastatic cells secrete platelet-derived growth factor (PDGF) ligands into the local microenvironment to chemotactically recruit meningeal fibroblasts. Meningeal fibroblasts are reprogrammed to become MB-MAFs, expressing distinct transcriptomes and secretomes, including bone morphogenetic proteins. Active bone morphogenetic protein signalling and co-implantation of tumour cells with MB-MAFs enhances the colonization of the leptomeninges by medulloblastoma cells and promotes the growth of established metastases. Furthermore, treatment of patient-derived xenograft mice with a PDGF-receptor-α neutralizing antibody enhances overall survival in vivo. Collectively, our results define a targetable intercellular communication cascade in the metastatic niche to treat leptomeningeal disease.


Conflict of interest statement

Competing interests: The authors declare no competing interests.

Figures
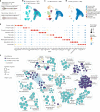
Fig. 1
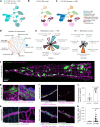
Fig. 1. MB primary and metastatic tumour cells are functionally distinct.
a, A schematic representation of mouse Ptch-SB primary tumour and spinal leptomeninges with metastasis (n = 4 mice) and Ptch-WT non-tumour spinal leptomeninges (n = 3 mice) collected for scRNA-seq. b, UMAP plot of cells from Ptch-SB cerebellar primary tumours with TME denoted as primary (tumour + TME), and spinal leptomeninges with metastasis denoted as LPT-MET (tumour + TME). c,d, UMAP plots of annotated cell populations from LPT-MET (tumour + TME) samples (c) and primary (tumour + TME) samples (d). e, A dot plot with expression across cell types of the top five markers by log fold change (MAST test, log fold change (LFC) >0.25, minimum percent expression >0.1). f, Gene Ontology (GO) terms associated with genes differentially expressed in primary and LPT-MET tumour cells. The circle sizes correspond to the number of differentially expressed genes found in each pathway (Holm FWER <0.05). See Supplementary Table 1 for the full gene list and pathways. ER, endoplasmic reticulum.
Fig. 2
Fig. 2. Distinct microenvironment signalling in the metastatic leptomeninges.
a, UMAP plot of cells from Ptch-WT control leptomeninges denoted as LPT-WT (ME only) and Ptch-SB leptomeninges with metastasis denoted as LPT-MET (tumour + TME). b,c, UMAP plots of annotated cell populations from LPT-WT (ME only) (b) and LPT-MET (tumour + TME) (c). d, Interaction plot of LPT-MET samples (the edge width represents the number of significant ligand–receptor pairs between any two cell populations, and the circle sizes represent the number of cells in each population). e, Detailed pie charts showing the proportion of interactions from the metastatic cells to the TME (left) and from the TME to the metastatic cells (right). f,g, Whole-mount Ptch-SB spinal leptomeninges with metastasis (LPT-MET) fluorescently labelled with GFP+ tumour and CD31+ endothelium (scale bar, 1,500 µm) (f) and GFP+ tumour, CD31+ endothelium and laminin with tumour cells associating with larger meningeal blood vessels (left) and a smaller network of vessels (right) (n = 47 images) (g). h, Representative whole-mount spinal leptomeninges from a Pdgfra-H2BeGFP reporter mouse fluorescently labelled with GFP+ meningeal fibroblasts, collagen IV (ColIV) basement membrane and DAPI. Fibroblasts are found in the extracellular space and surround blood vessels (left). At a higher magnification, fibroblasts are shown to closely associate with blood vessels (right) (n = 15 images). i, Spinal cord cross-sections of Ptch-WT LPT-WT and Ptch-SB LPT-MET fluorescently labelled with collagen I (Col1), PDGFRα+ fibroblasts, GFP+ tumour and DAPI. The left panels show the merge, and the right panels show the GFP and PDGFRα channels (yellow arrows highlight PDGFRα+ GFP fibroblasts). j, The proportion of PDGFRα+ fibroblasts (PDGFRα+ GFP cells) per field of view (n = 10 and n = 12 images for LPT-WT and LPT-MET, respectively). k, Phospho-histone H3 (PH3) and PDGFRα double-positive fibroblasts normalized to PDGFRα volume quantified per field of view (n = 15 and n = 28 images for LPT-WT and LPT-MET, respectively). P values were generated from two-tailed unpaired t-test with Welch’s correction, the centre line represents the mean and error bars represent the standard deviation for j and k. Scale bars, 120 µm (gi). Source data
Fig. 3
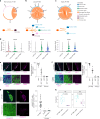
Fig. 3. Meningeal fibroblasts are recruited and undergo proliferation in the presence of tumour cells.
a, Whole-mount spinal leptomeninges from Pdgfra-H2BeGFP/NSG mice implanted with MB813–mCherry and D458–mCherry cells into the lateral ventricle and fluorescently labelled with GFP+ fibroblasts, mCherry (MB813 tumour), Ki67 and DAPI. The proportion of PDGFRα and Ki67 double-positive cells in control (sham injection) and MB813 and D458 (tumour low and high regions) samples was quantified per field of view (n = 10, 8, 13, 9 and 12 images for control, MB813 low, MB813, D458 low and D458, respectively). b, A chord diagram of scRNA-seq data highlighting the signalling pathways from Ptch-SB metastatic tumour cells to the meningeal fibroblasts. c, A schematic representation of the experimental design with D458 cells overexpressing PDGFA and signalling to PDGFRα+ meningeal fibroblasts (far left). Whole-mount spinal leptomeninges fluorescently labelled with GFP+ fibroblasts, BFP+ tumour and Ki67 from Pdgfra-H2BeGFP/NSG mice implanted with D458 cells expressing control BFP and PDGFA-BFP into the lateral ventricle. The total PDGFRα+ cells and proportion of PDGFRα and Ki67 double-positive cells were quantified per field of view (n = 14 and n = 10 images for control BFP and PDGFA-BFP, respectively). d, Quantifications from whole-mount spinal leptomeninges of NSG mice implanted with D458 GFP-Luc control-BFP and D458 GFP-Luc PDGFA-BFP into the lateral ventricle and fluorescently labelled with Ki67. The total number of Ki67+ GFP+ tumour cells was normalized to the total GFP+ tumour volume per field of view (n = 10 images per group). e, Kaplan–Meier survival analysis from NSG mice implanted with D458 GFP-Luc control-BFP (n = 7 mice) and D458 GFP-Luc PDGFA-BFP (n = 7 mice) into the lateral ventricle (log-rank (Mantel–Cox) test was performed). P values were generated from two-tailed unpaired t-test with Welch’s correction, the centre line represents mean and the error bars represent the standard deviation for a, c and d. n.s., not significant (P = 0.3166). Scale bars, 120 µm (a and c). Source data
Fig. 4
Fig. 4. Meningeal fibroblast heterogeneity in the metastatic niche.
a, UMAP plot of meningeal fibroblast recluster from Ptch-WT control leptomeninges (LPT-WT) and Ptch-SB leptomeninges with metastasis (LPT-MET) samples. b, GO terms associated with the genes differentially expressed in meningeal fibroblasts from LPT-WT and LPT-MET samples. The circle sizes correspond to the number of differentially expressed genes found in each pathway (Holm FWER <0.05). See Supplementary Table 2 for the full gene list and pathways. c, UMAP plot of meningeal fibroblast recluster identities (LMF1–LMF7) from LPT-WT and LPT-MET samples. d, Pie charts showing the proportion of LMF1–LMF7 clusters in LPT-WT and LPT-MET samples. e, GO terms enriched in the LPT-MET LMF1 cluster (P values were generated using g:Profiler’s Significance Correction Strategy (gSCS)). f, A dot plot showing the myofibroblastic, inflammatory, antigen-presenting and general CAF signature expression in LMF1–LMF7 clusters.
Fig. 5
Fig. 5. Meningeal fibroblast-derived BMP ligands signal to metastatic tumour cells.
ac, Chord diagram (top) and schematic diagram (bottom) demonstrating the BMP signalling interactions from meningeal fibroblasts to the microenvironment of non-tumour leptomeninges (LPT-WT) (a), low leptomeningeal metastatic burden (low LPT-MET) (b) and high leptomeningeal metastatic burden (high LPT-MET) samples (c), with BMPR1A_R2 denoted as 1A_R2 and BMPR1B_R2 denoted as 1B_R2. d, Violin plots showing Bmp5, Bmp4 and Bmp7 expression in meningeal fibroblasts from LPT-WT, low LPT-MET and high LPT-MET scRNA-seq samples. e,f, Ptch-SB spinal cord with metastasis (LPT-MET) and primary tumour cross-sections fluorescently labelled with GFP, ERTR7, DAPI and BMP4 (e) or BMP7 (f). The proportion of tumour cells (GFP+) and microenvironment cells (GFPDAPI+) close to BMP4-positive signal (n = 14 and n = 15 images for LPT-MET and primary, respectively) (e) and BMP7-positive signal (n = 13 and n = 8 images for LPT-MET and primary, respectively) (f) was quantified per field of view. g, Ptch-SB spinal cord LPT-MET and primary tumour cross-sections fluorescently labelled with GFP, pSMAD1/5 and ERTR7. The pSMAD and GFP double-positive cells normalized to total GFP volume were quantified in LPT-MET samples and primary tumour core and boundary regions per field of view (n = 37, 10 and 9 images for LPT-MET, core and boundary, respectively). P values were generated using two-tailed unpaired t-test with Welch’s correction, the centre line represents the mean and error bars represent the standard deviation, *P < 0.0001. Scale bars, 120 µm (eg). h, Box plots showing Id1 and Id2 mean expression per sample in primary tumour (n = 4 mice) and LPT-MET tumour cells (n = 4 mice) from the scRNA-seq data. The centre line represents the median (50% percentile), the hinges represent 25% and 75% percentiles, and the whiskers represent the 1.5 interquartile range. P values were generated using a two-tailed Student’s t-test. Source data
Fig. 6
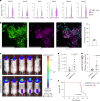
Fig. 6. Enhanced cell cycle progression and leptomeningeal colonization in metastatic tumour cells with active BMP signalling.
a, Violin plots showing cell cycle progression gene expression in Id1 and Id1+ LPT-MET tumour cells from the scRNA-seq data. Two-tailed Student’s t-test was performed. *P < 2.22 × 10−16. b, Whole-mount Ptch-SB spinal leptomeninges with metastasis fluorescently labelled with GFP, ID1 and Ki67 with the proportion of ID1 and Ki67 double-positive cells quantified per field of view (n = 5 images; the centre line represents the mean, and error bars represent the standard deviation; scale bars, 120 µm). c, BLI 38 days after NSG mice were implanted with D458 Luc-ZsGreen tumour cells expressing control and BMPR1A-CA into the lateral ventricle (cohort of n = 5 mice per group are shown). d, Total flux (photons s−1) quantifications of D458 Luc-ZsGreen control and BMPR1A-CA (n = 10 mice per group). e, The proportion of GFP-positive area on the surface of the brain, spinal cord and peripheral nerves of D458 Luc-ZsGreen control and BMPR1A-CA (n = 10 mice per group). P values were generated using two-tailed unpaired t-test with Welch’s correction, the centre line represents the mean, and error bars represent the standard deviation for d and e. f, Kaplan–Meier survival analysis from NSG mice implanted with D458 Luc-ZsGreen control (n = 9 mice) and BMPR1A-CA (n = 10 mice) into the lateral ventricle (log-rank (Mantel–Cox) test was performed). Source data
Fig. 7
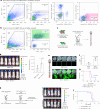
Fig. 7. Metastasis-associated fibroblasts support leptomeningeal colonization.
a,b, FACS plots demonstrating the gating strategy used to sort live GFP/CD45/CD146/CD31/PDGFRA+ fibroblasts from the spinal leptomeninges (a) and live GFP+ tumour cells from the primary tumour of NSG mice with cerebellar implantation of MB411 GFPLuc (b). The proportions of cells within the indicated gates are shown. See also Supplementary Data 1 for the full gating strategy. c, A schematic representation of the co-implantation experiments into the leptomeninges of NSG mice. d, BLI and total flux (photons s−1) quantifications 8 weeks after NSG mice were implanted with MB411 GFPLuc alone and MB411 GFPLuc co-implanted with metastasis-associated fibroblasts (MB411 + MB-MAFs) isolated by FACS (n = 5 mice per group). e, Stereomicroscope images of dissected peripheral nerves (highlighted in schematic with dashed red box) from NSG mice implanted with MB411 alone and MB411 + MB-MAFs (scale bars, 1 mm). f, The proportion of GFP-positive area on the surface of the brain, spinal cord and peripheral nerves of NSG mice implanted with MB411 alone and MB411 + MB-MAFs into the lateral ventricle (n = 5 mice per group). P values were generated using two-tailed unpaired t-test with Welch’s correction; the centre line represents the mean, and error bars represent the standard deviation for d and f. g, Kaplan–Meier survival analysis from NSG mice implanted with MB411 alone and MB411 + MB-MAFs into the lateral ventricle (n = 3 mice per group). h, A schematic representation of the anti-PDGFRα treatment experiments. i, BLI 19 days after treatment of NSG mice implanted with D458 Luc-ZsGreen into the lateral ventricle with either IgG control or anti-PDGFRα neutralizing antibody administered into the lateral ventricle (cohort of n = 5 mice per group are shown). The dashed magenta box highlights spinal colonization. j, Kaplan–Meier survival analysis from NSG mice implanted with D458 Luc-ZsGreen and treated with either IgG control (n = 10 mice) or anti-PDGFRα neutralizing antibody (n = 9 mice). P values were generated using log-rank (Mantel–Cox) test for survival analyses in g and j. Source data
Extended Data Fig. 1
Extended Data Fig. 1. Differentially expressed genes and pathways in primary and metastatic tumour cells.
a,b, Dot plots showing the differentially expressed genes of select pathways enriched in primary tumour (a) and leptomeningeal metastatic (LPT-MET) tumour (b) cells. P values were generated using a ranked hypergeometric test and corrected using the Holm-Bonferroni method of family-wise error rate (FWER). See Supplementary Table 1 for full gene list and pathways.
Extended Data Fig. 2
Extended Data Fig. 2. Distinct intercellular signalling patterns within the primary tumour and metastatic niche.
a,b, Plots are showing the cell populations from the primary tumour + TME (a) and LPT-MET + TME (b) scRNA-seq data with corresponding incoming interaction strength (y-axis) and outgoing interaction strength (x-axis) using CellChat. The interaction strength represents the total communication probability associated with each population and the count represents the number of inferred interactions.
Extended Data Fig. 3
Extended Data Fig. 3. Meningeal fibroblasts as a major source of intercellular signalling.
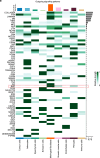
a, Heatmap showing the relative strength of outgoing signalling pathways from cell populations in the metastatic spinal leptomeninges using CellChat. BMP signalling is highlighted (red dashed box) as a pathway of significance to this study.
Extended Data Fig. 4
Extended Data Fig. 4. Meningeal fibroblast and oligodendrocyte precursor cell markers.
UMAP plots showing meningeal fibroblast markers Pdgfra (a), Col1a1 (b), Dcn (c), and Lum (d), and OPC markers, Olig1 (e) and Olig2 (f), expression in LPT-WT and LPT-MET scRNA-seq datasets.
Extended Data Fig. 5
Extended Data Fig. 5. Select pathways and differentially expressed genes in LPT-MET fibroblasts.
Dot plots showing the differentially expressed genes associated with growth factor signalling (a), ECM organization and adhesion (b), immune and vasculature regulation (c), and cell death, differentiation, and proliferation (d) pathways in LPT-MET and LPT-WT meningeal fibroblasts. P values were generated using a ranked hypergeometric test and corrected using the Holm-Bonferroni method of family-wise error rate (FWER). See Supplementary Table 2 for full gene list and pathways.
Extended Data Fig. 6
Extended Data Fig. 6. Meningeal fibroblast cluster markers and proportions.
a, Dot plot showing the top five differentially expressed genes by Log Fold Change (MAST test, LFC >0.25, minimum percent expression >0.1) in meningeal fibroblasts from LPT-WT and LPT-MET samples. b, Box plots showing the LMF1-LMF7 mean cluster fractions per sample from LPT-WT (n = 3 mice) and LPT-MET (n = 4 mice) scRNA-seq data. Center line represents median (50% percentile), hinges represent the 25% and 75% percentile, and whiskers represent the 1.5 interquartile range. P values were generated using two-tailed Student’s t-test. Source data
Extended Data Fig. 7
Extended Data Fig. 7. Meningeal fibroblast cluster changes across metastatic leptomeningeal burden.
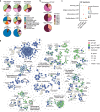
a, Pie charts showing the proportion of cell populations within the leptomeningeal samples of non-tumour bearing Ptch-WT mice (non-tumour LPT-WT1, 2, 3) and Ptch-SB mice with low metastatic burden (Low LPT-MET1, 2), and higher metastatic burden (High LPT-MET1, 2). b, Pie charts showing the proportion of LMF1-LMF7 clusters within the meningeal fibroblasts associated with non-tumour LPT-WT, low LPT-MET, and high LPT-MET samples. c, Dot plot showing the Myofibroblastic, Inflammatory, Antigen presenting and General CAF signature expression in the meningeal fibroblasts associated with LPT-WT, low LPT-MET, and high LPT-MET samples. d, GO terms associated with the genes differentially expressed in the meningeal fibroblasts associated with LPT-WT, low LPT-MET, and high LPT-MET samples. The circle sizes correspond to the number of differentially expressed genes found in each pathway (Holm family-wise error rate (FWER) < 0.05). See Supplementary Table 3 for full gene list and pathways.
Extended Data Fig. 8
Extended Data Fig. 8. Incoming signalling patterns in the metastatic leptomeninges.
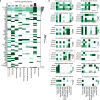
a, Heatmap showing the relative strength of incoming signalling pathways to cell populations in the LPT-MET samples using CellChat. The tumour-specific incoming signalling pattern column is outlined in the red dashed box. b, Heatmaps showing the relative importance of each cell group based on the computed four network centrality measures of select tumour-specific incoming signalling networks using CellChat. The BMP signalling network is highlighted in the red dashed box.
Extended Data Fig. 9
Extended Data Fig. 9. BMP signalling in the SmoA1/Nestin-SB100/T2Onc2/Math1-GFP mouse model.
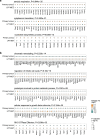
a,b, Spinal cord cross-sections fluorescently labelled with GFP+ tumour, ERTR7, DAPI, and BMP4 (n = 18 images) (a) or BMP7 (n = 19 images) (b). c, Spinal cord and primary tumour cross-sections fluorescently labelled with GFP, pSMAD1/5, ERTR7, and DAPI. The pSMAD- and GFP-double positive cells normalized to total GFP volume was quantified in LPT-MET and primary tumour samples per field of view (n = 15 and n = 24 images for Primary tumour and LPT-MET, respectively). P value was generated using two-tailed unpaired t-test with Welch’s correction, center line represents mean, and error bars represent standard deviation. Scale bars, 50 µm. Source data
Extended Data Fig. 10
Extended Data Fig. 10. Schematic summary of the normal and metastatic leptomeningeal niche.
In the normal leptomeninges, meningeal fibroblasts are present and associate with meningeal blood vessels. In the presence of medulloblastoma (MB) metastatic tumour cells, secreted platelet-derived growth factor (PDGFA) ligands in the local microenvironment chemotactically recruit meningeal fibroblasts. Meningeal fibroblasts are reprogrammed to become MB-MAFs, expressing distinct transcriptomes and secretomes, including bone morphogenetic proteins 4 and 7 (BMP4/7). Active BMP and PDGF signalling further enhance both the colonization of the leptomeninges by MB cells as well as promoting the growth of established metastases.

References

    1. Gibson, P. et al. Subtypes of medulloblastoma have distinct developmental origins. Nature468, 1095–1099 (2010). - PMC - PubMed
    1. Vladoiu, M. C. et al. Childhood cerebellar tumours mirror conserved fetal transcriptional programs. Nature572, 67–73 (2019). - PMC - PubMed
    1. Hovestadt, V. et al. Resolving medulloblastoma cellular architecture by single-cell genomics. Nature572, 74–79 (2019). - PMC - PubMed
    1. Hendrikse, L. D. et al. Failure of human rhombic lip differentiation underlies medulloblastoma formation. Nature609, 1021–1028 (2022). - PMC - PubMed
    1. Smith, K. S. et al. Unified rhombic lip origins of group 3 and group 4 medulloblastoma. Nature609, 1012–1020 (2022). - PMC - PubMed

MeSH terms

Substances

LinkOut - more resources