. 2025 Jun;44(11):3085-3120.
doi: 10.1038/s44318-025-00440-1. Epub 2025 Apr 22.

SDCBP/Syntenin-1 stabilizes BACH1 by disassembling the SCFFBXO22-BACH1 complex in triple-negative breast cancer

Affiliations

SDCBP/Syntenin-1 stabilizes BACH1 by disassembling the SCFFBXO22-BACH1 complex in triple-negative breast cancer

Phi-Long Tran et al. EMBO J. 2025 Jun.

Abstract

BACH1 is a redox-sensitive transcription factor facilitating tumor progression in triple-negative breast cancer (TNBC). However, the molecular mechanisms regulating BACH1 function in TNBC remain unclear. In this study, we demonstrate that SDCBP, a tandem-PDZ-domain protein, stabilizes BACH1 by disassembling the Skp1-Cullin1-FBXO22 (SCFFBXO22)-BACH1 complex via a heme/heme-oxygenase-1-independent manner in TNBC cells. Our data revealed that SDCBP and BACH1 expression show a significant positive correlation in TNBC cells and TNBC patients tumor tissues. Mechanistically, SDCBP via its PDZ1 domain disassembles the SCFFBXO22-BACH1 complex via its PDZ1 domain, thereby preventing BACH1 K48-linked polyubiquitination and proteasomal degradation. Knocking down SDCBP induces BACH1 degradation and downregulates expressions of BACH1-induced metastatic genes, thereby suppressing tumor progression in mice bearing TNBC tumors. Moreover, depleting SDCBP leads to upregulation of BACH1-repressed electron transport chain (ETC) genes, such as NDUFA4 and COX6B2, and increases mitochondrial activity, enhancing anti-tumor efficacy of metformin against TNBC both in vitro and in vivo. These data demonstrate a novel alternative mechanism for BACH1 stabilization mediated by SDCBP, implicating the SDCBP-BACH1 axis as a potential target for enhancing ETC inhibitor efficacy in TNBC combinational therapy.

Keywords: BACH1; Metformin; SDCBP; Triple-negative Breast Cancer; Ubiquitin E3 Ligase SCFFBXO22.


Conflict of interest statement

Disclosure and competing interests statement. The authors declare no competing interests.

Figures

Figure 1
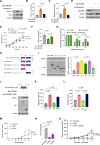
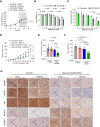
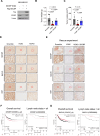
Figure 1. SDCBP and BACH1 protein are co-expressed and SDCBP increases BACH1 protein levels in TNBC cells.
(A) Immunohistochemistry staining against the SDCBP and BACH1 protein in human TNBC-derived tissue microarray sections (n = 78). Representative images showing the co-expression of SDCBP and BACH1 in the same section. Normal breast cancer tissues were considered as the negative control. Scale bar = 20 µm. (B) Pearson correlation coefficient (r = 0.5772, P < 0.0001) between SDCBP and BACH1 expression in (A). (C) Western blot showing BACH1 and HO-1 protein expression in Hs578T cells transfected with control vector or Myc-SDCBP-expressing vector. (D) Real-time qPCR showing BACH1 mRNA expression in Hs578T cells transfected with a control vector or a Myc-SDCBP-expressing vector (n = 3). (E) Real-time qPCR showing the mRNA expression of BACH1-regulated antioxidant genes (HMOX1 and NQO1) and BACH1-regulated metastatic genes (HK2, MMP1, and CXCR4) in Hs578T cells transfected with control vector or Myc-SDCBP-expressing vector (n = 3). (F) Western blot showing BACH1 protein expression in MDA-MB-231 infected with lentiviral scramble or SDCBP shRNA. (G) Real-time qPCR showing BACH1 mRNA expression in MDA-MB-231 infected with lentiviral scramble or SDCBP shRNA (n = 3). (H) Left, Representative images of immunofluorescence staining to visualize SDCBP (green color) and BACH1 (red color) expression in MDA-MB-231 cells transfected with a scramble siRNA or SDCBP siRNA. DAPI (blue color) was used to stain the nucleus (n = 3); Scale bar = 50 µm. Right, fluorescence levels of SDCBP and BACH1 were quantified based on their spectral densities. (I) Real-time qPCR showing the mRNA expression of BACH1-regulated antioxidant genes (HMOX1 and NQO1) and BACH1-regulated metastatic genes (HK2, MMP1, MMP13, and CXCR4) in MDA-MB-231 cells transfected with scramble siRNA or SDCBP siRNA (n = 3). (J) Western blot showing SDCBP and BACH1 protein expression in scramble control and two SDCBP-KO MDA-MB-231 clones (KO#2, KO#12) generated using CRISPR-Cas9 system (n = 3). (K) Real-time qPCR showing the mRNA expression of BACH1-regulated metastatic genes (HK2, MMP1, CXCR4, GAPDH, and VEGF) in scramble control and SDCBP-KO MDA-MB-231 cells. (L) The reconstitution of SDCBP recovers BACH1 protein expression in SDCBP-KO MDA-MB-231 cells. Western blot showing BACH1 protein expression in scramble control and SDCBP-KO MDA-MB-231 cells transfected with control vector or Myc-SDCBP-expressing vector. The arrows indicate the endogenous (Endo) and exogenous (Exo) SDCBP. Data are expressed as the mean ± SEM and analyzed using two-tailed Student’s t test with Welch’s correction (D, E, G, I), two-way ANOVA (H), or one-way ANOVA (K). P values less than 0.05 were considered statistically significant. All experiments were repeated at least three times unless otherwise indicated. Source data are available online for this figure.
Figure 2
Figure 2. SDCBP promotes tumor progression by upregulating BACH1 protein via its PDZ1 domain in TNBC cells.
(A) Western blot showing BACH1 protein expression in Hs578T cells transfected with Myc-SDCBP-expressing vector with or without BACH1 siRNA. (B) Colony formation of Hs578T cells transfected with Myc-SDCBP-expressing vector with or without BACH1 siRNA (n = 3); See also Fig. EV2A. (C) Migration of Hs578T cells transfected with Myc-SDCBP-expressing vector with or without BACH1 siRNA (n = 3); See also Fig. EV2B. (D) Western blot showing SDCBP and Flag-BACH1 protein expression in MDA-MB-231 cells transfected with SDCBP siRNA with or without a Flag-BACH1-expressing vector. (E) Cell proliferation of MDA-MB-231 cells transfected with SDCBP siRNA with or without Flag-BACH1-expressing vector (n = 3). (F) Colony formation of MDA-MB-231 cells transfected with SDCBP siRNA with or without Flag-BACH1-expressing vector (n = 3); See also Fig. EV2C. (G) Wound closure of scratched MDA-MB-231 cells transfected with SDCBP siRNA with or without a Flag-BACH1-expressing vector (n = 3); See also Fig. EV2D. (H) Schematic of various SDCBP mutant constructs generated using the Myc-SDCBP plasmid. (I) Left, western blot showing BACH1 protein expression in Hs578T cells transfected with the indicted SDCBP constructs. Right, quantification of BACH1 levels using densitometry (n = 3). (J) Top, schematic of the PDZ1 construct. Bottom, western blot showing BACH1 protein expression in Hs578T cells transfected with Myc-SDCBP or Myc-SDCBP_PDZ1 plasmid. (K) Migration of Hs578T cells transfected with Myc-SDCBP, Myc-SDCBP_Δ4, or Myc-SDCBP_PDZ1 plasmid (n = 3); See also Fig. EV2H. (L) Colony formation of Hs578T cells transfected with Myc-SDCBP, Myc-SDCBP_Δ4, or Myc-SDCBP_PDZ1 plasmid (n = 3); See also Fig. EV2I. (M) Tumor volumes from athymic BALB/c nude mice 6 weeks after mammary fat-pad injection of the scramble control or SDCBP-KO MDA-MB-231 cells (1 × 10⁵ cells/mouse; n = 5 or 7 mice/group). (N) Tumor weights in Fig. 2M (n = 7 mice/group); See also Fig. EV3D. (O) Tumor volumes from athymic BALB/c nude mice 25 days after mammary fat-pad injection of the scramble control, SDCBP-KO MDA-MB-231 cells, and SDCBP-KO MDA-MB-231 cells stably transfected with Flag-SDCBP (1 × 10⁵ cells/mouse; n = 5 mice/group); See also Fig. EV3A–C,E. Data are expressed as the mean ± SEM and analyzed using one-way ANOVA (B, C, I, K, L, N), two-tailed Student’s t test (E, F, O), or two-way ANOVA (G, M). P values less than 0.05 were considered statistically significant. All experiments were repeated at least three times unless otherwise indicated. Source data are available online for this figure.
Figure 3
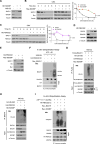
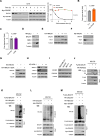
Figure 3. SDCBP stabilizes BACH1 by inhibiting SCFFBXO22-mediated K48-linked polyubiquitination in a heme/HO-1-independent manner.
(A) Western blot showing BACH1 protein expression in MDA-MB-231 cells transfected with SDCBP siRNA with or without MG132 proteasome inhibitor. (B) Left, western blot showing BACH1 protein expression in Hs578T cells transfected with control vector or Myc-SDCBP-expressing vector in the presence of CHX protein synthesis inhibitor at various time points. Right, quantification of BACH1 protein levels using densitometry (n = 3). (C) Left, western blot showing BACH1 protein expression in MDA-MB-231 cells transfected with scramble or FBXO22 siRNA in the presence of CHX protein synthesis inhibitor at various time points. Right, quantification of BACH1 protein levels using densitometry (n = 3). (D) Western blot showing BACH1, FBXO22, and SDCBP protein expression in MDA-MB-231 cells transfected with scramble or FBXO22 siRNA. (E) Western blot showing BACH1 protein expression in MDA-MB-231 cells transfected with HA-FBXO22-expressiong vector with or without Myc-SDCBP-expressing vector. (F) In vitro ubiquitylation assay of the recombinant human BACH1 protein mediated by the FBXO22 complex. Active recombinant human UbcH5a protein was used as the E2 ubiquitin-conjugating enzyme for FBXO22 complex-mediated BACH1 degradative polyubiquitylation. (G) In vivo ubiquitylation assay showing the decrease in the K48-linked polyubiquitylation of BACH1 by SDCBP overexpression in HEK293 cells transfected with the indicated plasmids. (H) In vivo ubiquitylation assay showing the increase in the K48-linked polyubiquitylation of BACH1 by SDCBP KD in MDA-MB-231 cells transfected with the indicated plasmids. (I) In vitro ubiquitylation assay showing the inhibitory effect of SDCBP on the polyubiquitylation of BACH1 mediated by the FBXO22 complex. Active recombinant human protein UbcH5a and immunocomplex FBXO22 were added as described above. Recombinant human BACH1 and recombinant human SDCBP proteins were added at ratios of 1:1 (+) and 1:2 (++). Data are expressed as the mean ± SEM and analyzed using two-tailed Student’s t test with Welch’s correction (B, C). P values less than 0.05 were considered statistically significant. All experiments were repeated at least three times unless otherwise indicated. Source data are available online for this figure.
Figure 4
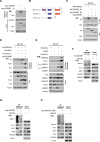
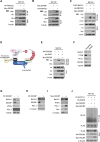
Figure 4. SDCBP PDZ1 domain plays an essential role in the disruption of SCFFBXO22-BACH1 complex.
(A) Crosslink immunoprecipitation showing an interaction of FBXO22 with SDCBP in Hs578T cells transfected with Myc-SDCBP-expressing vector or Myc-SDCBP_Δ4-expressing vector. (B) Schematic showing the FBXO22 mutant constructs generated using the HA-FBXO22 plasmid. (C) Immunoprecipitation showing SDCBP interactions with FBXO22 and its mutant constructs in HEK293 cells transfected with the indicated plasmids. ns indicates non-specific bands. See also Fig. EV5A,B. (D) His-Pulldown assay showing the effect of SDCBP on SKP1-CUL1-FBXO22 complex formation after the indicated transfections in HEK293 cells. See also Appendix Fig. S1B. (E) His-Pulldown assay showing the effect of SDCBP KO on the SCFFBXO22–BACH1 complex formation in the scramble control and SDCBP-KO MDA-MB-231 cells transfected with control vector or His-SKP1-expressing vector. See also Appendix Fig. S1C. (F) Immunoprecipitation showing the effect of SDCBP KD on the SCFFBXO22–BACH1 complex formation in MDA-MB-231 cells transfected with scramble or SDCBP siRNA. (G) Immunoprecipitation showing the effect of SDCBP overexpression on the SCFFBXO22–BACH1 complex formation in Hs578T cells transfected with control vector or Myc-SDCBP-overexpressing vector. (H) Immunoprecipitation showing the effect of SDCBP PDZ1 domain on the SCFFBXO22–BACH1 complex formation in Hs578T cells transfected with a control vector or a Myc-SDCBP-PDZ1-overexpressing vector. Source data are available online for this figure.
Figure 5
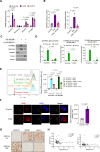
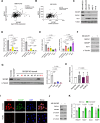
Figure 5. SDCBP-BACH1 axis regulates the expression of ETC genes NDUFA4 and COX6B2, and mitochondrial activity in TNBC cells.
(A) Real-time qPCR showing the mRNA expression of BACH1-regulated ETC genes (NDUFA4, NDUFA4L2, NDUFC2, and COX6B2) in scramble and SDCBP-KO MDA-MB-231 cells (n = 3); See also Appendix Fig. S2A,B. (B) Real-time qPCR showing the mRNA expression of NDUFA4 and COX6B2 in scramble, SDCBP-KO MDA-MB-231 cells, and SDCBP-KO MDA-MB-231 cells transfected with SDCBP (n = 3). (C) Western blots showing the expression of mitochondrial proteins NDUFA4 and COX6B2 in MDA-MB-231 cells transfected with SDCBP siRNA in the presence or absence of FLAG-BACH1-expressing vector. (D) ChIP-qPCR showing BACH1 enrichments in the promoter regions of NDUFA4 and COX6B2 in the scramble and SDCBP-KO MDA-MB-231 cells. Quantitative data were normalized to IgG binding expression (n = 3); See also Appendix Fig. S2C. (E) Left, flow cytometry histogram showing the mitochondrial membrane potentials using TMRE (tetramethylrhodamine ethyl ester) staining in MDA-MB-231 cells transfected with a scramble or SDCBP siRNA after the indicated treatments. FCCP (trifluoromethoxy carbonylcyanide phenylhydrazone). Right, quantification of TMRE fluorescence intensity (n = 3). (F) Left, immunofluorescence staining and confocal imaging of the fluorescent signals for TMRE (orange-red color) in the scramble control and SDCBP-KO MDA-MB-231 cells after incubation with TMRE. DAPI (blue color) was used to stain the nucleus (n = 7); Representative confocal images are shown; scale bars = 20 µm and 5 µm. Right, fluorescent levels of the TMRE were quantified based on their spectral densities. (G) Representative images of immunohistochemistry staining against the NDUFA4, BACH1, and SDCBP proteins showing a negative correlation between the expression of NDUFA4 and SDCBP in the same sections of TNBC tumor tissues. Scale bar = 20 µm. (H) Pearson correlation coefficients between SDCBP and NDUFA4 protein expression (n = 64), and between BACH1 and NDUFA4 protein expression (n = 60) in Fig. 5G. Data are expressed as the mean ± SEM and analyzed using two-way ANOVA (A, D, F), two-tailed Student’s t test (B), or one-way ANOVA (E). P values less than 0.05 were considered statistically significant. All experiments were repeated at least three times unless otherwise indicated. Source data are available online for this figure.
Figure 6
Figure 6. Targeting of SDCBP enhances the anti-cancer effects of ETC inhibitors and increases the anti-tumor activity of metformin in a mouse 4T1 breast cancer model.
(A) Cell proliferation of MDA-MB-231 cells transfected with a scramble or SDCBP siRNA after treatment with metformin for the indicated periods of time (n = 3). (B) Cell viability of MDA-MB-231 cells transfected with a scramble or SDCBP siRNA after treatment with the indicated concentrations of metformin for 96 h (n = 5). (C) Colony formation for MDA-MB-231 cells transfected with a scramble or SDCBP siRNA after treatment with the indicated concentrations of metformin. Colony numbers were counted and converted to percentages by normalizing with the control groups (n = 3). (DF) Effect of the indicated treatment on 4T1 tumor growth. Tumor growth was monitored in BALB/c mice bearing 4T1 cells after mammary fat-pad injections. When the average tumor volumes reached 100 mm3, the mice (n = 7 mice/group) were administered with 100 mg/kg metformin (once a day) and/or adenoviral SDCBP shRNA (1 × 10⁹ PFU/mice). Black arrows indicate the day of adenoviral SDCBP shRNA injection. Final tumor volume (E) and weight (F) are shown. (G) Immunohistochemistry staining against SDCBP, BACH1, Ki67, NDUFA4, and COX6B2 protein in 4T1 tumors from BALB/c mice in Fig. 6A. Representative images of the IHC staining are shown. Scale bar = 50 µm for low (left) and high (right) magnification. Data are expressed as the mean ± SEM and analyzed using two-way ANOVA (AC), one-way ANOVA (E), or two-tailed Student’s t test (F). P values less than 0.05 were considered statistically significant. All experiments were repeated at least three times unless otherwise indicated. Source data are available online for this figure.
Figure 7
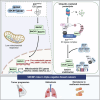
Figure 7. Schematic summary of this study.
Schematic showing the novel oncogenic roles of SDCBP in promoting aggressiveness and mitochondrial inhibitor resistance in TNBCs. An abundance of SDCBP stabilizes the BACH1 protein by blocking E3 ubiquitin ligase SCFFBXO22 complex-targeted BACH1 for degradative ubiquitination. Mechanistically, SDCBP binds to different members of the SCFFBXO22 complex, including SKP1 and FBXO22, via its PDZ1 domain and induces SCFFBXO22 complex disassociation, suggesting that SDCBP is a key adapter regulating the activity of the E3 ubiquitin ligase SCFFBXO22 complex in the proteasomal pathway. SDCBP-induced BACH1 accumulation upregulates several pro-metastatic genes and downregulates numerous mitochondrial ETC genes, resulting in tumor progression and high resistance to metformin treatment in TNBCs. Targeting SDCBP switches the SCFFBXO22 complex to degrade BACH1 protein via the proteasome, reducing tumor aggressiveness and boosting the anti-tumor effect of metformin administration in TNBCs. Source data are available online for this figure.
Figure EV1
Figure EV1. SDCBP regulates the expression of the BACH1 protein and its target genes in TNBC cells.
(A) TCGA data analysis showing the correlation between SDCBP mRNA and BACH1 mRNA expression in GSE142102 (n = 226) dataset of TNBC patients (Pearson correlation coefficient r = 0.3245, P < 0.0001). (B) TCGA data analysis showing the correlation between SDCBP mRNA and BACH1 mRNA expression in GSE103091 (n = 238) dataset of TNBC patients (Pearson correlation coefficient r = 0.2120, P < 0.001). (C) Western blot showing SDCBP, BACH1, and HO-1 protein expression in MDA-MB-231, MDA-MB-468, Hs578T, MCF-7, and T47D cells. (D) The expression levels of SDCBP and BACH1 protein in Fig. EV1C were quantified using densitometry and normalized to the housekeeping protein α-tubulin (n = 3). (E) Real-time qPCR showing SDCBP and BACH1 mRNA expression in MDA-MB-231, MDA-MB-468, Hs578T, MCF-7, and T47D cells (n = 3). Quantitative data were normalized to β-actin expression. (F) Western blot showing SDCBP and HO-1 protein expression in MDA-MB-231 cells transfected with scramble or BACH1 siRNA. (G) Left, western blot showing the protein expression of SDCBP in the scramble and in several SDCBP-KO MDA-MB-231 subclones generated using CRISPR-Cas9 system; Right, real-time qPCR showing the SDCBP mRNA expression in scramble and in SDCBP-KO MDA-MB-231 subclones (n = 3). (H) Real-time qPCR showing the mRNA expression of BACH1 in MDA-MB-231 cells, in scramble and in SDCBP-KO MDA-MB-231 subclone#2 and subclone#12 (n = 3). (I) Immunofluorescence staining was used to visualize SDCBP (green color) and BACH1 (red color) in scramble and in SDCBP-KO MDA-MB-231 cells. DAPI (blue color) was used to stain the nucleus (n = 3); Representative confocal immunofluorescence images are shown. Scale bar = 20 µm. (J) Western blot showing BACH1 and HO-1 protein expression in 4T1 cells infected with scramble or adenoviral SDCBP shRNA. (K) Real-time qPCR showing the mRNA expression of BACH1-regulated antioxidant genes (HMOX1, NQO1, and GLCL) in 4T1 cells transfected with scramble or SDCBP siRNA (n = 3); mRNA expression of KEAP1 was the negative control. Data are expressed as the mean ± SEM and analyzed using one-way ANOVA (D, E, G, H) or two-way ANOVA (K). P values less than 0.05 were considered statistically significant. All experiments were repeated at least three times unless otherwise indicated.
Figure EV2
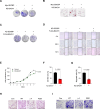
Figure EV2. SDCBP promotes tumor progression by upregulating BACH1 in TNBC cells.
(A) Representative images of colony formation in Fig. 2B. (B) Representative images of the migrated cells in Fig. 2C. Scale bar = 200 µm. (C) Representative images of colony formation in Fig. 2F. (D) Representative images of wounding migration in Fig. 2G. Scale bar = 200 µm. (E) Cell proliferation of MDA-MB-231 cells transfected with scramble or BACH1 siRNA. Cell proliferation was estimated by an automatic cell counter at the indicated time points (n = 3). (F) Colony formation of MDA-MB-231 cells transfected with scramble or BACH1 siRNA. The clonogenic ability was assessed and quantified based on the absorbance at 600 nm and normalized to the control (n = 3). (G) Migration of MDA-MB-231 cells transfected with scramble or BACH1 siRNA. The number of migrated cells were counted and expressed as percentages (n = 3). (H) Representative images of the migrated cells in Fig. 2K. Scale bar = 500 µm. (I) Representative images of colony formation in Fig. 2L. Scale bar = 1000 µm. Data are expressed as the mean ± SEM and analyzed using two-tailed Student’s t test with Welch’s correction (EG). P values less than 0.05 were considered statistically significant. All experiments were repeated at least three times unless otherwise indicated.
Figure EV3
Figure EV3. SDCBP promotes tumor growth by upregulating BACH1 and is associated with the survival of TNBC patients.
(A) Western blot showing the expression of SDCBP and Flag-SDCBP in Fig. 2O. (B) Tumor weights in Fig. 2O (n = 5 mice/group). (C) Tumor volume in Fig. 2O (n = 5 mice/group). (D) Representative images of immunohistochemistry staining against SDCBP, BACH1, and Ki67 protein for xenografted tumors isolated from athymic BALB/c nude mice 6 weeks after mammary fat-pad injection of the scramble control or SDCBP-KO MDA-MB-231 cells (1 × 10⁵ cells/mouse; n = 7 mice/group). Representative images of IHC staining are shown. Scale bar = 200 µm (upper) and 50 µm (lower), respectively. (E) Representative images of immunohistochemistry staining against SDCBP, BACH1, and Ki67 protein for xenografted tumors isolated from athymic BALB/c nude mice 25 days after mammary fat-pad injection of the scramble control, SDCBP-KO MDA-MB-231 cells, or SDCBP-KO MDA-MB-231 cells stably transfected with Flag-SDCBP (1 × 10⁵ cells/mouse; n = 5 mice/group). Scale bar = 200 µm (upper) and 50 µm (lower), respectively. (F) TCGA data analysis showing association between SDCBP mRNA expression and overall survival (n = 392) and lymph node status (n = 98) of TNBC patients. (G) TCGA data analysis showing association between BACH1 mRNA expression and overall survival (n = 2032) and lymph node status (n = 98) of TNBC patients. Data are expressed as the mean ± SEM and analyzed using two-way ANOVA (B) or two-tailed Student’s t test (C). P values less than 0.05 were considered statistically significant. All experiments were repeated at least three times unless otherwise indicated.
Figure EV4
Figure EV4. SDCBP induces BACH1 stability by impairing FBXO22-mediated BACH1 polyubiquitination via an alternative Heme/HO-1-independent mechanism.
(A) Left, Western blot showing BACH1 protein expression in MDA-MB-231 cells transfected with control vector or Myc-SDCBP-expressing vector in the presence of CHX protein synthesis inhibitor at various time points. Right, quantification of BACH1 protein levels using densitometry (n = 3). (B) Free heme level in Hs578T cells transfected with control vector or Myc-SDCBP-expressing vector (n = 3). (C) Free heme level in scramble and in SDCBP-KO MDA-MB-231 cells (n = 3). (D) Western blot showing BACH1 protein expression in MDA-MB-231 cells transfected with control vector or NRF2 (encoded by NFE2L2)-expressing vector. HO-1 protein expression was considered as the positive control. (E) Western blot showing BACH1 protein expression in MDA-MB-231 cells transfected with a control or a HO-1 (encoded by HMOX1)-expressing vector. (F) Western blot showing BACH1 protein expression in Hs578T cells transfected with scramble or HO-1 siRNA. (G) Western blot showing BACH1 protein expression in MDA-MB-231 cells transfected with the HO-1 or the catalytic inactive HO-1 mutant (H25A) plasmid. (H) Western blot showing BACH1 and SDCBP protein expression in MDA-MB-231 cells transfected with scramble or HOIL1 siRNA. (I) Western blot showing endogenous FBXO22 protein expression in several breast cancer cells. (J) Immunoprecipitation showing the interaction of BACH1 with FBXO22 in HEK293 cells transfected with the indicated plasmids. An arrow indicates the specific signal for HA-FBXO22. ns: none specific. (K) In vivo ubiquitylation assay showing the increase in the polyubiquitylation of BACH1 by FBXO22 overexpression in HEK293 cells transfected with the indicated plasmids. (L) In vivo ubiquitylation assay showing the increase in the polyubiquitylation of BACH1 by FBXO22 overexpression in MDA-MB-231 cells transfected with the indicated plasmids. (M) In vivo ubiquitylation assay showing the decrease in FBXO22-mediated polyubiquitylation of BACH1 by SDCBP overexpression in HEK293 cells transfected with the indicated plasmids. Data are expressed as the mean ± SEM and analyzed using two-tailed Student’s t test with Welch’s correction (AC). All experiments were repeated at least three times unless otherwise indicated. P values less than 0.05 were considered statistically significant.
Figure EV5
Figure EV5. SDCBP associates with FBXO22 and impairs SCFFBXO22-targeted substrates for K48-linked degradative ubiquitination.
(A) Immunoprecipitation showing the interaction of FBXO22 with SDCBP in HEK293 cells transfected with the indicated plasmids. An arrow indicates the specific signal for HA-FBXO22. (B) Immunoprecipitation showing the interaction of SDCBP with FBXO22 in HEK293 cells transfected with the indicated plasmids. An arrow indicates the specific signal for HA-FBXO22. (C) Co-immunoprecipitation showing the interaction of FBXO22 with BACH1 in HEK293 cells with or without SDCBP after the indicated transfections. (D) Schematic of experimental design to investigate the assembly of SCFFBXO22–BACH1 complex via His Pull-down assay and endogenous IP assay in Fig. 4D–G. (E) His-pulldown assay showing the interaction of FBXO22 with SKP1 in HEK293 cells with control vector or Myc-SDCBP-expressing vector after the indicated transfections. See also Appendix Fig. S1A. (F) Western blot showing BACH1, PTEN, and PD-L1 protein expression in scramble and in SDCBP-KO MDA-MB-231 cells. (G) Western blot showing BACH1, PTEN, and PD-L1 protein expression in A549 cells transfected with scramble or SDCBP siRNA. (H) Western blot showing BACH1 and PD-L1 protein expression in NCI-H1299 cells transfected with scramble or SDCBP siRNA. (I) Western blot showing BACH1, PTEN, and PD-L1 protein expression in Hs578T cells transfected with control vector or Myc-SDCBP-expressing vector. (J) In vivo ubiquitylation assay showing the inhibitory effect of SDCBP on SCFFBXO22-mediated K48-linked polyubiquitylation of BACH1 in HEK293 cells transfected with the indicated plasmids.

References

    1. Amoutzias GD, Veron AS, Weiner J, Robinson-Rechavi M, Bornberg-Bauer E, Oliver SG, Robertson DL (2007) One billion years of bZIP transcription factor evolution: conservation change in dimerization DNA-binding site specificity. Mol Biol Evol 24:827–835 - PubMed
    1. Bianchini G, Balko JM, Mayer IA, Sers ME, Gianni L (2016) Triple-negative breast cancer: challenges opportunities of a heterogeneous disease. Nat Rev Clin Oncol 13:674–690 - PMC - PubMed
    1. Copel RL, Kanaan Y (2021) New targets in triple-negative breast cancer. Nat Rev Cancer 21:744 - PubMed
    1. Crowley LC, Christensen ME, Waterhouse NJ (2016) Measuring mitochondrial transmembrane potential by TMRE staining. Cold Spring Harb Protoc 2016:pdb-prot087361 - PubMed
    1. De S, Holvey-Bates EG, Mahen K, Willard B, Stark GR (2021) The ubiquitin E3 ligase FBXO22 degrades PD-L1 sensitizes cancer cells to DNA damage. Proc Natl Acad Sci USA 118:e2112674118 - PMC - PubMed

MeSH terms

LinkOut - more resources