. 2025 May;26(5):775-789.
doi: 10.1038/s41590-025-02124-8. Epub 2025 Apr 22.

B cells modulate lung antiviral inflammatory responses via the neurotransmitter acetylcholine

Affiliations

B cells modulate lung antiviral inflammatory responses via the neurotransmitter acetylcholine

Antonio Cembellin-Prieto et al. Nat Immunol. 2025 May.

Abstract

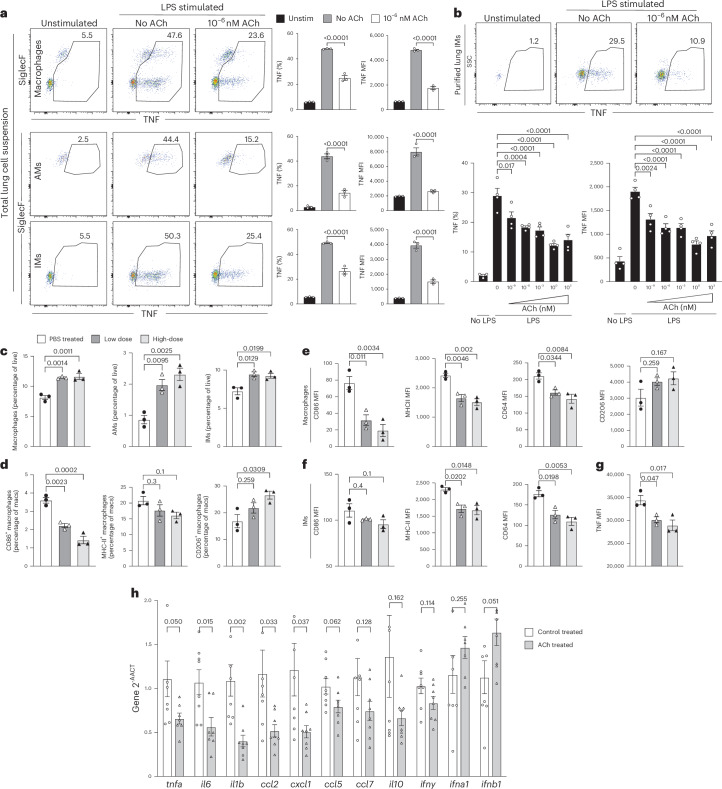
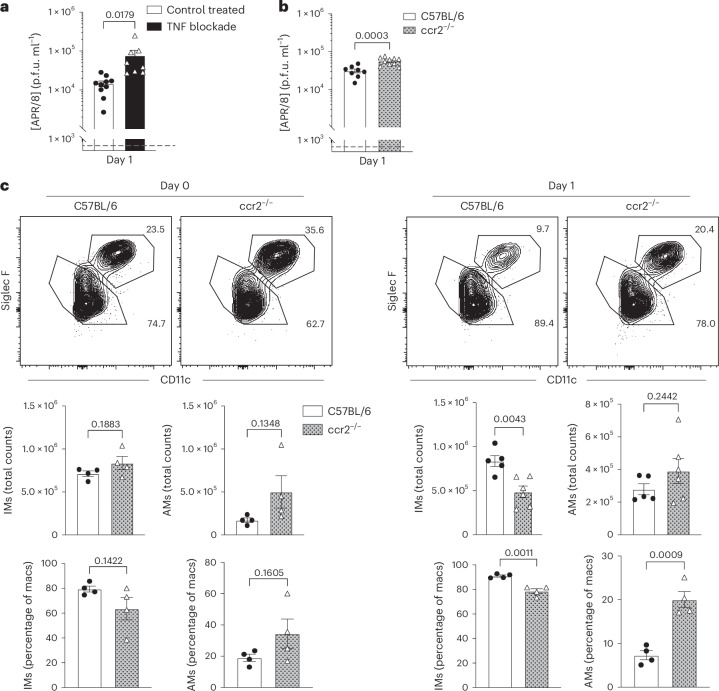
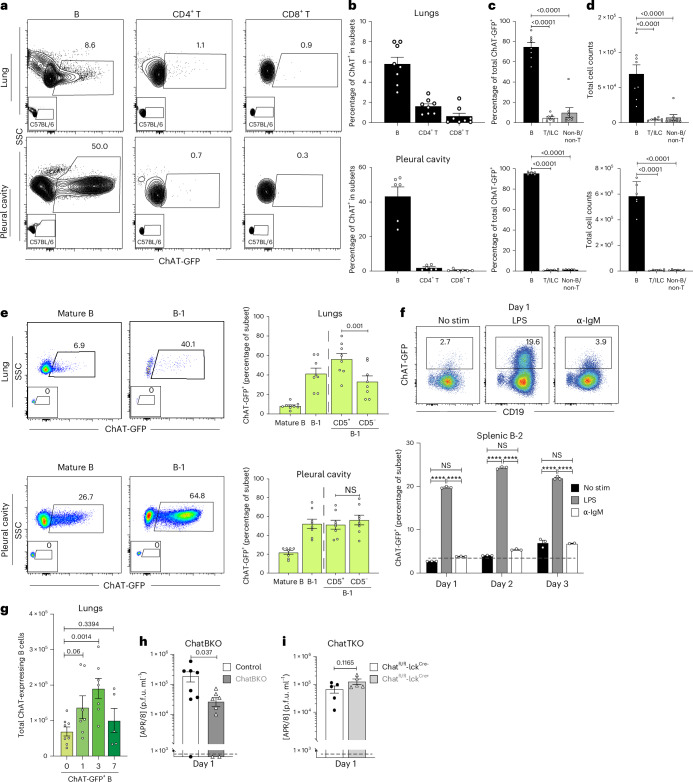
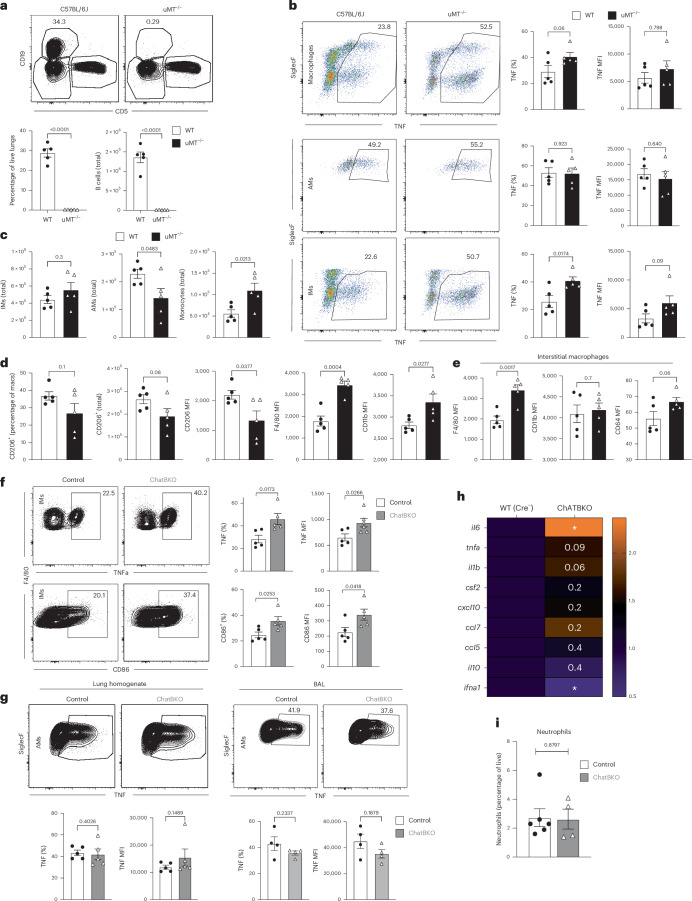
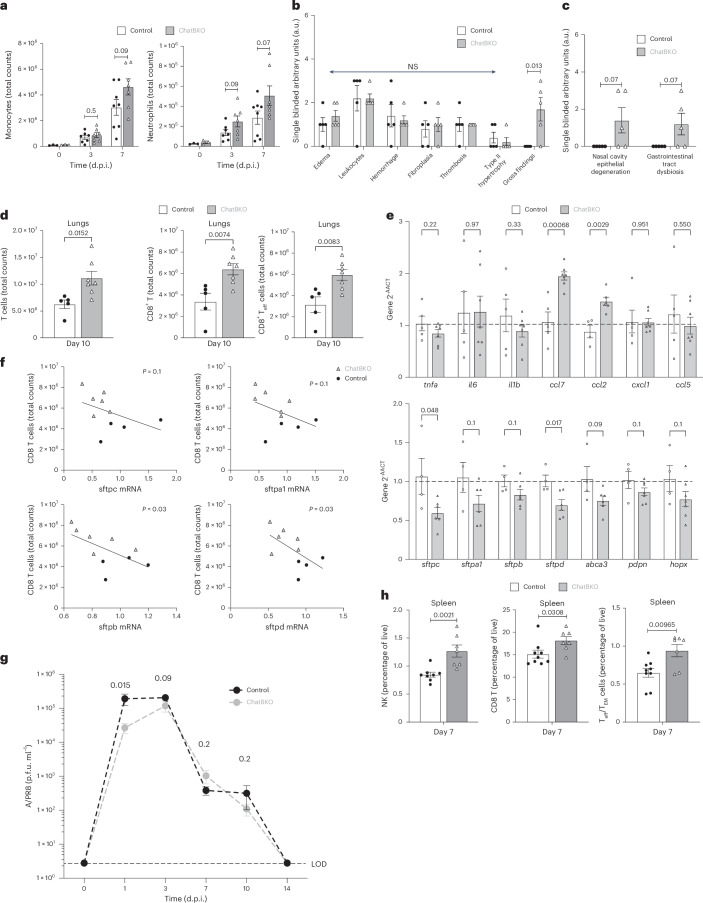
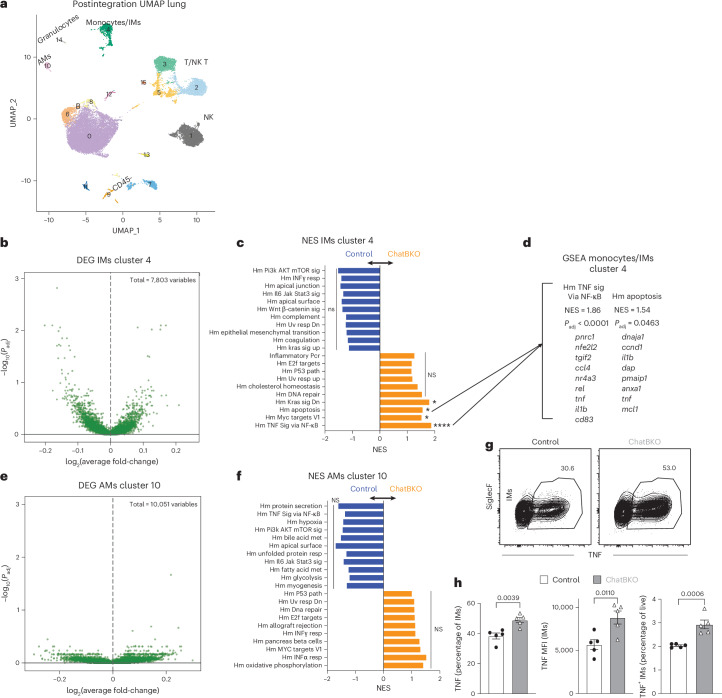
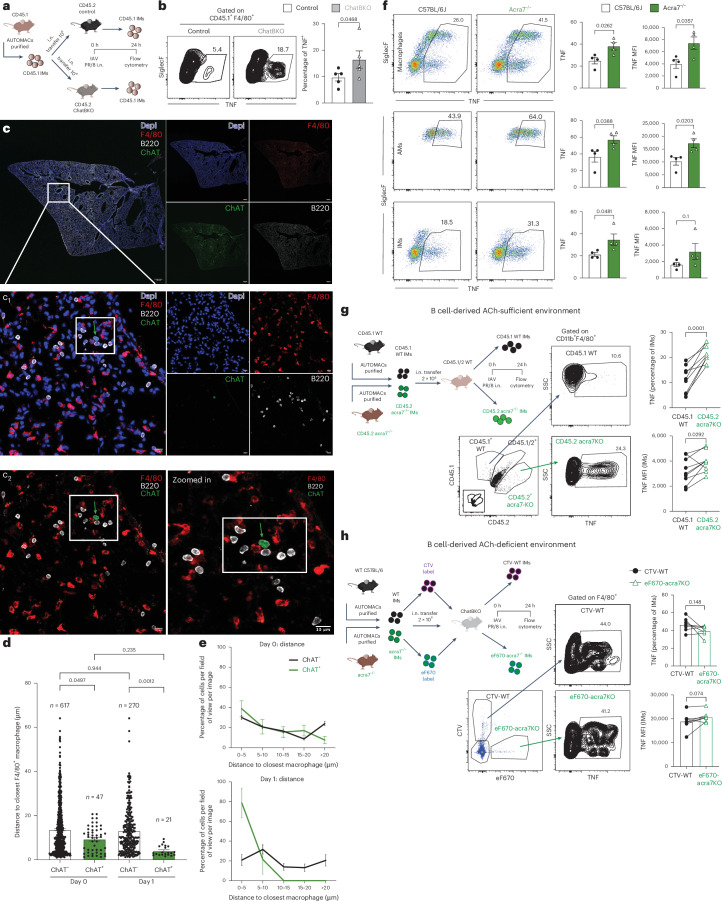
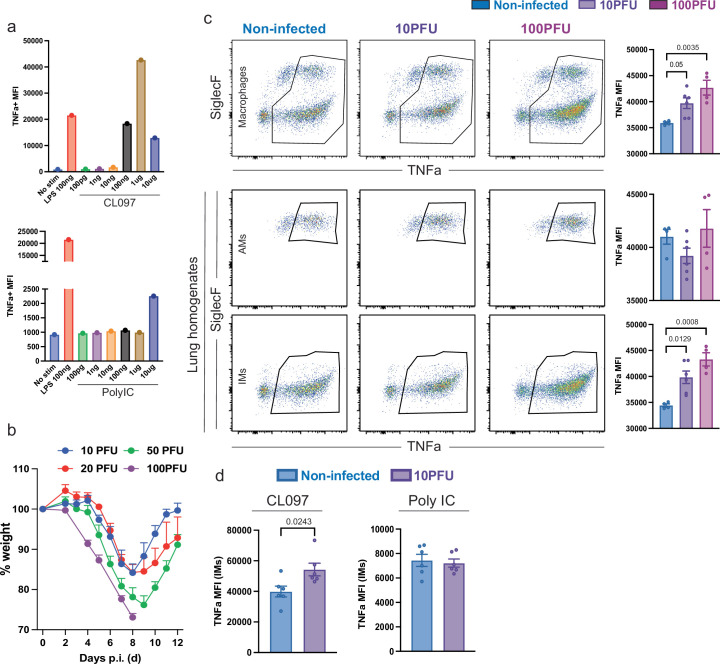
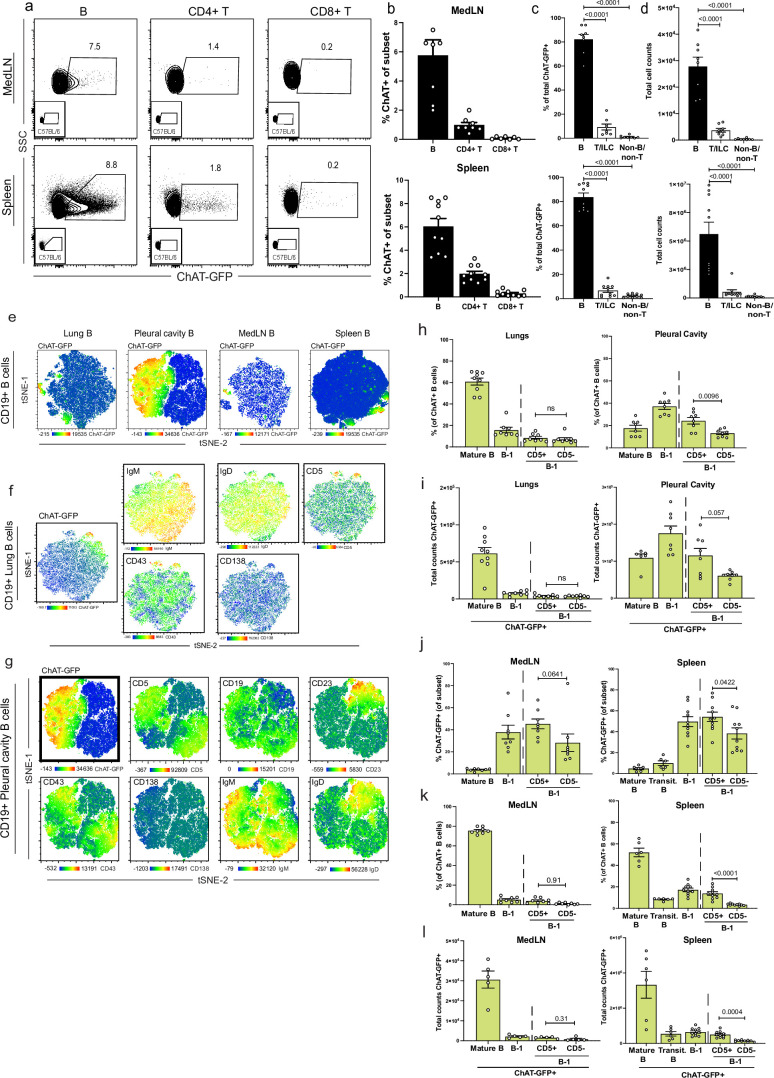
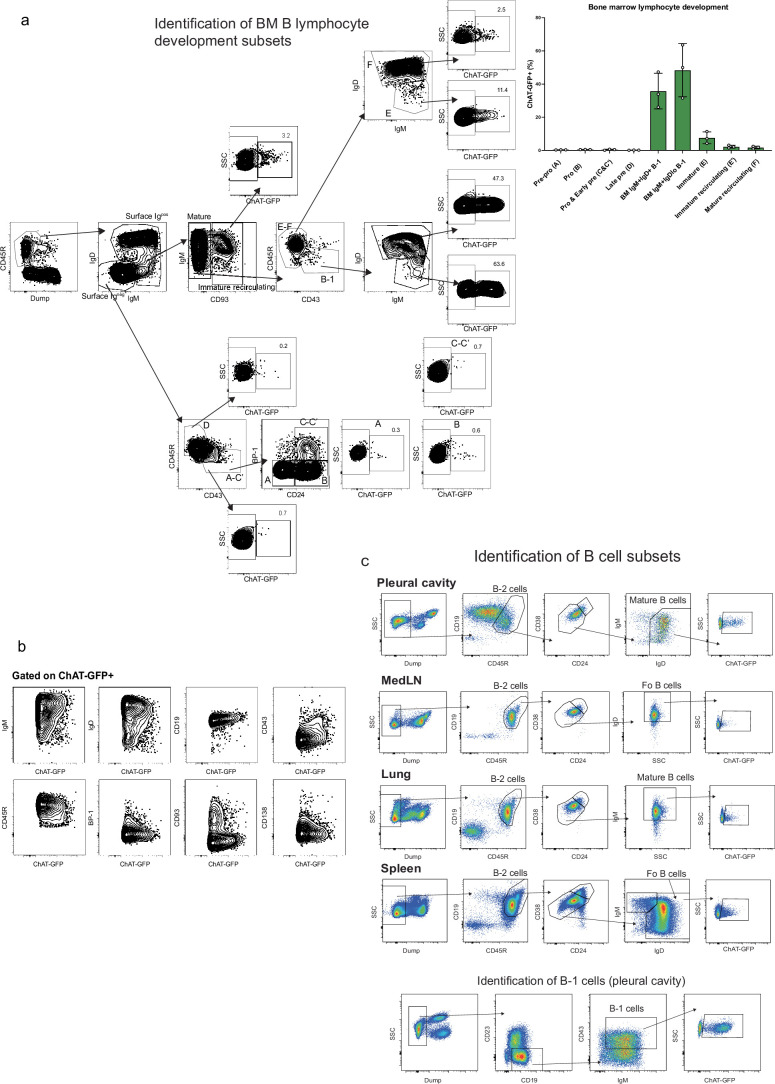
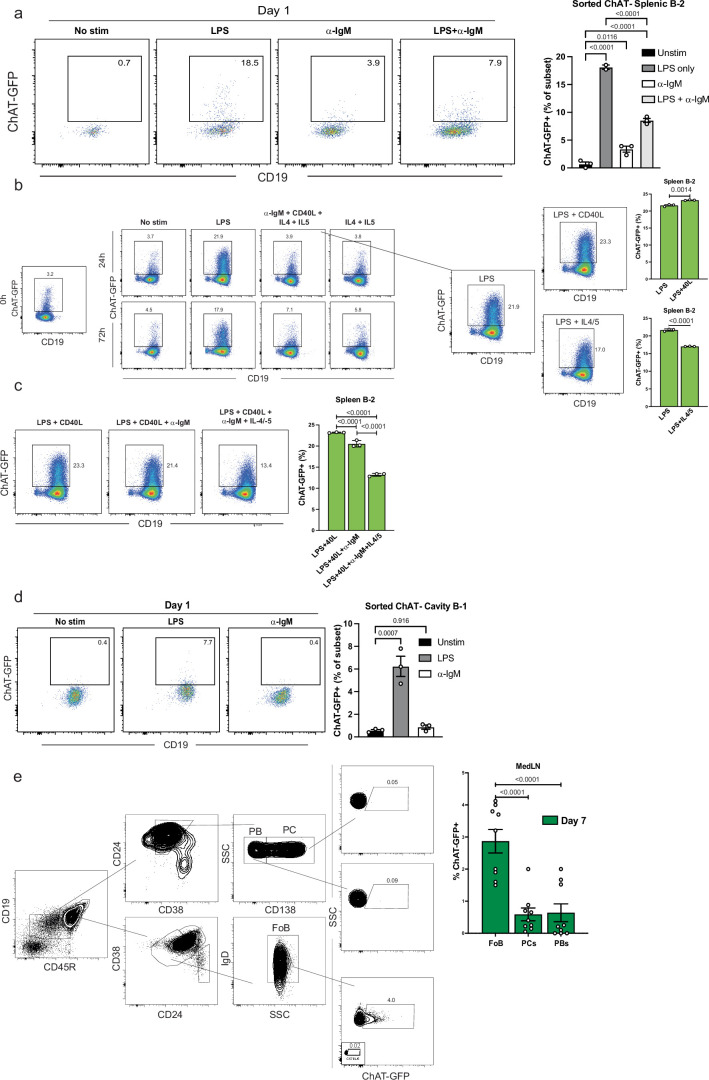
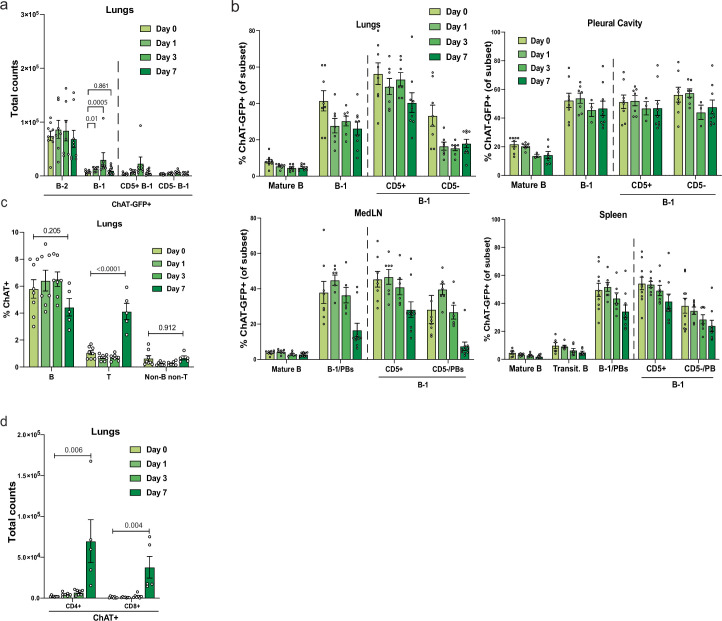
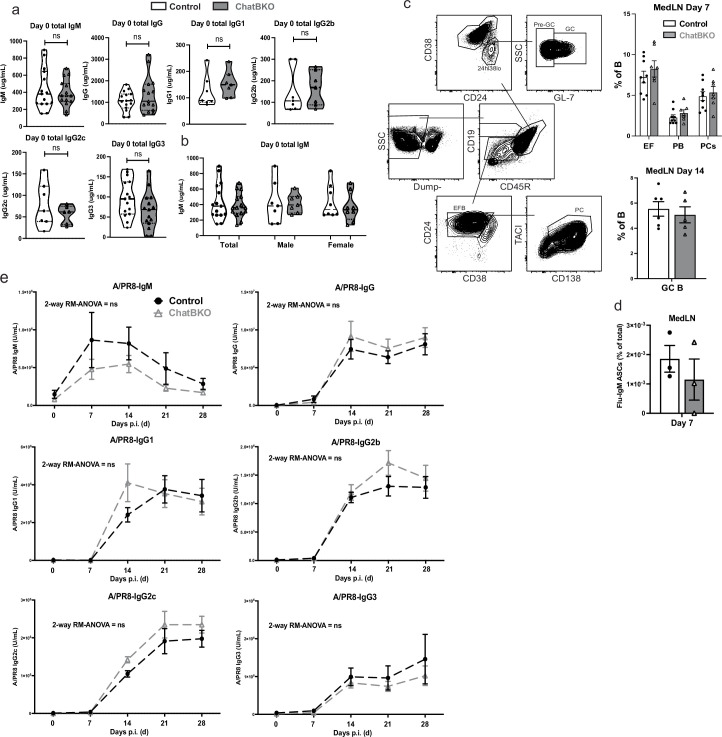
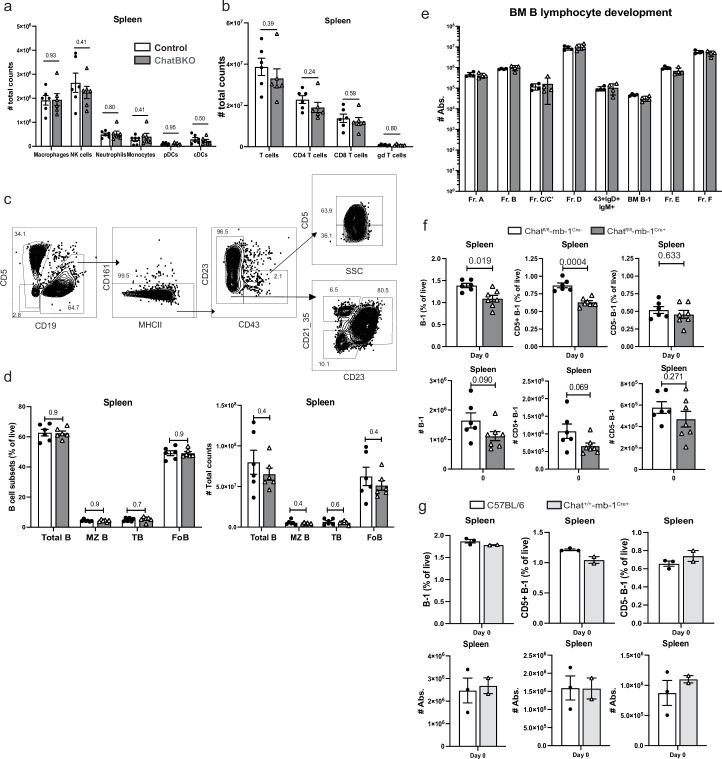
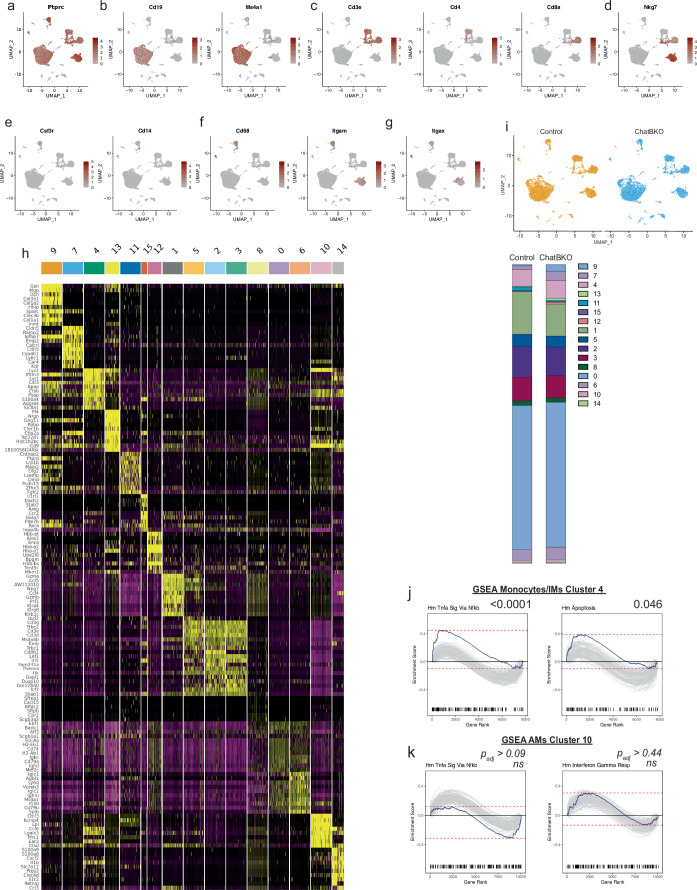
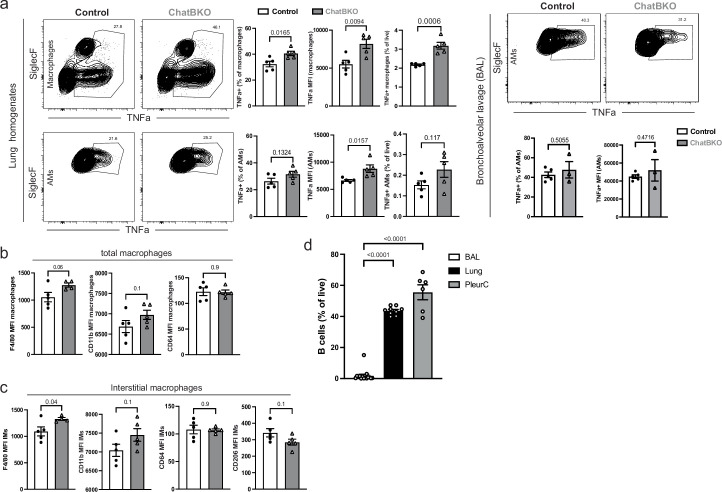
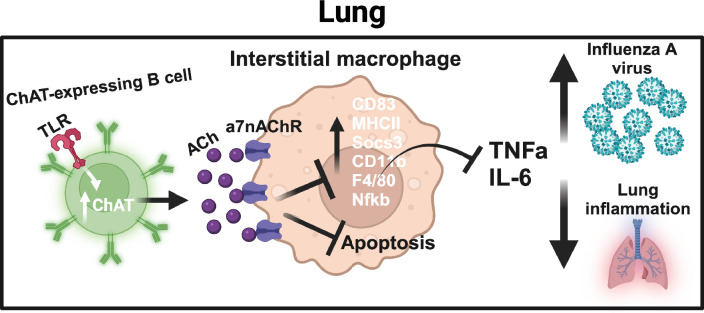
The rapid onset of innate immune defenses is critical for early control of viral replication in an infected host and yet it can also lead to irreversible tissue damage, especially in the respiratory tract. Sensitive regulators must exist that modulate inflammation, while controlling the infection. In the present study, we identified acetylcholine (ACh)-producing B cells as such early regulators. B cells are the most prevalent ACh-producing leukocyte population in the respiratory tract demonstrated with choline acetyltransferase (ChAT)-green fluorescent protein (GFP) reporter mice, both before and after infection with influenza A virus. Mice lacking ChAT in B cells, disabling their ability to generate ACh (ChatBKO), but not those lacking ChAT in T cells, significantly, selectively and directly suppressed α7-nicotinic-ACh receptor-expressing interstitial, but not alveolar, macrophage activation and their ability to secrete tumor necrosis factor (TNF), while better controlling virus replication at 1 d postinfection. Conversely, TNF blockade via monoclonal antibody treatment increased viral loads at that time. By day 10 of infection, ChatBKO mice showed increased local and systemic inflammation and reduced signs of lung epithelial repair despite similar viral loads and viral clearance. Thus, B cells are key participants of an immediate early regulatory cascade that controls lung tissue damage after viral infection, shifting the balance toward reduced inflammation at the cost of enhanced early viral replication.


Conflict of interest statement

Competing interests: The authors declare no competing interests.

Figures

Fig. 1
Fig. 1. TNF is a target of ACh.
a, Total lung single-cell suspensions from C57BL/6 mice (n = 2) cultured in the presence or absence of LPS and treated or not with ACh, in the presence of brefeldin A for 5 h at 37 °C. Representative flow cytometry plots (left) and frequencies of TNF-expressing lung total macrophages (right, top: CD19, ThY1.2, Ly6G, Ly6C and F4/80+/CD64+), AMs (middle: further gated on CD11b, CD11c+ and SiglecF+) or IMs (bottom: further gated on CD11b+, CD11c and SiglecF) are plotted as the frequency of the previous gate (left) or expressed as median fluorescence intensity (MFI, right). b, Negatively enriched IMs from C57BL/6 mice (n = 5) cultured with indicated doses of ACh as in a. Representative flow cytometry plots (top) and frequencies of TNF-expressing IMs and TNF MFI (bottom) are shown. cf, C57BL/6 mice treated i.n. with a combination of ACh and PB 12 h before, at the time of and 24 h after infection with 10 p.f.u. of A/PR8 (0 h), and lungs analyzed via flow cytometry at 1 d.p.i. c,d, Frequencies of lung parenchyma total macrophages (macs), AMs and IMs (percentage of live) (c) and frequencies of lung parenchyma macrophages expressing CD86, MHC-II and CD206, respectively (d). e,f, MFI of indicated markers in total macrophages (e) and IMs (f), gated as in a. g, MFI of TNF expression in IMs, ex vivo, restimulated with LPS. h, Relative gene expression of indicated genes in lung homogenates from control-treated and ACh-treated mice at 1 d.p.i. with influenza A/PR8 (n = 7). Panels a and b represent three independent experiments giving similar results and data contain n = 3 (a) and n = 4 (b) total replicates per group. Panels d and h represent two independent experiments with n = 3 mice each. In ah, the bar graphs show the mean ± s.e.m., in ag, one-way analysis of variance (ANOVA) was used and, in h, the two-tailed, unpaired Student’s t-test. Unstim, unstimulated. Source data
Fig. 2
Fig. 2. Inhibition of lung influenza virus replication by TNF and myeloid cell migration.
C57BL/6 mice were treated with a blocking anti-TNF antibody 12 h before, at the time of and 6 h postinfection with 10 p.f.u. of APR/8. a,b, Influenza A/PR8 viral loads (p.f.u. ml−1) at 1 d.p.i. in lung homogenates from control-treated (n = 10) and anti-TNF-treated (n = 8) mice, pooled from two independent experiments (a) and C57BL/6 (n = 8) and ccr2−/− (n = 10) mice pooled from two independent experiments (b). c, Top, representative flow plots of IMs (CD19, ThY1.2, Ly6G, Ly6C and F4/80+/CD64+, further gated on CD11c and SiglecF) and AMs (further gated on CD11c+ and SiglecF+). Middle, total count of lung parenchyma IMs (left) and AMs (right). Bottom, frequencies of IMs and AMs (percentage of previous gated macrophages) (n = 4 (left) and n = 5 (right) per group). The bar graphs show the mean ± s.e.m. In ac, the two-tailed, unpaired Student’s t-test was used. Source data
Fig. 3
Fig. 3. B cells are the major ChAT-expressing leukocytes regulating TNF production by IMs.
a, Representative flow plots identifying ChAT-GFP+ B, CD4+ and CD8+ T cells from the lungs (top) and pleural cavity (bottom) of ChAT-GFP reporter mice. The small inserts show the same populations from C57BL/6 mice. b, ChAT-GFP+ frequencies among CD19+ B cells, CD3+CD4+ and CD3+CD8+ T cells in the lungs (top) and pleural cavity (bottom). c,d, Frequencies (c) and total cell counts (d) of ChAT-GFP+ cells that are B (CD19+), T/ILC (CD3+ or CD90.2+) or non-B/non-T (CD19CD3 and CD90.2) in the lungs and pleural cavity. e, Representative flow plots (left) and frequencies (right) of ChAT-GFP+ B cell subsets in the lungs (top) and pleural cavity (bottom). f, Representative flow cytometry plots (top) and frequencies (bottom) of ChAT-GFP expression among magnetically enriched, total splenic B-2 cells (CD19+, CD23+, CD43, CD5 and CD9) from ChAT-GFP reporter mice cultured in the presence or absence of LPS, anti-IgM (Fabʹ)2 or both, for the indicated times. g, Total ChAT-GFP B cell counts in the lungs of reporter mice infected for the indicated days postinfection with influenza A/PR8. h,i, Influenza A/PR8 viral loads at 1 d.p.i. from mb-1Cre−/−ChATfl/fl (control) and mb-1Cre+/−ChATfl/fl mice (ChatBKO) (n = 7–9) (h) and Chatfl/fl-lck-Cre−/− (control) and Chatfl/fl-lck-Cre+/− (ChatTKO) mice (n = 5) (i). In a–e, n = 8 (lung) or n = 6 (pleural cavity) mice were pooled from three independent experiments. In f, the data contain n = 3 replicates per group. In g, n = 8 mice, pooled from three independent experiments, in h, n = 8 mice, pooled from two independent experiments and, in i, n = 5 mice pooled from two independent experiments. In ai, the bar graphs show the mean ± s.e.m. and, in bd, f and g, one-way ANOVA and, in e, h and i, two-tailed, unpaired Student’s t-test were used. NS, not significant. Source data
Fig. 4
Fig. 4. B cells control lung IM responses via ACh.
a, Representative flow cytometry plots (top) and frequencies (bottom) of CD19+, CD5 B cells in the lungs of WT C57BL/6 and μMT−/− mice. be, Flow cytometry on lungs of WT C57BL/6 and μMT−/− mice (n = 5) infected with A/PR8 at 1 d.p.i. b, Representative flow cytometry plots (left) and frequencies and MFI (right and far right, respectively) of TNF-expressing lung total macrophages (top: CD19, ThY1.2, Ly6G, Ly6C and F4/80+/CD64+), AMs (middle: further gated on CD11b, CD11c+ and SiglecF+) and IMs (bottom: further gated on CD11b+, CD11c and SiglecF) after ex vivo restimulation with LPS. c, Total counts of lung IMs (left), AMs (middle) or monocytes (right) gated as in b. d,e, Frequencies and total number of lung parenchyma CD206+ macrophages and MFI of indicated markers among total macrophages (d) and IMs (e). f, Representative flow plots (left) and frequencies (right) of TNF-expressing IMs from lung parenchyma gated as in b from mb-1Cre−/−ChATfl/fl (control) and mb-1Cre+/−ChATfl/fl (ChatBKO) mice at 1 d.p.i. after infection with A/PR8, following ex vivo restimulation with LPS. g, Representative flow plots of TNF production by lung tissue homogenates (left) and BAL (right) AMs from mice as in g after ex vivo LPS stimulation. h, Relative gene expression of indicated cytokines and chemokines in lung homogenates from control and ChatBKO mice at 1 d.p.i. i, Frequency of lung neutrophils (CD19, Thy1.2, Ly6C and Ly6G+) at 1 d.p.i. in control (n = 6) and ChatBKO (n = 4) mice. In ah, n = 5 were mice pooled from two independent experiments. The bar graphs show the mean ± s.e.m. The symbols indicate the results from an individual mouse. In ah, the two-tailed, unpaired Student’s t-test was used. Source data
Fig. 5
Fig. 5. Lack of B cell-derived ACh causes increased local and systemic inflammation.
a, Total cell counts of monocytes (CD19, Thy1.2, Ly6G and Ly6C+) and neutrophils (CD19, Thy1.2, Ly6C and Ly6G+) of lung homogenates from mb-1Cre−/−ChATfl/fl (control) (n = 8) and mb-1Cre+/−ChATfl/fl (ChatBKO) mice (n = 7) infected for indicated times with influenza A/PR8. b,c, Histopathological evaluation of lung parenchyma (b) and nasal cavity and gastrointestinal tract (c) from indicated mice at 7 d.p.i. after infection with 100 p.f.u. of A/PR8. d, Total numbers of T cells (right), CD8 T cells (CD3+, CD4 and CD8+) (middle) or effector (Teff)/effector memory (TEM) (CD3+, CD4, CD8+, CD44hi and CD62L) CD8 T cells in the lung homogenates from control (n = 5) and ChatBKO (n = 7) mice at 10 d.p.i. infected as in a. e, Fold-change gene expression in lung homogenates from control (n = 5) and ChatBKO (n = 7) mice at 10 d.p.i. with A/PR8 compared with noninfected. f, Correlations of CD8 T cell numbers and gene expression in lung homogenates. g, Lung virus loads at indicated timepoints in control and ChatBKO mice (n = 6–12 per group). h, Frequencies of spleen NK cells (left; CD19, Th1.2, Ly6G, Ly6C and NK1.1+), CD8+ T cells (middle) and effector/effector memory CD8+ T cells (right) in control (n = 8) and ChatBKO mice (n = 7) at 7 d.p.i. with 100 p.f.u. of A/PR8. In a and dh, mice are pooled from two to three independent experiments and, in b and c, n = 5 mice. The bar graphs show the mean ± s.e.m. The symbols indicate results from an individual mouse. In ae, g and h, two-tailed, unpaired Student’s t-tests were used. a.u., arbitrary units. Source data
Fig. 6
Fig. 6. ChAT B cells alter the transcriptional profile of myeloid cells.
a, ScRNA-seq post-sample integration UMAP plots of lung parenchyma cells pooled from two mb-1Cre−/−ChATfl/fl (control) or two mb-1Cre+/−ChATfl/fl (ChatBKO) female mice analyzed by scRNA-seq. b,e, Differentially expressed genes (DEGs) among cells in clusters 4 (IMs) (b) and 10 (AMs) (e), comparing control and ChatBKO mice. c,f, The 10–11 selected, most differentially expressed, Hallmark (Hm) signaling (sig) pathways in clusters 4 (c) and 10 (f), comparing normalized enrichment scores (NES) for control (blue, left) and ChatBKO (orange, right) mice as identified by gene set enrichment analysis (GSEA); uv, ultraviolet; dn, down; resp, response; pcr, pathology complete response; path, pathway; met, metabolism. d, Calculation of Padj values and the determination of the NES for the two pathways exhibiting the most DEGs. Eight or nine genes with the most DEGs between groups within each specified pathway are shown. g, Representative flow cytometry plots (top) and quantification (bottom) of TNF-expressing lung IMs (CD19, CD5, CD11b+, F4/80+/CD64+CD11c-, Ly6G, Ly6C and SiglecF) plotted as a frequency of the previous gate (bottom, left), MFI quantification (bottom, middle) and a frequency of live cells (bottom, right) after short-term restimulation with LPS comparing control and ChatBKO mice (n = 5 per group). In c, d and f, fgsea v.1.24.0 was used to run GSEA with gene sets obtained from the Molecular Signatures Database. Features were ranked by −log(P) × sign(fold-change). In g, pooled mice are from two independent experiments. The bar graphs show the mean ± s.e.m. In g, the two-tailed, unpaired Student’s t-test was used. Source data
Fig. 7
Fig. 7. B cells modulate lung IMs via ACh and α7nAChR.
a, Experimental design. b, Representative flow plots (left) and frequencies (right) of CD45.1 TNF-producing lung CD45.1+, CD45.2 and F4/80+ IMs (n = 5 per group). c, Maximum projection lung immunofluorescent images (×10) of ChAT-GFP mice at 1 d.p.i. with A/PR8. Scale bar, 500 μm. Right, single channels. Boxes show the area of focus. c1, The ×63 oil z-stack maximum projection image. Scale bar, 10 μm. Right, single channels. Boxes show the area of focus and arrows indicate ChAT+ B cells in the vicinity with IMs. c2, Lung immunofluorescent image from b zoomed in (right). Scale bar, 10 μm. d, Distance (in μm) of indicated B cells (n = 955) to nearest macrophage. e, Frequency of indicated B cells per field of view binned by distance to closest macrophage, before (top) and at 1 d.p.i. (bottom) with A/PR8. f, Left, representative flow plots. Right, frequencies and MFI (right and far right) of TNF by: top, CD19, Thy1.2, Ly6G, Ly6C and F4/80+/CD64+ macrophages; middle, AMs (further gated on CD11b, CD11c+ and SiglecF+); and bottom, IMs (further gated on CD11b+, CD11c and SiglecF) from lungs of 24-h A/PR8-infected WT C57BL/6 and acra7−/− mice (n = 4). g, Left, experimental design. Right and bottom, representative flow plots from lung macrophages gated on CD45 allotype to identify WT (CD45.1) (n = 9), acra7−/− (n = 8) mice (CD45.2) and host (CD45.1/2) cells stained for TNF. Far right, frequencies of TNF (top) and MFI (bottom); paired cells from the same recipient. h, Left, experimental design. Middle, gating strategy identifying differentially dye-labeled WT C57BL/6 (CTV) (n = 7) and acra7−/− (n = 6) lung IMs 24 h after adoptive transfer into influenza A/PR8-infected ChatBKO mice. Right, frequencies of TNF+ lung IMs. In a, b and f, two representatives of independent experiments are shown with similar results and, in c, representatives of three independent experiments with similar results. In d and e, the total number of cells analyzed is shown from >30 images across 10 slides from two mice per timepoint and, in g and h, mice pooled from two independent experiments are shown. The bar graphs show the mean ± s.e.m. In a and b, the one-tailed, unpaired Student’s t-test is used, in d, the one-way ANOVA and, in f, the two-tailed, unpaired Student’s t-test. Source data
Extended Data Fig. 1
Extended Data Fig. 1. ACh inhibits pro-inflammatory cytokine production by lung interstitial macrophages after influenza infection.
a) total lung single cell suspensions from C57BL/6 mice (n = 2) cultured in the presence or absence of depicted concentrations of stimuli: LPS, CL097 (top) and PolyIC (bottom). Shown are the MFI of TNFα-expression among IMs gated as in c). b) C57BL/6 mice (n = 4/group) were infected with indicated plaque-forming units (PFU) of influenza A/PR8 on d0 for 10-15 days. Shown is the mean percentage weight change + SD over the course of the infection compared to d0. c) C57BL/6 mice were infected with indicated doses of influenza A/PR8 i.n. (n = 4/non-infected and 10PFU group; n = 6/100PFU group) and lungs were analyzed by flow cytometry at 1 day post infection. Shown are representative flow cytometry plots (left) and MFI of TNFα-expression among lung total macrophages (right) gated on CD19-, Thy1.2-, Ly6G-, Ly6C-, F4/80 + /CD64+ (top), alveolar macrophages (AMs) further gated on CD11b-, CD11c + , SiglecF+ (middle), or interstitial macrophages (IMs) further gated on CD11b + , CD11c-, SiglecF- (bottom). d) C57BL/6 (n = 6/group) mice were infected as in c). MFI of TNFa-expression among IMs after ex-vivo restimulation with CL097 (left) or PolyIC (right). a) representative of two independent experiments b) n = 4/group mice pooled from 2 independent experiments. c) Results were pooled from 2 independent experiments. d) mice pooled from 2 independent experiments. Bar graphs show mean ± s.e.m. Symbols indicate results from an individual mouse. One-Way ANOVA. Source data
Extended Data Fig. 2
Extended Data Fig. 2. B cells are the major ChAT-expressing leukocytes at steady state.
a) representative flow cytometry plots for the identification of ChAT-GFP + B, CD4+ and CD8 + T cells from mediastinal lymph node (MedLN) (top) and spleen (bottom) of GFP-ChAT reporter mice. Small inserts show same populations from non-GFP expressing C57BL/6 mice. b) ChAT-GFP+ frequencies among CD19 + B cells, CD3 + CD4+ and CD3 + CD8 + T cells in the MedLN (top) and spleen (bottom). c) frequencies of ChAT-GFP+ cells that are either B (CD19 + ), T/ILC (CD3+ or CD90.2 + ) or Non-B/Non-T (CD19- CD3-, CD90.2-). d) cell counts of ChAT-GFP + B, T/ILC and Non-B/Non-T cells in the MedLN (top) and spleen (bottom). e) tSNE plots with heat map indicating ChAT-GFP expression of B cells (CD19 + , Thy1.2-) from indicated tissues (lungs, pleural cavity, MedLN and spleen). f) flow cytometry tSNE plots of lung B cells (CD19 + , Thy1.2-) with heat map quantifying expression of indicated surface markers. g) flow cytometry tSNE plots of pleural cavity B cells (CD19 + , Thy1.2-) with heat map quantifying expression of indicated surface markers h) ChAT-GFP+ frequencies of B cell subsets (gating strategy, Extended Data Fig. 3) among total ChAT-GFP + B cells (CD19 + , Thy1.2-) in the lung and pleural cavity. i) cell counts of ChAT-GFP + B cell subsets in the lungs and pleural cavity. j) frequencies of ChAT-GFP+ cells among B cell subsets in the MedLN and spleen. k) frequency of ChAT-GFP+ frequencies of B cell subsets among total ChAT-GFP + B cells (CD19 + , Thy1.2-) in the MedLN and spleen. l) cell counts of ChAT-GFP + B cell subsets in the MedLN and spleen. a-d) n = 8/MedLN and n = 10/spleen mice pooled from 3 independent experiments. e-g) representative of 2 independent experiments with n = 3 mice per tissue. h-l) n = 8/lung and Pleural cavity; n = 8/MedLN and n = 10/spleen mice pooled from 3 independent experiments. Bar graphs indicate mean ± s.e.m. Symbols indicate results from an individual mouse; a-d) One-way ANOVA. Source data
Extended Data Fig. 3
Extended Data Fig. 3. ChAT induction first occurs at the immature B cell stage.
Bone Marrow (BM) from ChAT-GFP reporter mice (n = 3) analyzed by flow cytometry to identify ChAT-expression among B cell differentiation stages. a) (left) gating strategy using CD45R to identify B cells and separation of cells into surface Ig+ and Ig negative cells (lower panels), which were then divided into CD43+ (Hardy Fr. A-C’) and CD43- (Hardy Fr. D). Surface Ig+ cells were divided into CD93 (immature, Hardy Fr. E) and CD93- cells. The latter were further separated into CD43- mature circulating B cells (Hardy Fr. F), and CD43+ IgMhi IgDlo B-1 cells; (right) quantification of BM ChAT-GFP + B cells as frequency of the indicated B cell subset. b) representative flow plots showing the relationship between ChAT-GFP expression and other surface markers used to define B cell developmental stages. c) gating strategy to identify different B cell subsets in all tissues analyzed (lungs, pleural cavity, mediastinal lymph nodes and spleen). Results in a) are representative of 2 independent experiments with n = 3 mice each. Bar graphs show mean ± s.e.m. Symbols indicate results from an individual mouse. Source data
Extended Data Fig. 4
Extended Data Fig. 4. ChAT induction in B cells.
a–d, flow cytometry plots (left) and frequencies (right) of ChAT-GFP expression among FACS-sorted splenic ChAT-GFPneg B-2 cells (CD19 + ,CD23 + ,CD43-, CD5-, CD9-, ChAT-GFPneg) (a) or magnetically-enriched total splenic B-2 cells (CD19 + ,CD23 + ,CD43-, CD5-, CD9-) from ChAT-GFP reporter mice cultured in the presence or absence of LPS, anti-IgM (Fab)2, or indicated stimuli, for indicated times (b,c). d, representative flow cytometry plots (left) and frequencies (right) of ChAT-GFP expressing FACS-sorted pleural cavity ChAT-GFPneg B-1 cells (CD19 + , CD23-, CD43 + , ChAT-GFPneg) cultured in the presence or absence of LPS, anti-IgM (Fab)2, or both, for 24 h. e, representative flow cytometry plots and gating strategy (left) and frequencies (right) of ChAT-GFP expressing Follicular B cells (FoB), Plasmablasts (PB) or plasma cells (PC) from MedLN of ChAT-GFP reporter mice infected with 10PFU A/PR8 for 7 days. a–d, representative of 2 experiments with similar results; data represent n = 3 technical replicates per group e) n = 9 mice, pooled from 3 independent experiments. Bar graphs indicate mean ± s.e.m. a–e, One-Way ANOVA. Source data
Extended Data Fig. 5
Extended Data Fig. 5. ChAT B cell induction and redistribution after influenza infection.
a-c) Flow cytometry of lungs, pleural cavity, MedLN and spleen of ChAT-GFP reporter mice infected with 10PFU A/PR8 for 0, 1, 3 and 7 days. a) total cell counts of ChAT-GFP + B cell subsets (Extended Data Fig. 2c) (right). b) frequency of ChAT-GFP+ expressing cells among each B cell subset in lungs, pleural cavity, spleen and MedLN c) frequency of ChAT-GFP + B (CD19 + ), T-ILC (CD3+ or Thy1.2 + ) and Non-B/Non-T (CD19-, CD3-, Thy1.2-) among total ChAT-GFP+ cells. d) cell counts of ChAT-GFP + CD4+ and CD8 + T cells in the lungs at indicated days after influenza infection. a-d) n = 8/lung and Pleural cavity; n = 8/MedLN and n = 10/spleen mice pooled from 3 independent experiments. Bar graphs show mean ± s.e.m. Symbols indicate results from an individual mouse. a-d) One-Way ANOVA. Source data
Extended Data Fig. 6
Extended Data Fig. 6. B cell-derived ACh does not alter antibody production.
a) Serum IgM, IgG, IgG1, IgG2b and IgG2c concentrations in non-infected mb-1Cre-/- ChATfl/fl (Control) and mb-1Cre+/- ChATfl/fl (ChatBKO) mice (n = 8-14/group) and b) concentrations serum IgM in male and female Control and ChatBKO mice. c) Representative flow cytometry plots of MedLN from Control (n = 9) and ChatBKO (n = 7) mice infected with 10PFU A/PR8 for 7 days (left), frequencies of extrafollicular B cells (EF), plasmablasts (PB) or plasma cells (PC) (top-right) and frequencies of germinal center B cells (GC B) at 14dpi (bottom right). d) A/PR8-specific IgM ASCs in the MedLN at 7dpi. e) Influenza specific serum IgM, IgG, IgG1, IgG2b, IgG2c, IgG3 in Control and ChatBKO mice (n = 9/group). a, b) Mice pooled from 3 independent experiments c) mice pooled from 3 independent experiments. d) representative of 2 independent experiments with n = 3 which gave similar results. e) results from mice pooled from 2 independent experiments. Bar graphs and violin plots show mean ± s.e.m. Symbols indicate results from an individual mouse. a-d) two-tailed unpaired Student’s t-test. e) repeated measure 2-way ANOVA. Source data
Extended Data Fig. 7
Extended Data Fig. 7. Lack of ChAT B cells does not affect steady state leukocyte composition nor B cell development.
a-e) flow cytometric analysis of adult male and female mb-1Cre-/- ChATfl/fl (Control) and mb-1Cre+/- ChATfl/fl (ChatBKO) mice. a, b) cell counts of (a) innate leukocytes, and (b) T cells. c) flow cytometric gating strategy to identify B cell subsets in the spleen. d) frequency and absolute numbers of B cell subsets in spleen steady state comparing Control and ChatBKO mice. e) Bone Marrow (BM) B lymphocyte development subsets using the Hardy gating scheme as in (Extended Data Fig. 2). f) frequencies (top) and total numbers (bottom) of B-1 cells and CD5+ and CD5- B-1 cells comparing Control and ChatBKO mice. g) similar to (f) but comparing C57BL/6 and mb-1Cre+/- ChAT+/+ mice. a-d, f) n = 6 mice pooled from 2 independent experiments. e, g) representative of 2 independent experiments with similar results, n = 4 each. Bar graphs show mean ± s.e.m. Symbols indicate results from an individual mouse. a-g) two-tailed unpaired Student’s t-test. Source data
Extended Data Fig. 8
Extended Data Fig. 8. Lack of ChAT B cells alters lung myeloid cells in steady state.
a-g) scRNA-Seq post-sample integration UMAP analysis plots from live, single cells of lungs from mb-1Cre-/- ChATfl/fl (Control) and mb-1Cre+/- ChATfl/fl (ChatBKO) mice (n = 4 females/group). Each graph indicates expression levels of indicated canonical cell lineage markers. The intensity of expression is indicated by red coloring. h) Heat map of post-sample integration gene clustering analysis indicating the ten most differentially expressed genes across all clusters. i) (top) scRNA-Sequencing pre-sample integration UMAP plots of lung parenchyma cells from Control (orange) and ChATBKO (blue) mice, and (bottom) frequencies of cells by cluster and sample, compared to the total number of cells per sample plotted as a stacked bar chart. j) scRNA-Seq hallmark Tnfa Signaling via Nfkb and apoptosis pathway analyses for cluster 4 (IMs) and k) hallmark Tnfa Signaling via Nfkb and interferon gamma response pathways for cluster 10 (AMs). j-k) two-tailed student’s t-test. Source data
Extended Data Fig. 9
Extended Data Fig. 9. B cell derived ACh inhibits lung interstitial- but not alveolar- macrophage activation.
a-c) flow cytometry of single cell suspensions from lung parenchyma (left) and BAL (right) of mb-1Cre-/- ChATfl/fl (Control) and mb-1Cre+/- ChATfl/fl (ChatBKO) mice. a) representative flow cytometry plots (left) and frequencies (right) of TNFα-expressing lung or BAL macrophages (top; CD19-, ThY1.2-, Ly6G-, Ly6C-, F4/80 + /CD64 + ) and alveolar macrophages (bottom; AMs; CD19-, ThY1.2-, Ly6G-, Ly6C-, F4/80 + /CD64 + CD11c + , CD11b-, SiglecF + ), frequencies are of previous gate (% of macrophages), TNFα shown as frequencies of live, MFI and as a frequency of macrophages, respectively, after ex-vivo LPS restimulation in the presence of Brefeldin A for 4 h at 37 C. b) MFI of indicated markers (F4/80, CD11b, CD64) in total macrophages and c) in IMs. d) frequency of B cells in BAL (n = 12), lung parenchyma (n = 9) and pleural cavity (n = 6) cells represented as a frequency of live events from C57BL/6 mice. a-c) n = 5 mice pooled from 2 independent experiments with 2-3 mice each. d) mice pooled from 3 independent experiments. Bar charts show mean ± s.e.m. Symbols indicate results from an individual mouse. Two-tailed unpaired Student’s t-test. Source data
Extended Data Fig. 10
Extended Data Fig. 10. B cell-derived ACh controls lung interstitial macrophage responses to influenza infection.
Lung B cells, upon receiving innate-like signals such as through TLR4, induce choline acetyltransferase (ChAT) expression, enabling them to generate acetylcholine (ACh). In both steady-state conditions and immediately following influenza-infection, B cells engage with α7 nicotinic acetylcholine receptor (α7nAChR)+ lung interstitial macrophages (IMs), residing in close proximity. B cell secretion of ACh stimulates IMs via α7nAChR, inhibiting apoptosis and suppressing local inflammation, thereby allowing enhanced early viral replication. This early-stage inhibition of pro-inflammatory cytokine production is beneficial to host organ function and local and systemic inflammation, helping the maintenance and/or repair of lung tissue during and after respiratory tract infection. Figure created using BioRender.com.

Update of

Similar articles

Cited by

References

    1. Wu, T. T.-H. et al. Interstitial macrophages are a focus of viral takeover and inflammation in COVID-19 initiation in human lung. J. Exp. Med.221, e20232192 (2024). - PMC - PubMed
    1. Ferreira, A. C. et al. Macrophages undergo necroptosis during severe influenza A infection and contribute to virus-associated cytokine storm. Front. Cell Infect. Microbiol.16, e1067285 (2023).
    1. Karki, R. et al. Synergism of TNF-α and IFN-γ triggers inflammatory cell death, tissue damage, and mortality in SARS-CoV-2 infection and cytokine shock syndromes. Cell184, 149–168.e17 (2021). - PMC - PubMed
    1. DeBerge, M. P., Ely, K. H. & Enelow, R. I. Soluble, but not transmembrane, TNF-α is required during influenza infection to limit the magnitude of immune responses and the extent of immunopathology. J. Immunol.192, 5839–5851 (2014). - PMC - PubMed
    1. Mestan, J. et al. Antiviral effects of recombinant tumour necrosis factor in vitro. Nature323, 816–819 (1986). - PubMed

MeSH terms

Substances

LinkOut - more resources