. 2025 May;5(5):765-779.
doi: 10.1038/s43587-025-00852-y. Epub 2025 Apr 22.

The retrotransposon-derived capsid genes PNMA1 and PNMA4 maintain reproductive capacity

Affiliations

The retrotransposon-derived capsid genes PNMA1 and PNMA4 maintain reproductive capacity

Thomas W P Wood et al. Nat Aging. 2025 May.

Abstract

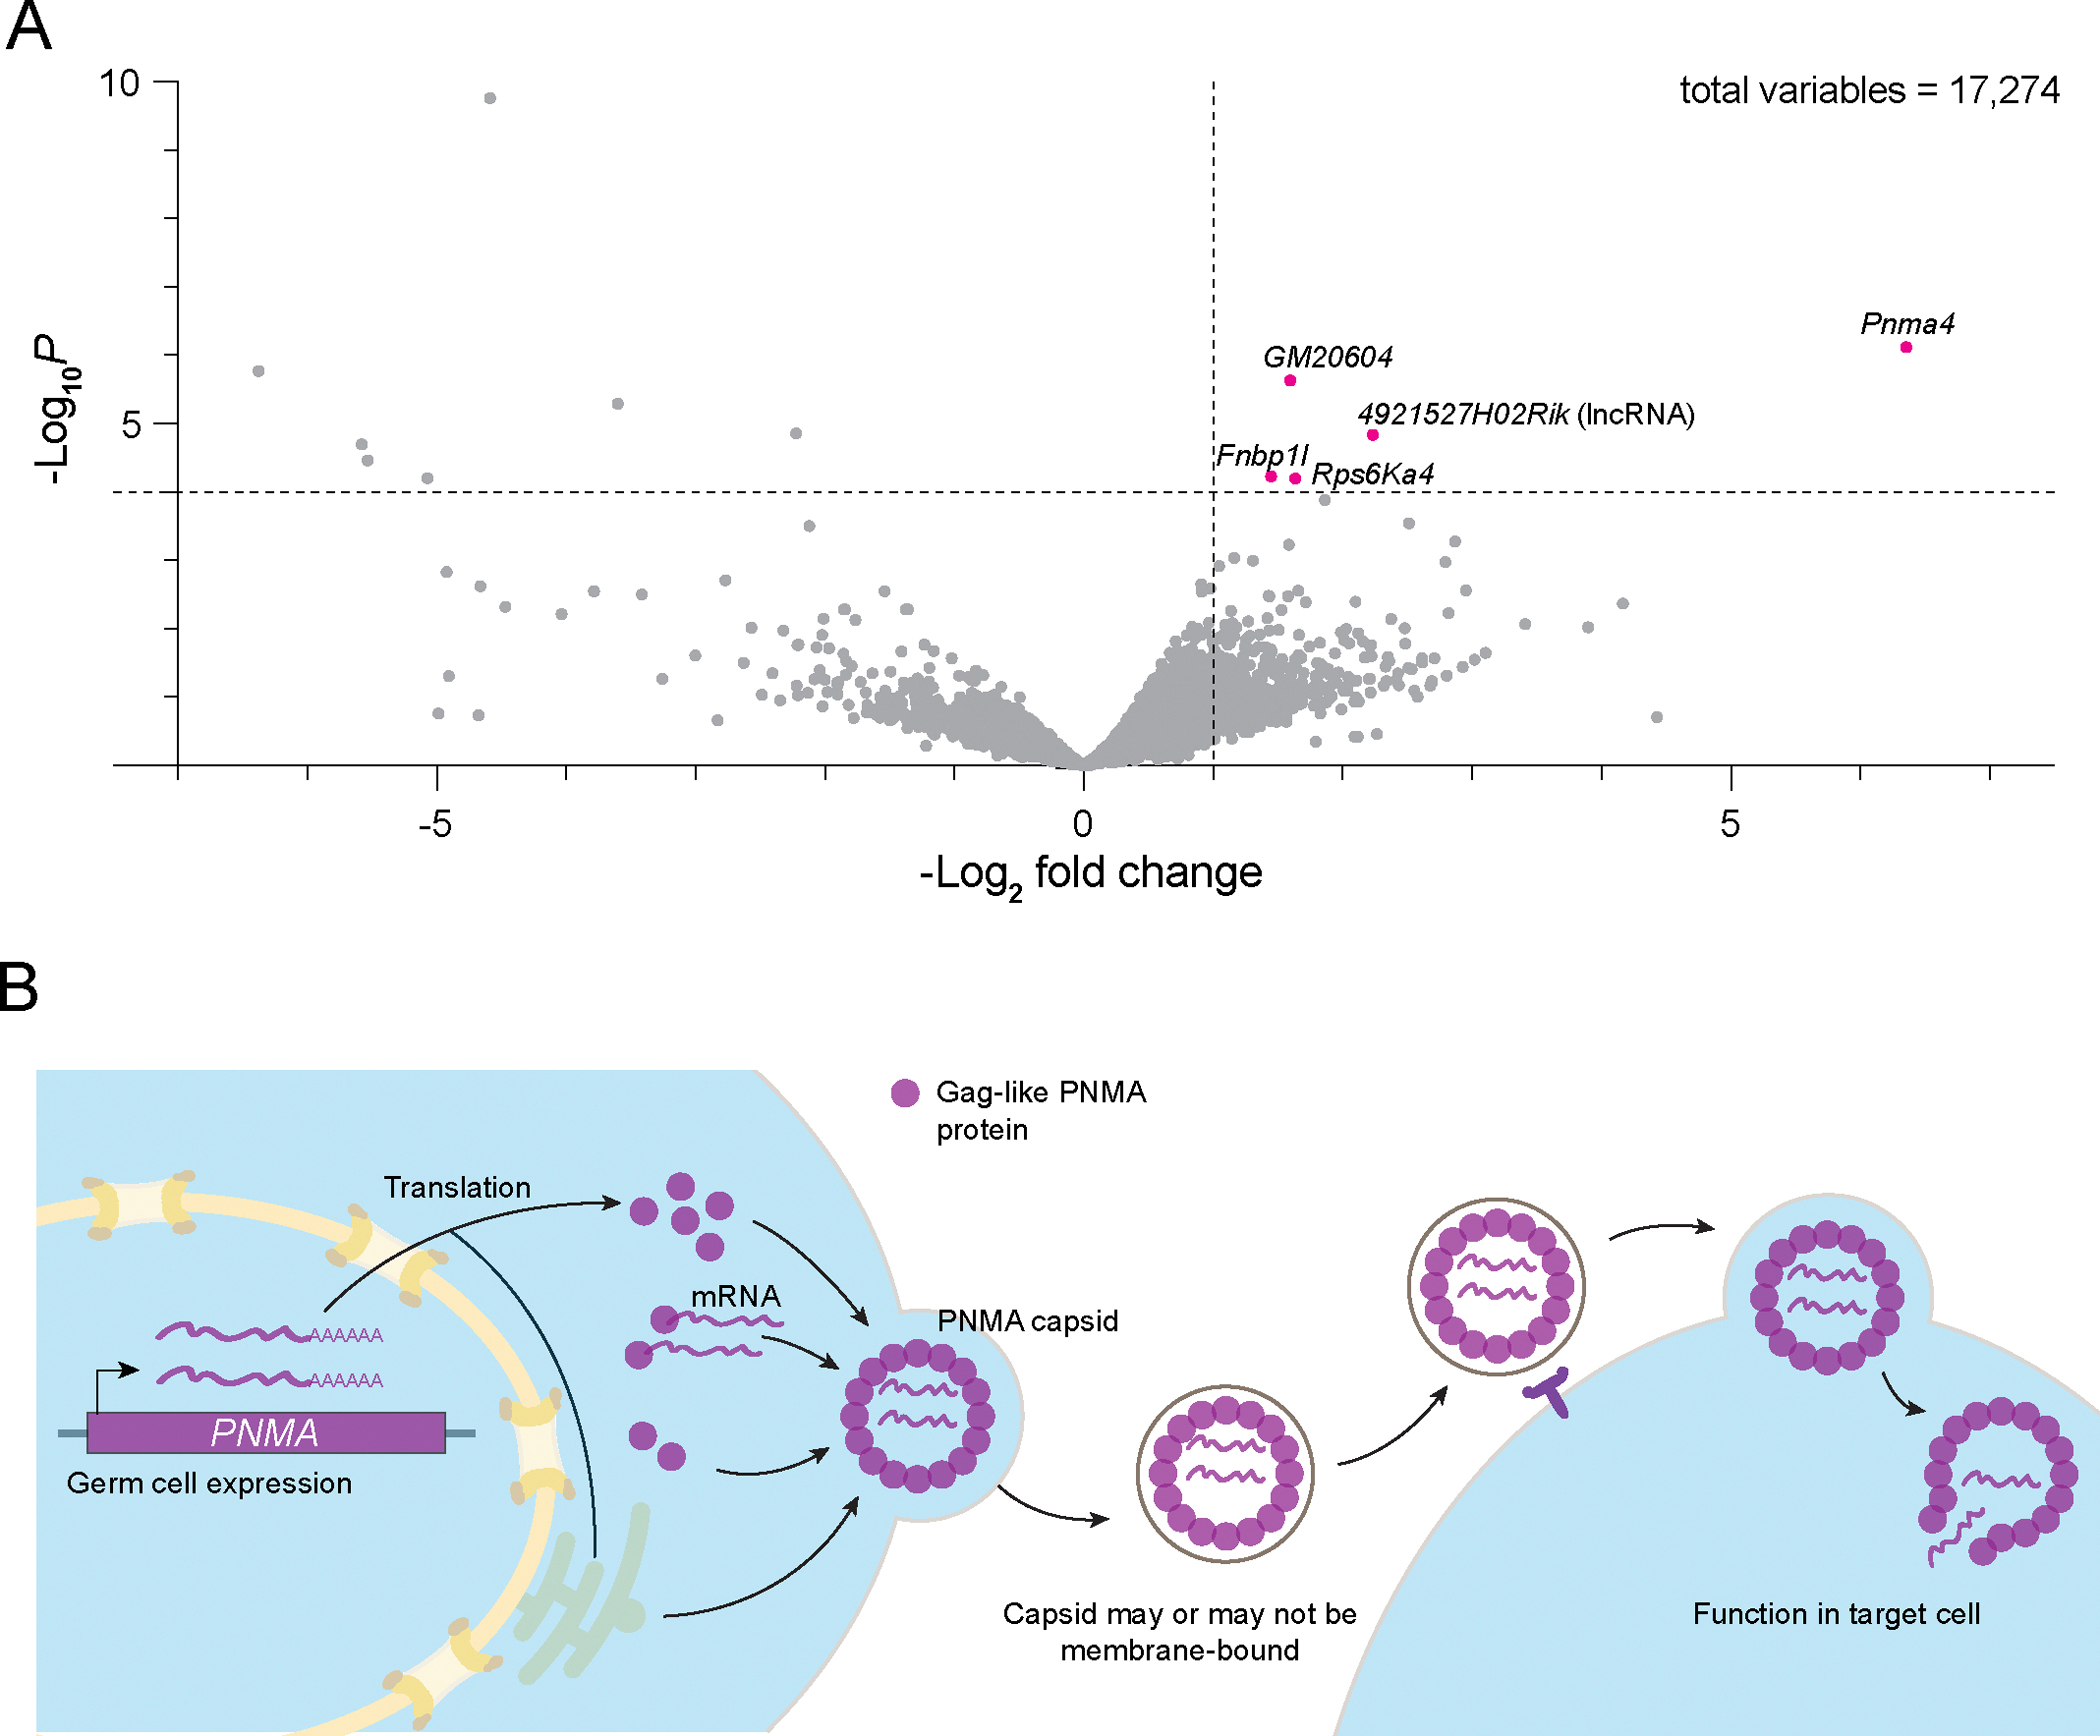
Almost half of the human genome consists of retrotransposons-'parasitic' sequences that insert themselves into the host genome via an RNA intermediate. Although most of these sequences are silenced or mutationally deactivated, they can present opportunities for evolutionary innovation: mutation of a deteriorating retrotransposon can result in a gene that provides a selective advantage to the host in a process termed 'domestication'1-3. The PNMA family of gag-like capsid genes was domesticated from an ancient vertebrate retrotransposon of the Metaviridae clade at least 100 million years ago4,5. PNMA1 and PNMA4 are positively regulated by the master germ cell transcription factors MYBL1 and STRA8, and their transcripts are bound by the translational regulator DAZL during gametogenesis6. This developmental regulation of PNMA1 and PNMA4 expression in gonadal tissue suggested to us that they might serve a reproductive function. Through the analysis of donated human ovaries, genome-wide association studies (GWASs) and mouse models, we found that PNMA1 and PNMA4 are necessary for the maintenance of a normal reproductive lifespan. These proteins self-assemble into capsid-like structures that exit human cells, and we observed large PNMA4 particles in mouse male gonadal tissue that contain RNA and are consistent with capsid formation.


Conflict of interest statement

Competing interests: T.W.P.W., H.B.C. and L.E.B. are co-inventors on a PCT international patent application filed by Columbia University related to this work (PCT/US2024/053329). B.W. is the founder of SurGene, LLC and an inventor on patent applications related to CRISPR–Cas systems and applications thereof. All other authors declare no competing interests.

Figures

Extended Data Fig. 1 |
Extended Data Fig. 1 |. Human gonadal expression of PNMA2, PNMA3, and PNMA5.
(a) Analysis of uniquely mapping single-cell RNAseq reads for PNMA2, PNMA3, and PNMA5 loci expressed in spermatogonial stem cells (SSC), differentiating spermatogonia (Dif. Sp.), leptotene spermatocytes (Lepto.), grouped zygotene/pachytene/diplotene spermatocytes (ZPD), transitional spermatocytes (Trans.), post-meiotic spermatids (PMS), Leydig cells, Sertoli cells, and macrophages (data from Wang et al., N = 8 donors 27–60 years of age). (b) Ovaries from reproductively young (23–29 years, magenta, N = 4) and reproductively old (49–54 years, gray, N = 4) donors were analyzed by single-nuclei RNAseq. Uniquely mapping reads for PNMA2, PNMA3, and PNMA5 loci were assigned to ovarian tissue types based on clustering analysis. Statistical significance was determined by Mann-Whitney test (all comparisons were not significant).
Extended Data Fig. 2 |
Extended Data Fig. 2 |. PNMA1 and PNMA4 can be post-transcriptionally regulated by DAZL and are evolutionarily conserved.
(a) 3V5-tagged PNMA1, PNMA4, or SMC1B (positive control DAZL target) expression plasmids were transfected into HEK-293T cells with and without DAZL co-transfection. (b, c) Protein levels (b) of PNMA1, PNMA4, SMC1B, DAZL, and α-tubulin (loading) were analyzed by immunoblot and PNMA1 and PNMA4 mRNA levels (c) were analyzed by Northern blot. This experiment was repeated independently 3 times with similar results. (d, e) Architecture of the human PNMA1 and PNMA4. Loci are colored according to domains: capsid domain (CA, magenta), linker (L, lilac), and RNA-binding domain (RBD, purple). The promoter (green) and transcription start sites are shown using arrows. A black triangle on the phylogenetic tree (left) indicates the point of the first expansion of the ancestral PNMA locus leading to PNMA1–5. PNMA1 is universally retained across placental mammals as an intact gene, whereas PNMA4 has experienced lineage-specific pseudogenization (boxed x’s). Conservation at each amino acid is shown with a vertical black line for fifteen eutherian mammals, three marsupials, and two vertebrate outgroups. The histone modification for active transcription (H3K27Ac) in humans is shown along the bottom.
Extended Data Fig. 3 |
Extended Data Fig. 3 |. Generation of Pnma1−/− and Pnma4−/− mouse knockouts.
(a) Pnma1 and Pnma4 deletions were generated by CRISPR/Cas9 genome editing (sgRNA target sites shown in dashed lines). Successful deletion was assessed by PCR/sequencing. Shown are chromosomal coordinates, annotated transcripts (CDS in navy, UTRs in cyan, and introns in white), deleted regions, and sequencing reads (below, maroon) confirming deletion of Pnma1 and Pnma4. (b, c) Analysis of mRNA and protein produced in the Pnma1−/− and Pnma4−/− mutants. A testis was dissected from 3-month wild type (C57BL/6 J), Pnma1−/−, and Pnma4−/− mice. Lysate was prepared and split for mRNA and protein analysis. (b) Analysis of Pnma1 and Pnma4 mRNA levels by qPCR (n = 3 replicates). (c) Analysis of PNMA1, PNMA4, and α-tubulin (loading) protein levels by immunoblot. Shown below is a quantification of the ratio of PNMA1 and PNMA4 in knockouts vs. wild type (set to 1) from n = 3 biological replicates. ** denotes presence of an unfortunate cross-reacting band present in all lanes of the α-PNMA4 immunoblot. Error bars indicate SEM. (d) Male wild type mice (gray), Pnma1−/− (cyan), or Pnma4−/− (purple) were crossed biweekly to CF-1 female fertility tester mice (N = 5 pairs for each genotype-timepoint combination). (e) Female wild type mice (gray), Pnma1−/− (cyan), or Pnma4−/− (purple) were crossed to B6D21/J male fertility tester mice (N = 5 pairs for each genotype-timepoint combination). Pup numbers for each cross were recorded. This is the same experiment used to generate the data in Figs. 2a and 3a, but here average pup count per litter is plotted. Statistical significance was determined by student’s t-test (n.s. p > 0.05, * p ≤ 0.05, ** p ≤ 0.01, *** p ≤ 0.001). Error bars indicate SEM. Exact p-values available in source data.
Extended Data Fig. 4 |
Extended Data Fig. 4 |. Mice lacking Pnma1 or Pnma4 exhibit normal neurobehavioral and muscular traits.
(a-g) Six-month-old male wild type (N = 11), Pnma1−/− (N = 11), Pnma4−/− (N = 8), and Pnma1−/− Pnma4−/− double mutant mice (N = 11) were tested in a panel of behavioral assays. (a) Short-term memory was assessed using the spontaneous alternation percentage in a Y maze. (b) Long-term memory was assessed with the fear conditioning test. (c-e) The open field test was used to assess indicators of anxiety (c, center time) and hyperactivity (d, distance travelled and e, vertical counts). (f) We assessed muscle strength by measuring inverted hang time on a grid and (g) grip strength force. All graphs indicate mean +/− SEM. Statistical significance was assessed by multiple t-test analysis with correction for multiple comparisons or one-way ANOVA with correction for multiple comparisons (n.s. p > 0.05, * p ≤ 0.05, ** p ≤ 0.01).
Extended Data Fig. 5 |
Extended Data Fig. 5 |. Defective testicular and ovarian characteristics in Pnma1 and Pnma4 mutants.
(a) Representative PAS-stained testis sections by age. Quantified in Fig. 2. (b) Representative PAS-stained ovary sections by age. Quantified in Fig. 3 and Extended Data Fig. 6. (c, d) Testes were fixed, paraffin embedded, and sectioned. Sections from 12-month samples were analyzed by TUNEL and DAPI staining. (a) Images and (b) quantifications (from n wild type-like tubules) of PLZF-positive cells (red arrows) are shown. Statistical significance was determined by Mann-Whitney test and exact p-values are shown. Error bars indicate SD.
Extended Data Fig. 6 |
Extended Data Fig. 6 |. Several ovarian features are not dramatically altered in Pnma1 and Pnma4 mutants.
(a-e) Ovaries from control (pooled wild type and heterozygote, gray), Pnma1−/− (cyan), Pnma4−/− (purple), or Pnma1−/− Pnma4−/− double mutant (red) mice were fixed, embedded, and PAS-stained. The following features were quantified per unit area (mm2) at the indicated times: (a) primary follicles, (b) secondary follicles, (c) corpora lutea, (d) post-ovulation follicles, and (e) atretic follicles. Statistical significance was determined by determined by one-way ANOVA with correction for multiple comparisons. Error bars indicate SEM. (f-i) GV oocytes were collected from ovaries of two-month-old wild-type and Pnma1−/− Pnma4−/− mice. We then injected mRNA encoding mClover-MAP4 (microtubule-binding protein) and H2B-mScarlet (histone) and imaged oocytes live for ~18 hours. (f) Representative images of the first meiotic division from the metaphase I (MI) plate (t = 0 min) to anaphase I (AI, t = 20 min). Misaligned chromosomes were counted at t = 0 min and lagging chromosomes at t = 12 min. (g) Time in hours (hr) between nuclear envelop breakdown to AI onset. (h) AI lagging chromosome quantification. (i) Misaligned chromosomes at on MI plate quantification ( J) Misaligned chromosomes at on MII plate quantification (4 hours after meiosis I completion). (k, l) Continued data from Fig. 3. As in f-j, but GV oocytes were collected at 7 months. (k) Misaligned chromosomes at on MI plate quantification. (l) Misaligned chromosomes at on MII plate quantification (4 hours after meiosis I completion). Statistical significance was determined by determined by student’s t-test. Error bars indicate SEM (n.s. p > 0.05, * p ≤ 0.05).
Extended Data Fig. 7 |
Extended Data Fig. 7 |. Single-cell analysis of Pnma1–5 expression in aging mouse ovaries.
Ovaries from young (4.5 month, magenta, N = 5), peri-estropause (10.5 month, orange, N = 7), and post-estropause (15.5 month, gray, N = 5) wild type C57BL/6 J mice were analyzed by single-cell RNAseq. Uniquely mapping reads for Pnma1–5 loci were assigned to ovarian tissue types based on clustering analysis. Note that the majority of values = 0 and lie underneath the x axis. Total n of each cell type and percentage of positive cells is indicated above the plots. Statistical significance was determined by Mann-Whitney test (n.s. p > 0.05, exact p-values are provided for significant comparisons up to p < 0.0001). Error bars indicate SEM. Comparisons were not run between conditions with no positive cells.
Extended Data Fig. 8 |
Extended Data Fig. 8 |. Pnma1 and Pnma4 are expressed in subpopulations of mouse ovarian cells.
(a, b) Single cell RNA-seq was performed in n = 8 ovaries from adult C57BL/6 J mice. (a) UMAP plot showing distinct ovarian cell populations represented by different colors with Pnma1 and Pnma4-positive cells denoted in black. (b) Average expression of Pnma1 and Pnma4 by sample across different ovarian cell populations. Statistical significance was determined by one-way ANOVA followed by Tukey’s post-hoc test. Significant differences were defined at P < 0.05. (n.s. p > 0.05, * p ≤ 0.05, ** p ≤ 0.01, *** p ≤ 0.001). Error bars indicate SEM.
Extended Data Fig. 9 |
Extended Data Fig. 9 |. PNMA1 and PNMA4 form capsid-sized particles.
(a, b) His-tagged PNMA1 (a) and PNMA4 (b) were expressed in E. coli and affinity purified on nickel resin. Imidazole elutions (15 ml) were concentrated and run over a Superose 6 (HiScale 80 ml) size exclusion column. Shown are UV absorbance traces of the run and Coomassie-stained SDS-PAGE of the fractions. The fractions used for TEM are noted in red. (c) Experimental setup: 3V5-tagged PNMA1, PNMA4, and ARC (control exported VLP) expression plasmids were transfected into HEK-293T cells. mCherry (control non-capsid) was co-expressed from the transfected plasmid. Cells were collected and lysed. Lysates were fractionated on 10–50% sucrose density gradients with continuous monitoring at 260 nm. (d) PNMA1, PNMA4, ARC (anti-V5), and mCherry protein levels in each fraction were analyzed by immunoblot. This experiment was repeated independently 3 times with similar results.
Extended Data Fig. 10 |
Extended Data Fig. 10 |. PNMA4 packages its own mRNA in a capsid-like particle.
(a) Lysate was prepared from eight testes (collected at 3 months) from either wild type or control (lacking Pnma4) mice (3 biological replicates each). Lysate was fractionated by velocity (247,000 g, 3 hours) over a double sucrose cushion (25% and 70%). The 70% meniscus was further fractionated by isopycnic centrifugation on an iodixanol step gradient. PNMA4 was IPed from iodixanol fractions 8 and 9, RNA was extracted IP beads, and sequenced. Shown is a volcano plot of log2 fold change plotted against -log10 p-value of RNA-seq reads comparing wild type and controls. Values represent a ratio of enrichment between the wild type and control IPs. The further right the value, the more enriched the mRNA in the wild type IP. Genes with a log2 fold change greater than 1 and an enrichment p-value of less than 10e-4 are colored magenta. (b) Model for PNMA1 and PNMA4 function.
Fig. 1 |
Fig. 1 |. PNMA1 and PNMA4 are expressed in human gonadal tissue.
a, Analysis of uniquely mapping single-cell RNA sequening reads for PNMA1–PNMA5 loci expressed in MII human oocytes (data from Yuan et al. and Zhang et al., N = 13 donors 24–32 years of age (83 oocytes)),. b, Analysis of uniquely mapping single-cell RNA sequencing reads for PNMA1 and PNMA4 loci expressed in spermatogonial stem cells (SSCs), differentiating spermatogonia (Dif. Sp.), leptotene spermatocytes (Lepto.), grouped zygotene/pachytene/diplotene spermatocytes (ZPDs), transitional spermatocytes (Trans.), post-meiotic spermatids (PMSs), Leydig cells, Sertoli cells and macrophages (data from Wang et al., N = 8 donors 27–60 years of age). c, Human ovaries from young (23–29 years of age, N = 4) and older (49–54 years of age, N = 4) donors were analyzed by single-nuclei RNA sequencing. Uniquely mapping reads for PNMA1 and PNMA4 loci were assigned to ovarian tissue types based on clustering analysis. Note that the majority of values = 0 and lie underneath the x axis. Total n of each cell type and percentage of positive cells are indicated above the plots. Statistical significance was determined by Mann–Whitney test (NS P > 0.05; exact P values are provided for significant results up to P < 0.0001, which is indicated as ****). Error bars indicate s.e.m.
Fig. 2 |
Fig. 2 |. Male mice lacking Pnma1 or Pnma4 prematurely lose reproductive capacity.
a, Wild-type male control mice (gray), Pnma1−/− (cyan), Pnma4−/− (purple) or Pnma1−/−Pnma4−/− double mutant (red) were crossed biweekly to CF-1 female fertility tester mice (N = 5 pairs for each genotype–timepoint combination). Pup numbers for each cross were recorded. b,c, Testes (n above graph) from control (pooled wild-type and heterozygous, gray), Pnma1−/− (cyan), Pnma4−/− (purple) or Pnma1−/−Pnma4−/− double mutant (red) mice were weighed. Representative images and quantifications are shown. d, Sperm counts from dissected cauda epididymides. The number of individuals (N) for each genotype and age is shown above. e, Serum testosterone (from N individual males) at the indicated ages. f, PAS-stained tubule sections from 6-month-old mouse testes; devoid tubules are indicated by yellow arrowheads. g, Devoid tubules (from n testes) as percentage of total. h, Sections from 12-month-old testes were analyzed by TUNEL and DAPI staining. TUNEL-positive cells are indicated by yellow arrowheads. i, Percent TUNEL-positive cells per tubule (n indicated by genotype to the right). Statistical significance was determined by one-way ANOVA with correction for multiple comparisons and Student’s t-test (NS P > 0.05, *P ≤ 0.05, **P ≤ 0.01, ***P ≤ 0.001, ****P ≤ 0.0001). Error bars indicate s.e.m. Exact P values are available in the Source Data.
Fig. 3 |
Fig. 3 |. Female mice lacking Pnma1 or Pnma4 have age-dependent reproductive defects.
a, Wild-type female control mice (gray), Pnma1−/− (cyan), Pnma4−/− (purple) or Pnma1−/−Pnma4−/− double mutant (red) were crossed to B6D21/J male fertility tester mice (N = 5 pairs for each genotype–timepoint combination). Pup numbers for each cross are plotted over time. b, PAS-stained ovarian sections from 3-month-old mouse ovaries. Black arrows denote antral follicles; yellow arrows denote abnormal follicles; and green arrows denote follicular cysts. c, Representative images of ovaries from the four genotypes. d, Ovaries (n above graph) from control (pooled wild-type and heterozygous, gray), Pnma1−/− (cyan), Pnma4−/− (purple) or Pnma1−/−Pnma4−/− double mutant (red) mice were weighed. e, The number of antral follicles at the indicated ages per mm2. The number of individuals (N) for each genotype and age is shown. f, The number of follicular cysts per mm2 by age and genotype (n values in graph). g, Germinal vesicle (GV) oocytes were collected from 6-month-old females and meiotically induced. Meiotic progression was analyzed by tubulin immunofluorescence. Percentage of meiosis II oocytes was recorded. h, GV oocytes were collected from 7-month-old wild-type and double mutant mouse ovaries. We injected mRNA encoding mClover–MAP4 (microtubule-binding protein) and H2B–mScarlet (histone) and imaged oocytes live for approximately 18 h, recording the time from nuclear envelope breakdown (NEBD) to anaphase I (i) and lagging chromosome counts (j). Statistical significance was determined by one-way ANOVA with correction for multiple comparisons and Student’s t-test (NS P > 0.05, *P ≤ 0.05, **P ≤ 0.01, ***P ≤ 0.001, ****P ≤ 0.0001). Error bars indicate s.e.m. Exact P values are available in the Source Data.
Fig. 4 |
Fig. 4 |. PNMA proteins form capsid-like structures in situ that exit cells and contain mRNA.
a,b, Top, TEM micrographs of negatively stained recombinant PNMA1 (a) and PNMA4 (b) protein. Bottom, 2D class averages from cryoSPARC. c, Experimental setup: 3V5-tagged PNMA1 or PNMA4 expression plasmids were transfected into HEK293T cells. mCherry (control non-capsid) was co-expressed from the transfected plasmid. Culture medium was collected, spun and filtered to remove cells and debris. Filtered medium was first fractionated over a 100-kDa MWCO filter. The >100-kDa fraction was collected and fractionated by velocity (247,000g, 3 h) over a double sucrose cushion (25% and 70%). Capsid-like structures migrate to the interface between 25% and 70% sucrose (70% meniscus). Lipids, >100-kDa spun medium, 25% meniscus, 25% sucrose, 70% meniscus, 70% sucrose and pellet fractions were collected. Cell lysate samples were also collected. d, PNMA1, PNMA4, (anti-V5) and mCherry protein levels in each fraction were determined by immunoblot. This experiment was repeated independently over 10 times with similar results. e, Experimental setup: lysate was prepared from eight testes (collected at ~3 months) from either wild-type (WT) C57BL6/J or Pnma4−/− (knockout, KO) mice. Lysate was fractionated by velocity (247,000g, 3 h) over a double sucrose cushion (25% and 70%). The interface between 25% and 70% sucrose (70% meniscus) was further fractionated by isopycnic (equilibrium) centrifugation on an iodixanol step gradient; the photograph shows the centrifuge tube after this step. f, PNMA4, MLV p30 Gag and GAPDH protein levels were determined by immunoblot in each fraction at the end of a double sucrose fractionation (top) and iodixanol fractionation (bottom). This experiment was repeated independently five times with similar results. g, PNMA4 was immunoprecipitated (IP) from iodixanol fractions 8 and 9, and RNA was extracted from beads and residual lysate (unbound). Pnma4 mRNA levels were determined by qPCR in wild-type and Pnma4−/− lysates (n = 3 biological replicates) and in anti-PNMA4 IP and anti-PNMA4 unbound samples (n = 2 biological replicates). Error bars indicate s.e.m.

Update of

References

    1. Kaneko-Ishino T & Ishino F The role of genes domesticated from LTR retrotransposons and retroviruses in mammals. Front. Microbiol 3, 262 (2012). - PMC - PubMed
    1. Jangam D, Feschotte C & Betrán E Transposable element domestication as an adaptation to evolutionary conflicts. Trends Genet. 33, 817–831 (2017). - PMC - PubMed
    1. Naville M et al. Not so bad after all: retroviruses and long terminal repeat retrotransposons as a source of new genes in vertebrates. Clin. Microbiol. Infect. 22, 312–323 (2016). - PubMed
    1. Kokošar J & Kordiš D Genesis and regulatory wiring of retroelement-derived domesticated genes: a phylogenomic perspective. Mol. Biol. Evol. 30, 1015–1031 (2013). - PMC - PubMed
    1. Henriques WS et al. The diverse evolutionary histories of domesticated metaviral capsid genes in mammals. Mol. Biol. Evol. 41, msae061 (2024). - PMC - PubMed

LinkOut - more resources