. 2025 Apr 22;53(8):gkaf312.
doi: 10.1093/nar/gkaf312.

HU promotes higher order chromosome organization and influences DNA replication rates in Streptococcus pneumoniae

Affiliations

HU promotes higher order chromosome organization and influences DNA replication rates in Streptococcus pneumoniae

Maria-Vittoria Mazzuoli et al. Nucleic Acids Res. .

Abstract

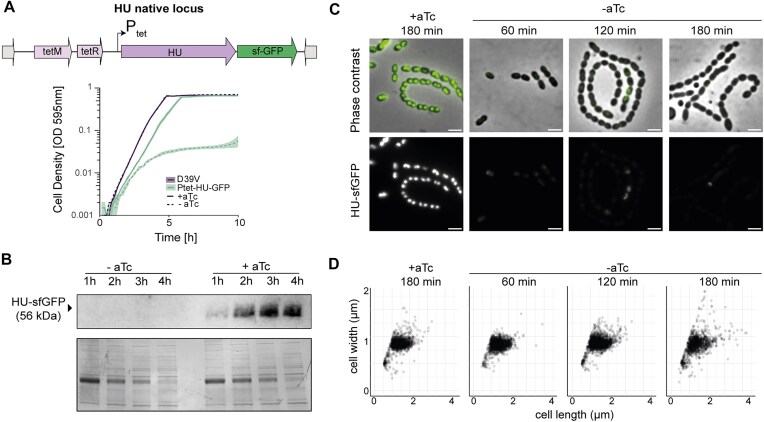
Nucleoid-associated proteins (NAPs) are crucial for maintaining chromosomal compaction and architecture, and are actively involved in DNA replication, recombination, repair, and gene regulation. In Streptococcus pneumoniae, the role of the highly conserved NAP HU in chromosome conformation has not yet been investigated. Here, we use a multi-scale approach to explore HU's role in chromosome conformation and segregation dynamics. By combining superresolution microscopy and whole-genome-binding analysis, we describe the nucleoid as a dynamic structure where HU binds transiently across the entire nucleoid, with a preference for the origin of replication over the terminus. Reducing cellular HU levels impacts nucleoid maintenance and disrupts nucleoid scaling with cell size, similar to the distortion caused by fluoroquinolones, supporting its requirement for maintaining DNA supercoiling. Furthermore, in cells lacking HU, the replication machinery is misplaced, preventing cells from initiating and proceeding with ongoing replication. Chromosome conformation capture coupled to deep sequencing (Hi-C) revealed that HU is required to maintain cohesion between the two chromosomal arms, similar to the structural maintenance of chromosome complex. Together, we show that by promoting long-range chromosome interactions and supporting the architecture of the domain encompassing the origin, HU is essential for chromosome integrity and the intimately related processes of replication and segregation.


Conflict of interest statement

None declared.

Figures

Graphical Abstract
Graphical Abstract
Figure 1.
Figure 1.
A dynamic, compact nucleoid robustly scales with cell size. (A) Deconvolved epi-fluorescence microscopy images of HU–sfGFP and the chromosome stained with DAPI show a near-perfect overlap. (B) Representative images of PALM microscopy reconstructions of 5 cells with increasing cell sizes. PALM reconstructions of experiment detecting HU-mEos3.2. Scale bar: 0.5 μm. Dashed lines: cell outline, drawn by hand from DIC images. (C) Time-lapse sequence of HU–sfGFP imaged using SIM, mid-section of 3D-SIM experiment. Images taken every 10 min, scale bar 0.5 micron. (D) MDS over time of HU-meos3.2. HU-meos3.2 recorded using PALM, particles were tracked, and collective MSD was calculated using iSBatch [41]. Apparent diffusion coefficient for the short time intervals was calculated by determining the linear slope between 0 and 0.5 s. Shade = standard error.
Figure 2.
Figure 2.
HU-binding profile and correlation with active transcription and GC content. (A) HU-binding profile obtained by ChIP-Seq. Normalized counts (IP/mock) binned per 100 base pairs obtained for the immunoprecipitated HU–sfGFP sample over the mock (wild-type) sample are plotted against the chromosomal coordinates. Significant (q-value < 0.05) peaks detected by MACS2 are depicted. Position of origin and terminus of replication are indicated on top of the graph. Note the asymmetric distribution of the left and right arms of the chromosome due to a chromosomal inversion in strain D39V. (B) HU occupancy peak size per position on the chromosome. (C) RpoB version HU occupancy (IP/mock reads per 1000 base pairs normalized with total reads). Pearson’s R = 0.24. (D) HU occupancy (IP/mock reads per 1000 base pairs normalized with total reads) versus GC content (%).
Figure 3.
Figure 3.
HU depletion kinetics and effects on cell morphology. (A) Overview of HU depletion strategy. The native HU promoter Phu was replaced with a Ptet promoter at the native locus. A selection marker (tetM) was added upstream, as well as tetR for aTc induction. Growth curves of cells with HU depletion (Ptet–HU–sfGFP) (−aTc) indicate a strong growth defect. (B) Depletion kinetics of Ptet–HU–sfGFP by immunoblot (anti-GFP antibody) at one, two, three and four h of depletion. Coomassie blue staining was used as a loading control (bottom). (C) Depletion kinetics of Ptet–HU–sfGFP by fluorescence microscopy. HU–sfGFP expression is drastically reduced after 1 h of depletion. Top: composite of HU–sfGFP and phase-contrast. Bottom: HU–sfGFP. Scale bar: 2 μm. (D) Distribution of cell width and length of HU-depleted cells.
Figure 4.
Figure 4.
Depletion of HU strongly affects chromosome maintenance and NC scaling. (A) Fluorescence microscopy of HU-depleted cells stained with DAPI and imaged immediately afterwards. Scale bar: 2 μm. Cell area and nucleoid area were segmented from phase-contrast (cells) and fluorescence (nucleoids) with Oufti. (B) Percentage of cells lacking a nucleoid increases with time (55% after 3 h of depletion). (C) Nucleoid to cell area (NC) for HU-depletion strain grown in the presence (Control) and absence of aTc for 1 (T1), 2 (T2), and 3 h (T3). (D) Growth of HU-depletion strain in presence and absence of the inducer and with sub-MIC concentrations of HPUra (0.1 μg/ml) and CIP (0.2 μg/ml) E. Representative images of cells carrying hu::hu-mKate2 grown with sub-MIC concentrations of CIP or HPUra, scale bar: 3 μm. (F) NC ratios are distorted in cells treated with CIP but not in cells treated with HPUra.
Figure 5.
Figure 5.
HU and SMC promote long-range chromosome folding. (A) Normalized Hi-C contact maps of HU-complemented cells (+aTc) at 5-kb resolution. Position of the origin and terminus of replication are depicted. (B) Normalized Hi-C contact maps of HU-depletion strain grown in the absence of aTc (3 h depletion) at 5-kb resolution. (C) Magnification of the origin on the left replichore (left panel) and terminus regions (right panel). Ori-, ter-, and parS-binding sites are depicted. (D) Normalized map of Δsmc at 5-kb resolution. (E) Differential contact maps corresponding to the log2 ratio of Hi-C interactions between WT and cells lacking HU or SMC and between cells lacking HU and SMC. The blue/red colour scale reflects the enrichment in contacts in one population with respect to the other.
Figure 6.
Figure 6.
HU-depleted cells progressively stop replication. (A) Genome-wide marker frequency analysis. Sequencing reads coverage over the genome sequence of exponentially growing cells in the presence of aTc (on the left) and at one, two, and three h of depletion. The replication rate of the population is indicated by the ratio of coverage at the origin (‘peak’) to the terminus (‘trough’) of replication. The origin and terminus position are determined based on cumulative GC skew. (B) DnaX-mKate2 localization in cells depleted for HU (−aTc) for 180 min and non-depleted cells (+aTc). Left to right: composite (phase: grey, DAPI: blue, DnaX-mKate2: pink), DAPI, DnaX-mKate2. (C) Kymograph (left) with graphical representation (right). In cells with HU, DnaX is localized at mid-cell and migrates towards the new septa during growth (+aTc, total cells = 313). In cells depleted for HU for 180 min (−aTc, total cells = 705), DnaX is mislocalized.
Figure 7.
Figure 7.
HU is a major structural component essential for chromosome conformation, DNA replication, and chromosome segregation. (A) Genetic interaction network of HU as determined by dual-CRISPRi-Seq [76]. Epsilon values are indicated, and a threshold of 2 is set and defined as the added fitness effect of the knock-out of two genes on top of the fitness effects caused by the knock-out of those same two genes individually. (B) Growth of knock-down strains obtained by CRISPRi for the DnaA, YabA, CcrZ, and SMC genes in an HU-depletion background. Absence of aTc leads to HU depletion, while presence of IPTG leads to expression of Cas9 and targeted knock-down of each gene.

References

    1. Dame RT, Rashid F-ZM, Grainger DC Chromosome organization in bacteria: mechanistic insights into genome structure and function. Nat Rev Genet. 2020; 21:227–42.10.1038/s41576-019-0185-4. - DOI - PubMed
    1. Bignaud A, Cockram C, Borde C et al. . Transcription-induced domains form the elementary constraining building blocks of bacterial chromosomes. Nat Struct Mol Biol. 2024; 31:489–97.10.1038/s41594-023-01178-2. - DOI - PMC - PubMed
    1. Mäkelä J, Sherratt D SMC complexes organize the bacterial chromosome by lengthwise compaction. Curr Genet. 2020; 66:895–9.10.1007/s00294-020-01076-w. - DOI - PMC - PubMed
    1. Browning DF, Grainger DC, Busby SJ Effects of nucleoid-associated proteins on bacterial chromosome structure and gene expression. Curr Opin Microbiol. 2010; 13:773–80.10.1016/j.mib.2010.09.013. - DOI - PubMed
    1. Ponndara S, Kortebi M, Boccard F et al. . Principles of bacterial genome organization, a conformational point of view. Mol Microbiol. 2025; 123:195–205.10.1111/mmi.15290. - DOI - PMC - PubMed

MeSH terms