. 2025 Apr 22;25(1):160.
doi: 10.1186/s12935-025-03782-2.

Taurochenodeoxycholic acid suppresses the progression of glioblastoma via HMGCS1/HMGCR/GPX4 signaling pathway in vitro and in vivo

Affiliations

Taurochenodeoxycholic acid suppresses the progression of glioblastoma via HMGCS1/HMGCR/GPX4 signaling pathway in vitro and in vivo

Xiumin Xue et al. Cancer Cell Int. .

Abstract

Glioblastoma multiforme (GBM) is the foremost prevalent and highly aggressive intracranial malignancy, which urgently needs safer and more efficacious therapeutic strategies. Our research aimed to investigate the impact and the underlying mechanism of Taurochenodeoxycholic acid (TCDCA) on GBM. In this study, we explored the suppressive effect of TCDCA in vitro by qualification of proliferation and migration assays and flow cytometry, and subsequently predicted the potential anti-GBM mechanism of TCDCA by mRNA sequencing and the following rescue experiments. An orthotopic GBM model in C57BL/6 mice further demonstrated the anti-GBM mechanism of TCDCA. In vitro experiments verified that TCDCA inhibited the growth and migration of GBM cells and induced cell cycle arrest at the G2/M phase. Subsequent mechanism investigations showed that upregulation of HMGCS1 and HMGCR and downregulation of glutathione peroxidase-4 (GPX4) was observed in GBM cells by TCDCA treatment. Notably, inhibitory effects of proliferation and migration as well as induction of ferroptosis by TCDCA were partially restored by Simvastatin (SIN), a competitive HMGCR inhibitor. Furthermore, TCDCA showed an anti-GBM effect in an orthotopic transplantation model in vivo. TCDCA impedes GBM progression by virtue of this intricately orchestrated molecular cascade, through HMGCS1/HMGCR/GPX4 signaling axis, thus unveiling a novel therapeutic avenue warranting further scrutiny in the treatment landscape of GBM.

Keywords: Ferroptosis; Glioblastoma multiforme; HMGCR; Migration; Proliferation; Taurochenodeoxycholic acid.


Conflict of interest statement

Declarations. Ethics approval and consent to participate: The Animal Care and Use Committee at Hangzhou Normal University granted consent to all animal research, and the approval number is HSD20220105. Competing interests: The authors declare no competing interests.

Figures

Fig. 1
Fig. 1
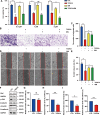
TCDCA inhibited the proliferation and migration of GBM cells. A Molecular structural formula of TCDCA. B, C The cell viability of C6 cells (B) and U251 cells (C) treated with different concentrations of TCDCA detected by CCK-8 assays (n = 5/group, one-way ANOVA, Tukey's test was performed for the multiple comparison). D Representative images of C6 cells treated with 200 μM TCDCA for 1 week in the colony formation assays. Scale bars, 5 mm. E Quantitative analysis of colony number (the surviving colonies > 50 cells) as shown in (D) (n = 3/group, t-test). F Representative images of U251 cells treated with 200 μM TCDCA for 1 week in the colony formation assays. Scale bars, 5 mm. G Quantitative analysis of colony number (the surviving colonies > 10 cells) as shown in (F) (n = 3/group, t-test). H, J Representative images of PH3 staining (red) in C6 cells and U251 cells after treated with vehicle control or 200 μM TCDCA for 48 h. Scale bars, 50 µm. I, K Quantitative analysis of the percentages of PH3+ cells over total C6 cells and U251 cells in one field as shown in (H, J) (n = 15/group, t-test). L, N Representative images of C6 cells and U251 cells treated with 200 μM TCDCA in wound healing assays. Phase-contrast images were acquired at 0 h, 24 h after scratching and representative images of three independent experiments were shown. Scale bars, 200 µm. M, O Quantitative analysis of the wound healing area of C6 cells and U251 cells treated with TCDCA as shown in (L, N) (n = 12/group, t-test). P, R Representative images of C6 cells and U251 cells treated with 200 μM TCDCA for 24 h in Transwell migration assay. Scale bar, 100 µm. Q, S Quantitative analysis of the numbers of migrated C6 cells (n = 15/group, t-test) and U251 cells (n = 15/group, t-test) counted in representative high-power fields per Transwell plate. Data were mean + SEM. *P < 0.05, **P < 0.01
Fig. 2
Fig. 2
TCDCA arrested cell cycle of GBM cells at G2/M phase. A Representative flow cytometry results of cell cycle (A) and quantitative analysis in C6 cells after 200 µM TCDCA treatment for 24 h (B, n = 3/group, t-test). C, D Representative flow cytometry results of cell cycle (C) and quantitative analysis in U251 cells after TCDCA treatment for 24 h (D, n = 3/group, t-test). E The expression of Cyclin B1 in C6 cells was detected after treated with 200 μM TCDCA for 24 h by western blot. F Quantification analysis of the relative Cyclin B1 level as shown in (E) (normalized to control, n = 4/group, Mann–Whitney test). G The expression of Cyclin B1 in U251 cells was detected after treated with 200 μM TCDCA for 24 h by western blot. H Quantification analysis of relative Cyclin B1 level as shown in (G) (normalize to control, n = 4/group, Mann–Whitney test). Data were mean + SEM. *P < 0.05, **P < 0.01
Fig. 3
Fig. 3
TCDCA upregulated lipid biosynthetic process in GBM cells. A, B GO and reactome dot enrichment analysis of genes significantly altered in U251 cells after treatment with 200 μM TCDCA for 24 h. C Representative heat map of the upregulated and downregulated genes in 200 μM TCDCA-treated U251 cells compared with that in the control-treated cells. The depth of red represents the level of gene expression. The expression of several genes such as HMGCS1 and HMGCR were increased significantly. D The volcano plot showing the variation in 200 μM TCDCA-treated U251 cells compared with that in control-treated cells. E The mRNA expression of HMGCS1, ASNS, GADD45A, HMGCR, LDL, MVD, IDI1, CHAC1, ATF3 was detected in U251 cells after treated with 200 μM TCDCA for 24 h by RT-qPCR (n = 3/group, t-test). F The expression of HMGCS1 in U251 cells was detected after treated with 200 μM TCDCA for 24 h by western blot. G The expression of HMGCR in U251 cells was detected after treated with 200 μM TCDCA for 24 h by western blot. H Quantification analysis of the relative HMGCS1 level as shown in (G) (normalized to control, n = 4/group, Mann–Whitney test). I Quantification analysis of the relative HMGCR level (normalize to control, n = 6/group, Mann–Whitney test) as shown in (G). Data were mean + SEM. *P < 0.05, **P < 0.01
Fig. 4
Fig. 4
TCDCA suppressed GBM cells through HMGCS1/HMGCR pathway. A The cell viability of U251 cells treated with different concentrations of 200 μM TCDCA and SIN detected by CCK-8 assays (n = 4/group, two-way ANOVA, Sidak's test was performed for the multiple comparison). B Representative images of U251 cells treated with 200 μM TCDCA and 0.5 μM SIN for 24 h in Transwell migration assay. Scale bar, 100 µm. C Quantitative analysis of the numbers of migrated U251 cells (n = 15/group, two-way ANOVA, Sidak's test was performed for the multiple comparison) and cells counted in representative high-power fields per Transwell plate. D Representative images of U251 cells treated with 200 μM TCDCA and 0.5 μM SIN in wound healing assays. Phase-contrast images were acquired at 0 h, 24 h after scratching and representative images of three independent experiments were shown. Scale bars, 200 µm. E Quantitative analysis of the numbers of migrated U251 cells (n = 15/group, two-way ANOVA, Sidak's test was performed for the multiple comparison) and cells counted in representative high-power fields per Transwell plate. F The expression of FAK, p-FAK, Vimentin and N-cadherin in GL261 cells was detected after treated with 200 μM TCDCA for 24 h by western blot. G–J Quantification analysis of the relative FAK (G), p-FAK (H), Vimentin (I), N-cadherin (J) level as shown in (F) (normalized to control, n = 3/group, t-test). Data were mean + SEM. *P < 0.05, **P < 0.01
Fig. 5
Fig. 5
TCDCA suppressed GBM cells through inducing ferroptosis. A Western blot detected the expression of GPX4 in U251 cells treated with 200 μM TCDCA. B Quantification of the relative level of GPX4 as shown in (A) (n = 4 per group, t-test). C Representative results of ROS analysis in U251 cells after 200 μM TCDCA treatment. D Quantitative analysis of ROS in U251 cells as shown in (C) (n = 3/group, t-test). E The cell viability of U251 cells treated with different concentrations of FER-1 and 200 μM TCDCA detected by CCK-8 assays (n = 4/group, two-way ANOVA, Sidak's test was performed for the multiple comparison). F Representative images of U251 cells treated with 200 μM TCDCA and 1.25 μM FER-1 in wound healing assays. Phase-contrast images were acquired at 0 h, 24 h after scratching and representative images of three independent experiments were shown. Scale bars, 200 µm. G Quantitative analysis of the numbers of migrated U251 cells (n = 15/group, two-way ANOVA, Sidak's test was performed for the multiple comparison) and cells counted in representative high-power fields per Transwell plate. H Representative images of U251 cells treated with 200 μM TCDCA and 1.25 μM FER-1 for 24 h in Transwell migration assay. Scale bar, 100 µm. I Quantitative analysis of the numbers of migrated U251 cells and cells counted in representative high-power fields per Transwell plate (n = 15/group, two-way ANOVA, Sidak's test was performed for the multiple comparison). Data were mean + SEM. *P < 0.05, **P < 0.01
Fig. 6
Fig. 6
TCDCA induced ferroptosis of GBM cells through HMGCS1-HMGCR-GPX4 pathway. A Western blot detected the expression of HMGCS1, HMGCR and GPX4 in U251 cells treated with 200 μM TCDCA and SIN. B–D Quantification of the relative level of HMGCR (B), HMGCR (B) (normalized to control, n = 5/per group, two-way ANOVA, Sidak's test) and GPX4 (C) (normalized to control, n = 6/per group, two-way ANOVA, Sidak's test) and HMGCS1 (D) (n = 6/per group, two-way ANOVA, Sidak's test) as shown in (A). E Representative results of ROS analysis in U251 cells after 200 μM TCDCA and 0.5 μM SIN treatment. F Quantitative analysis of ROS in U251 cells (n = 3/group, two-way ANOVA, Sidak's test) as shown in (E). G Quantification of the relative level of GSH (n = 3/group, two-way ANOVA, Sidak's test). Data were mean + SEM. *P < 0.05, **P < 0.01
Fig. 7
Fig. 7
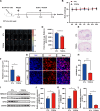
TCDCA inhibited the growth of GBM in vivo. A Experimental Scheme for orthotopic GBM mice model. B The body weight of the tumor-bearing mice was monitored every day (n = 6 mice, per group). C Bioluminescent imaging of disseminated GL261-Luc orthotopic xenograft mice at different time points posttreatment with TCDCA and the control. D Fold change in average radiance mouse at experimental endpoint was analyzed for each treatment group (n = 6/group, t-test). E Representative images of HE staining of whole-brain sections from TCDCA and control-treated group. Scale bar, 1 mm. F Quantification analysis of the area of GBM in (E) (normalized to control, n = 4/group, t-test). G Representative images of Ki67 staining of whole-brain sections from TCDCA and control-treated group. Scale bar, 20 μm. H Quantification analysis of the area of GBM in (G) (normalized to control, n = 9/group, t-test) I Western blot detected the expression of HMGCS1, HMGCR and GPX4 in orthotopic tumor tissue. J–L Quantification of the relative level of HMGCS1 (J), HMGCR (K) and GPX4 (L) as shown in (G) (normalized to control, n = 4/per group, t-test). Data were mean + SEM. ****P < 0.0001, *P < 0.05
Fig. 8
Fig. 8
A working model of TCDCA in GBM cells. TCDCA suppresses the progression of GBM via HMGCS1/HMGCR/GPX4 signaling axis, which may result in inhibiting the tumorigenesis, including inhibition of cell proliferation, migration, and induction of the apoptosis and cell cycle arrest both in vitro and in vivo

Similar articles

References

    1. Tan AC, et al. Management of glioblastoma: state of the art and future directions. CA Cancer J Clin. 2020;70(4):299–312. - PubMed
    1. Wirsching H-G, Galanis E, Weller M. Glioblastoma. In Gliomas. 2016. p. 381–397. - PubMed
    1. DeCordova S, et al. Molecular heterogeneity and immunosuppressive microenvironment in glioblastoma. Front Immunol. 2020;11:1402. - PMC - PubMed
    1. Sun S, et al. Atractylon inhibits the tumorigenesis of glioblastoma through SIRT3 signaling. Am J Cancer Res. 2022;12(5):2310–22. - PMC - PubMed
    1. Martikainen M, Essand M. Virus-based immunotherapy of glioblastoma. Cancers (Basel). 2019. 10.3390/cancers11020186. - PMC - PubMed

LinkOut - more resources