

Identifying PSIP1 as a critical R-loop regulator in osteosarcoma via machine-learning and multi-omics analysis
- PMID: 40264164
- PMCID: PMC12016182
- DOI: 10.1186/s12935-025-03775-1
Identifying PSIP1 as a critical R-loop regulator in osteosarcoma via machine-learning and multi-omics analysis
Abstract
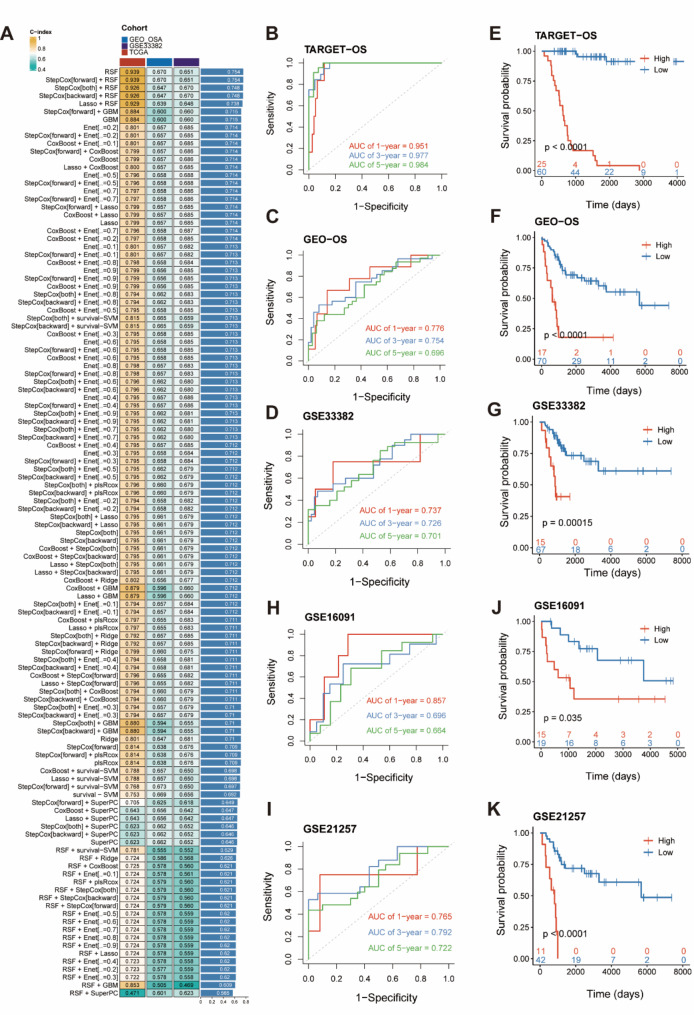
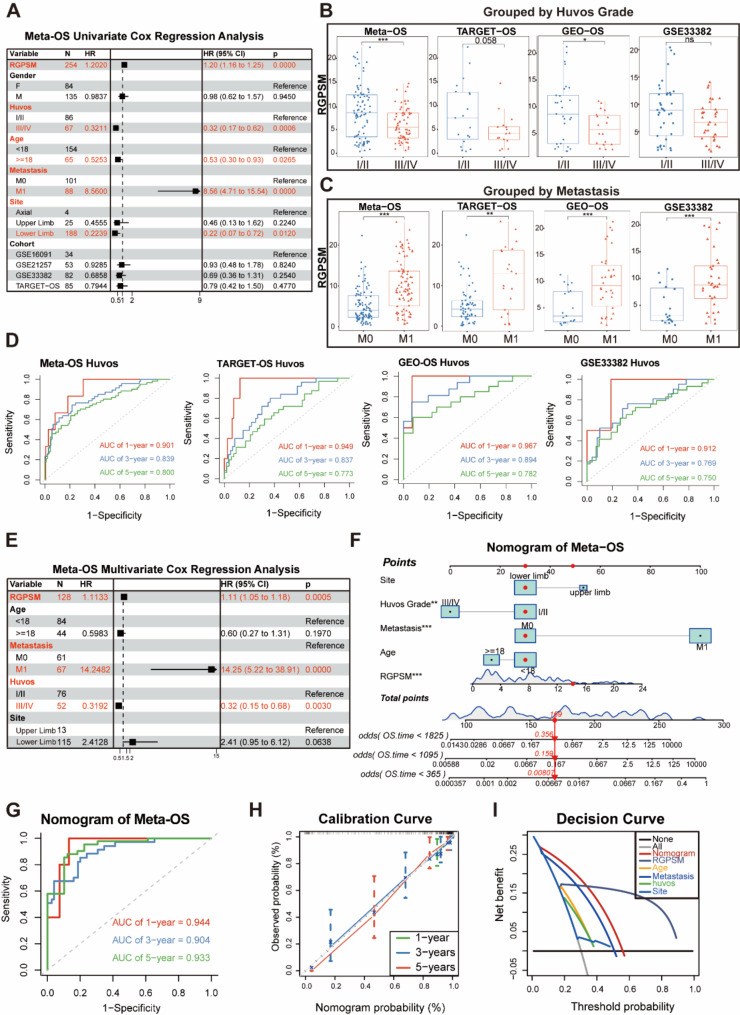
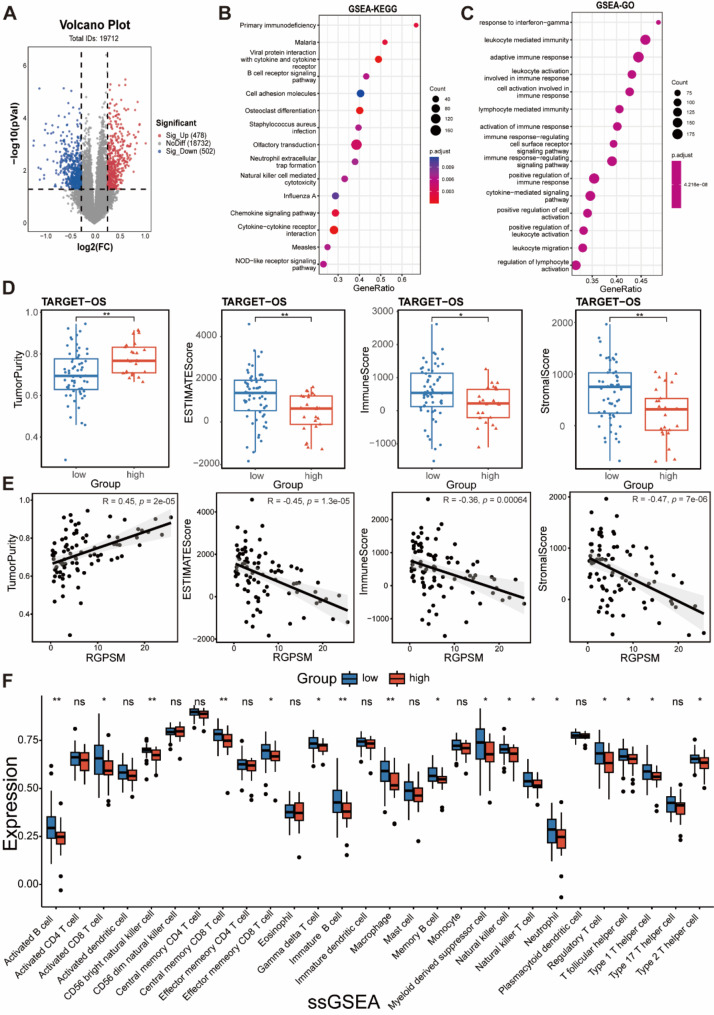
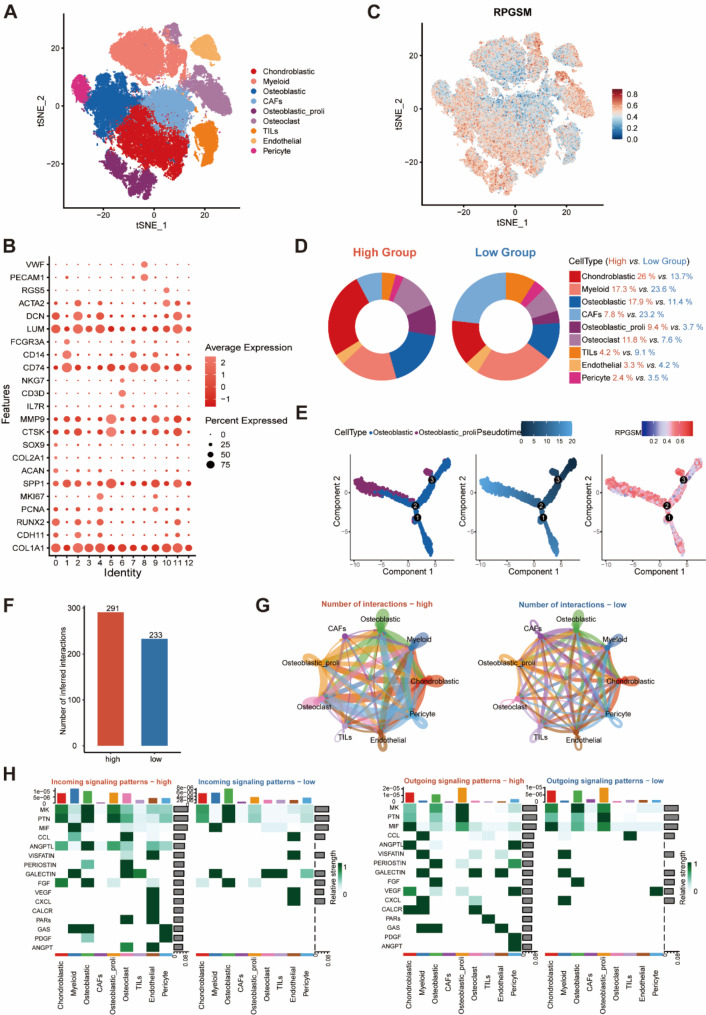
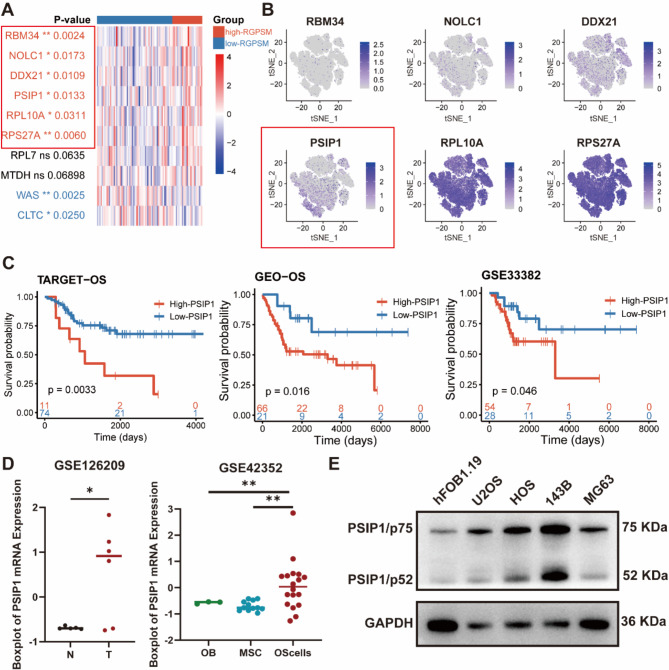
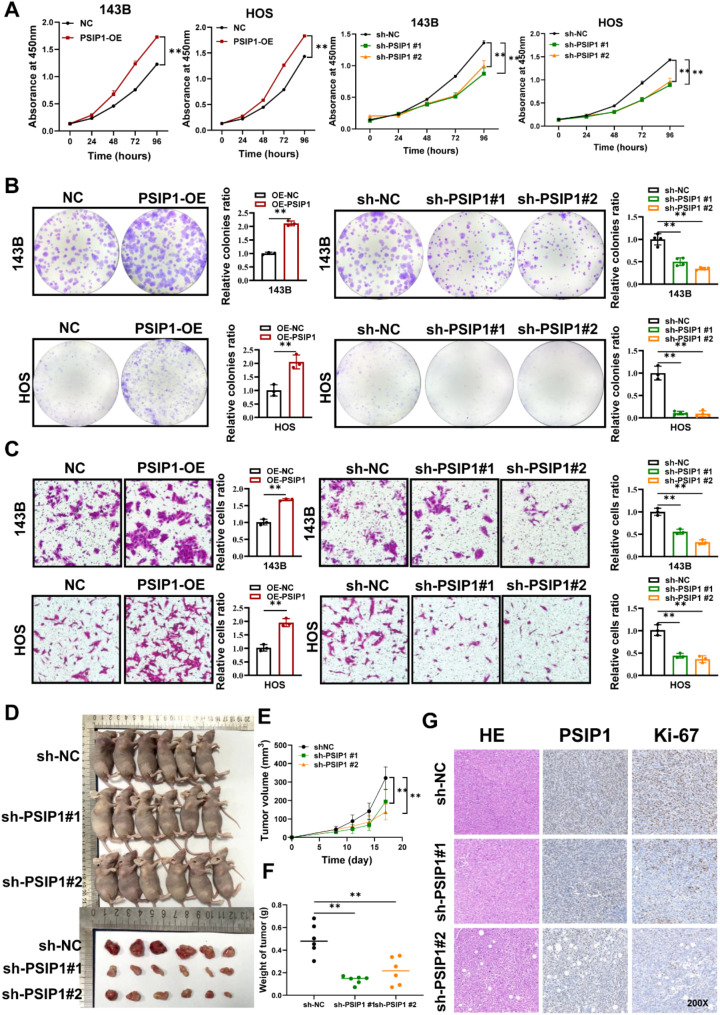
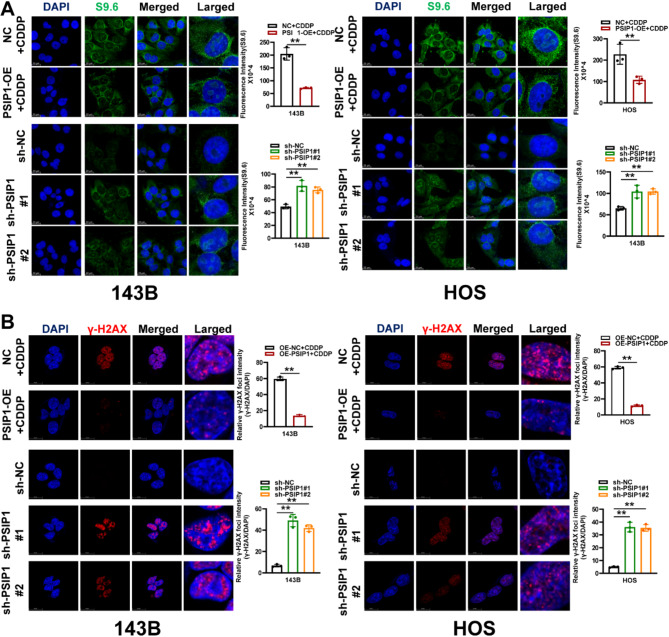
Dysregulation of R-loops has been implicated in tumor development, progression, and the regulation of tumor immune microenvironment (TME). However, their roles in osteosarcoma (OS) remain underexplored. In this study, we firstly constructed a novel R-loop Gene Prognostic Score Model (RGPSM) based on the RNA-sequencing (RNA-seq) datasets and evaluated the relationships between the RGPSM scores and the TME. Additionally, we identified key R-loop-related genes involved in OS progression using single-cell RNA sequencing (scRNA-seq) dataset, and validated these findings through experiments. We found that patients with high-RGPSM scores exhibited poorer prognosis, lower Huvos grades and a more suppressive TME. Moreover, the proportion of malignant cells was significantly higher in the high-RGPSM group. And integrated analysis of RNA-seq and scRNA-seq datasets revealed that PC4 and SRSF1 Interacting Protein 1 (PSIP1) was highly expressed in osteoblastic and proliferative OS cells. Notably, high expression of PSIP1 was associated with poor prognosis of OS patients. Subsequent experiments demonstrated that knockdown of PSIP1 inhibited OS progression both in vivo and in vitro, leading increased R-loop accumulation and DNA damage. Conversely, overexpression of PSIP1 facilitated R-loop resolution and reduced DNA damage induced by cisplatin. In conclusion, we developed a novel RGPSM that effectively predicted the outcomes of OS patients across diverse cohorts and identified PSIP1 as a critical modulator of OS progression by regulating R-loop accumulation and DNA damage.
Keywords: Machine-learning; Multi-omics analysis; Osteosarcoma; PSIP1; R-loop.
© 2025. The Author(s).
Conflict of interest statement
Declarations. Ethics approval and consent to participate: Animal experiments were in compliance with ethical standards and had been ethically approved (CDYFY-IACUC-202407QR005). Consent for publication: The authors declare no competing interests. Competing interests: The authors declare no competing interests.
Figures
Similar articles
-
Exploring tumor microenvironment in molecular subtyping and prognostic signatures in ovarian cancer and identification of SH2D1A as a key regulator of ovarian cancer carcinogenesis.Heliyon. 2024 Sep 17;10(18):e38014. doi: 10.1016/j.heliyon.2024.e38014. eCollection 2024 Sep 30. Heliyon. 2024. PMID: 39347397 Free PMC article.
-
Prediction of survival and immunotherapy response by the combined classifier of G protein-coupled receptors and tumor microenvironment in melanoma.Eur J Med Res. 2023 Sep 16;28(1):352. doi: 10.1186/s40001-023-01346-6. Eur J Med Res. 2023. PMID: 37716991 Free PMC article.
-
Single-cell RNA-seq reveals T cell exhaustion and immune response landscape in osteosarcoma.Front Immunol. 2024 Apr 2;15:1362970. doi: 10.3389/fimmu.2024.1362970. eCollection 2024. Front Immunol. 2024. PMID: 38629071 Free PMC article.
-
Combining bulk RNA-sequencing and single-cell RNA-sequencing data to reveal the immune microenvironment and metabolic pattern of osteosarcoma.Front Genet. 2022 Oct 19;13:976990. doi: 10.3389/fgene.2022.976990. eCollection 2022. Front Genet. 2022. PMID: 36338972 Free PMC article.
-
Integrated immunogenomic analyses of single-cell and bulk profiling construct a T cell-related signature for predicting prognosis and treatment response in osteosarcoma.Discov Oncol. 2024 Oct 22;15(1):579. doi: 10.1007/s12672-024-01461-8. Discov Oncol. 2024. PMID: 39436466 Free PMC article.
References
-
- Chakraborty P. New insight into the biology of R-loops. Mutat Res. 2020;821:111711. - PubMed
Grants and funding
LinkOut - more resources
Full Text Sources
Research Materials
