. 2025 Apr 23;24(1):122.
doi: 10.1186/s12943-025-02311-z.

LSD1 inhibition attenuates targeted therapy-induced lineage plasticity in BRAF mutant colorectal cancer

Affiliations

LSD1 inhibition attenuates targeted therapy-induced lineage plasticity in BRAF mutant colorectal cancer

Christopher A Ladaika et al. Mol Cancer. .

Abstract

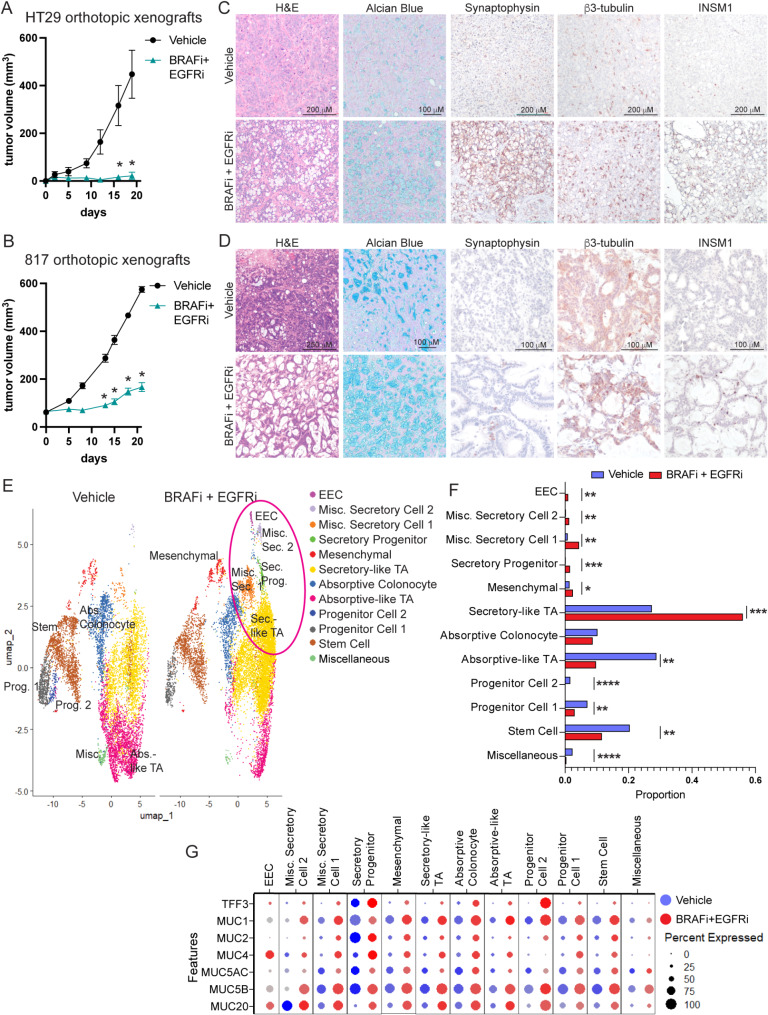
Background: BRAF activating mutations occur in approximately 10% of metastatic colorectal cancer (CRCs) and are associated with worse prognosis in part due to an inferior response to standard chemotherapy. Standard of care for patients with refractory metastatic BRAFV600E CRC is treatment with BRAF and EGFR inhibitors and recent FDA approval was given to use these inhibitors in combination with chemotherapy for patients with treatment naïve metastatic BRAFV600E CRC. Lineage plasticity to neuroendocrine cancer is an emerging mechanism of targeted therapy resistance in several cancer types. Enteroendocrine cells (EECs), the neuroendocrine cell of the intestine, are uniquely present in BRAF mutant CRC as compared to BRAF wildtype CRC.

Methods: BRAF plus EGFR inhibitor treatment induced changes in cell composition were determined by gene expression, imaging and single cell approaches in multiple models of BRAF mutant CRC. Furthermore, multiple clinically relevant inhibitors of the lysine demethylase LSD1 were tested to determine which inhibitor blocked the changes in cell composition.

Results: Combined BRAF and EGFR inhibition enriched for EECs in all BRAF mutant CRC models tested. Additionally, EECs and other secretory cell types were enriched in a subset of BRAFV600E CRC patient samples following targeted therapy. Importantly, inhibition of LSD1 with a clinically relevant inhibitor attenuated targeted therapy-induced EEC enrichment through blocking the interaction of LSD1, CoREST2 and STAT3.

Conclusions: Our findings that BRAF plus EGFR inhibition induces lineage plasticity in BRAFV600E CRC represents a new paradigm for how resistance to BRAF plus EGFR inhibition occurs. Additionally, our finding that LSD1 inhibition blocks lineage plasticity has the potential to improve responses to BRAF plus EGFR inhibitor therapy in patients.

Keywords: BRAF; Cetuximab; Colorectal cancer; Encorafenib; LSD1; Lineage plasticity; Neuroendocrine.


Conflict of interest statement

Declarations. Ethics approval and consent to participate: All mouse experiments were covered under a protocol approved by the Indiana University Bloomington Animal Care and Use Committee in accordance with the Association for Assessment and Accreditation of Laboratory Animal Care International. Consent for publication: Not applicable. Competing interests: The authors declare no competing interests.

Figures

Fig. 1
Fig. 1
BRAF plus EGFR inhibition enriches for EECs in BRAFV600E CRC. (A) Western blots of HT29 cells treated with DMSO or 2.5 nM encorafenib (BRAFi, Bi) alone or in combination with 20 µg/ml cetuximab (EGFRi, Ei) for 48 H. (B) Relative gene expression of indicated genes in HT29 cells treated as in (A) Gene expression was normalized to the housekeeping gene RHOA and then to the DMSO treated cells. Graph represents mean +/- SEM. N = 3. (C) Immunofluorescence for β3-tubulin (B3T) in HT29 cells treated as in A for 72 H. Graph (below) is the %b3-tubulin positive cells of the total number of cells per field. N = 3. (D) Relative gene expression of indicated genes in 817 human CRC organoids treated with DMSO or 2.5 nM encorafenib (BRAFi) and 500 nM gefitinib (EGFRi) for 6 days. Data is normalized and presented as in (B) (E) Relative gene expression of indicated genes in TP KO mouse CRC organoids treated with DMSO or 2.5 nM encorafenib (BRAFi) alone or in combination with 500 nM gefitinib (EGFRi) for 4 days. Data is normalized and presented as in B. (F) Immunofluorescence for β3-tubulin (B3T) in TP KO organoids treated as in E. (G) Encorafenib dose response curve of empty vector (EV) or NGN3 knockdown (KD) HT29 cells treated with 500 nM gefitinib (EGFRi) for 72 H. Viability was normalized to DMSO treated EV cells. N = 3. (H) Relative viability of TP KO scramble (Scr) and NGN3 KO organoids treated as in E. Viability was normalized to DMSO treated scramble cells. N = 3. Significance was determined by one-way ANOVA with Tukey pairwise multiple comparison testing. *P ≤ 0.05, ** P ≤ 0.01, *** P ≤ 0.001, **** P ≤ 0.0001
Fig. 2
Fig. 2
BRAFi plus EGFRi treatment induces a neuroendocrine phenotype in residual BRAFV600E tumors. (A) Following tumor formation of HT29 cells or (B) 817 human CRC organoids orthotopically engrafted into the colons of NSG mice, mice were treated with vehicle or BRAFi (encorafenib, 20 mg kg− 1, daily) and EGFRi (cetuximab, 20 mg kg− 1, biweekly). Graph is the mean +/- SEM of the tumor volume measured by caliper over the course of treatment. N = 5 mice per group. (C) Representative H&E, Alcian blue and IHC images of HT29 colon tumors from the experiment in (A) (D) Representative H&E, Alcian blue and IHC images of 817 colon tumors from the experiment in (B) (E) UMAP dot plot of 817 tumor scRNAseq data from mice treated with vehicle (left) or BRAFi + EGFRi (right). Samples are colored by cell type/cluster. TAs are transit amplifying cells, EECs are enteroendocrine cells and misc. stands for miscellaneous. Secretory populations increased in BRAFi + EGFRi tumors are circled in pink. (F) Fold change in cell type proportions in BRAFi + EGFRi relative to vehicle samples. (G) Dot plot showing mucous related gene expression in vehicle and BRAFi + EGFRi treated samples across all annotated cell types. The size of the dot is proportional to the percentage of cells that express a given gene, and the color scale indicates the average scaled gene expression within the specific cell population. Blue and red dots are expression levels in cells from vehicle and BRAFi + EGFRi tumors, respectively. Significance was determined by two-way ANOVA corrected for multiple comparisons using the Šídák method (A, B) and by a moderated t-test (F). *P ≤ 0.05, ** P ≤ 0.01, *** P ≤ 0.001, **** P ≤ 0.0001
Fig. 3
Fig. 3
BRAFi plus EGFRi treatment induces a neuroendocrine phenotype in a syngeneic model of BRAFV600E CRC. (A) Diagram for the generation of TP KO organoids and TP KO colon orthoptic model and treatment, including representative images of a colon tumor and lung and lymph node metastases (indicated by red arrows). (B) Following tumor formation of TP KO mouse CRC organoids orthotopically engrafted into the colons of C57Bl/6 mice, mice were treated with vehicle or BRAFi (encorafenib, 20 mg kg− 1, daily) and EGFRi (gefitinib, 75 mg kg− 1, daily). Graph is the mean +/- SEM of the tumor volume measured by caliper over the course of treatment. N = 7, vehicle. N = 8, BRAFi + EGFRi. (C) Representative H&E images of TP KO tumors. Blue dashed box indicates undifferentiated tumor glands, grade 3,4 solid and cord like tumor with dense stroma. Red solid box indicates well differentiated glandular tumor with goblet cells and active mucin production. Orange dashed box indicates region with well-defined mature stroma. Yellow dashed box indicates less differentiated solid tumor area with biphasic appearance suggestive of neuroendocrine features. (D) Semi quantitative percentage of TP KO tumor areas that are grade 3&4. Each point represents the scoring for one tumor. Lines represent mean -/+ SEM. (E) UMAP dot plot of TP KO tumor epithelial cell scRNAseq data from mice treated with vehicle (left) or BRAFi + EGFRi (right). Samples are colored by cell type/cluster. TAs are transit amplifying cells, ELCs are enterocyte-like cells, and EECs are enteroendocrine cells. EEC populations enriched in BRAFi + EGFRi treated tumors are circled in pink. (F) Fold change in cell type proportions in BRAFi + EGFRi relative to vehicle samples. (G) Representative IHC and Alcian blue images of TP KO colon tumors from the experiment in B. Significance was determined by two-way ANOVA corrected for multiple comparisons using the Šídák method (B), student’s T-test (D) and by a moderated t-test (F). *P ≤ 0.05
Fig. 4
Fig. 4
LSD1 inhibition blocks therapy-induced EEC enrichment in BRAFV600E CRC. (A) Relative gene expression in empty vector (EV) and LSD1 knockdown (KD) HT29 cells treated with DMSO or 2.5 nM encorafenib (BRAFi, Bi) plus 500 nM gefitinib (EGFRi, Ei) for 48 H. Gene expression was normalized to the housekeeping gene RHOA and then to the DMSO treated cells. Graph represents mean +/- SEM. N = 3. LSD1 KD1 and KD2 were generated using different shRNAs. (B) Encorafenib dose response curve of EV and LSD1 KD HT29 cells treated with 500 nM gefitinib (EGFRi) for 72 H. Viability was normalized to the respective non-encorafenib treated cells. (C) Relative gene expression of indicated genes in HT29 cells treated with DMSO or 2.5 nM encorafenib (BRAFi) and 20 µg/ml cetuximab (EGFRi, Ei, cetux) with or without 1 µM SP-2577 for 48 H. Data presented as in A. (D) Relative gene expression of indicated genes in HT29 cells treated with DMSO or 2.5 nM encorafenib (BRAFi, Bi) plus 500 nM gefitinib (EGFRi, Ei, gef) with or without 500 nM SP-2577 (LSD1i) for 4 days. Data presented as in (A) (E) Immunofluorescence for β3-tubulin (B3T) in HT29 cells treated as in C for 72 H. Graph is the %β3-tubulin positive cells of the total number of cells per field. N = 3. (F) Immunofluorescence for β3-tubulin in HT29 cells treated as in D for 72 H and analyzed in E. (G) Encorafenib dose response curve of HT29 cells treated with 500 nM gefitinib (EGFRi) and DMSO or 500 nM SP-2577 for 72 H. Data was normalized as in (B) (H) LSD1 coIP in nuclear lysates prepared from HT29 cells treated with DMSO or 2.5 nM encorafenib plus 500 nM gefitinib for 4 H. (I) LSD1 coIP in nuclear lysates prepared from 817 organoids treated with DMSO or 2.5 nM encorafenib plus 500 nM gefitinib for 4 H. (J) LSD1 coIP in nuclear lysates prepared from HT29 cells pre-treated with DMSO or 1 µM SP-2577 for 24 H prior to treatment with DMSO or SP-2577 with or without 2.5nM encorafenib and 500 nM gefitinib for 4 H. Significance was determined by one-way ANOVA with Tukey pairwise multiple comparison testing. *P ≤ 0.05, ** P ≤ 0.01, *** P ≤ 0.001, **** P ≤ 0.0001
Fig. 5
Fig. 5
LSD1 inhibition blocks BRAFi + EGFRi-induced lineage plasticity in vivo. (A) Rcor2 violin plot from TP KO scRNAseq data. Module scores for the (B) Wang LSD1 Targets Down and (C) NRSF gene sets for each epithelial cell in the TP KO scRNAseq data. (D) LSD1 coIP in nuclear lysates prepared from 817 colon orthotopic tumors from vehicle or encorafenib + cetuximab treated NSG mice. (E) Following tumor formation of HT29 cells orthotopically engrafted into the colons of NSG mice, mice were treated with vehicle or BRAFi (encorafenib, 20 mg kg− 1, daily) and EGFRi (cetuximab, 20 mg kg− 1, biweekly) with or without SP-2577 (LSD1i, 100 mg kg− 1, twice daily). Graph is the mean +/- SEM of the tumor volume measured by caliper over the course of treatment. N = 5 mice per group at days 0–7. N = 3 mice per group at days 12–18. *P ≤ 0.05 relative to vehicle. #P ≤ 0.05 relative to BRAFi + EGFRi. Significance was determined by fitting a mixed model and correcting for multiple comparisons by controlling the false discovery rate using the two-stage step up method of Benjamini, Krieger, and Yekutieli. (F) Total luminescence signal detected by plate reader from lungs incubated ex vivo in PBS + luciferin. A lung from a non-tumor bearing mouse was used as a negative control. Each point represents an individual lung. Lines represent mean -/+ SEM. *P ≤ 0.05 relative to vehicle. Significance was determined by one-way ANOVA with Tukey pairwise multiple comparison testing. (G) STAT3 coIP in nuclear lysates prepared from HT29 colon orthotopic tumors from mice treated as indicated for 7 days. (H) Dimethyl lysine IP from nuclear lysates from tumors treated as indicated for 19 days. (I) Representative H&E and IHC images of HT29 colon tumors from the mice treated for 19 days from the experiment in E. (J) UMAP dot plot of scRNAseq data of pretreated (left) or on treatment (right) samples from patients with BRAFV600E CRC. Samples are colored by cell type/cluster. TAs are transit amplifying cells and EECs are enteroendocrine cells. (K) Relative differences in cell proportions for each cluster between the pretreatment and on treatment samples

Update of

References

    1. Morris VK, Bekaii-Saab T. Improvements in Clinical Outcomes for BRAFV600E-Mutant Metastatic Colorectal Cancer. Clin Cancer Res. 2020;26:4435–41. - PubMed
    1. Tabernero J, Grothey A, Van Cutsem E, Yaeger R, Wasan H, Yoshino T, et al. Encorafenib plus cetuximab as a new standard of care for previously treated BRAF V600E-Mutant metastatic colorectal cancer: updated survival results and subgroup analyses from the BEACON study. J Clin Oncol. 2021;39:273–84. - PMC - PubMed
    1. Kopetz S, Yoshino T, Van Cutsem E, Eng C, Kim TW, Wasan HS, et al. Encorafenib, cetuximab and chemotherapy in BRAF-mutant colorectal cancer: a randomized phase 3 trial. Nat Med. 2025;31:901–8. - PMC - PubMed
    1. Rubin MA, Bristow RG, Thienger PD, Dive C, Imielinski M. Impact of lineage plasticity to and from a neuroendocrine phenotype on progression and response in prostate and lung cancers. Mol Cell. 2020;80:562–77. - PMC - PubMed
    1. Aggarwal R, Huang J, Alumkal JJ, Zhang L, Feng FY, Thomas GV, et al. Clinical and genomic characterization of Treatment-Emergent Small-Cell neuroendocrine prostate cancer: A Multi-institutional prospective study. J Clin Oncol. 2018;36:2492–503. - PMC - PubMed

MeSH terms