. 2025 Apr 23;23(1):232.
doi: 10.1186/s12916-025-04056-4.

Maternal B12 deficiency during pregnancy dysregulates fatty acid metabolism and induces inflammation in human adipose tissue

Affiliations

Maternal B12 deficiency during pregnancy dysregulates fatty acid metabolism and induces inflammation in human adipose tissue

Jinous Samavat et al. BMC Med. .

Abstract

Background: Adipose tissue (AT) responds to excess calorie intake; however, the deficit in micronutrients accompanied by the modern lifestyle is often overlooked. Micronutrient deficiency in pregnancy, particularly vitamin B12 (B12), is commonly associated with higher adiposity, dyslipidemia, and type 2 diabetes (T2D). Studies have demonstrated that dyslipidemia can trigger pro-inflammatory status. However, the release of the pro-inflammatory factors in a tissue-specific micronutrient deficient environment is unexplored. Therefore, we investigated the role of B12 deficiency on lipid metabolism and inflammatory mediators in both in vitro and ex vivo models including human pre-adipocytes, primary adipocytes, mature human white AT (WAT), and its association with metabolic risk.

Methods: Paired abdominal subcutaneous and omental WAT (ScWAT and OmWAT) were chosen based on serum B12 (< 150 pM) from 115 Caucasian pregnant women. Human primary Sc adipocytes from women with different BMI (lean, overweight, obese, morbidly obese) and pre-adipocyte cell line (Chub-S7) were differentiated in various concentrations of B12. Serum B12, folate, lipids, cytokines, biochemical parameters, gene expression, intracellular triglyceride (TG), and mitochondrial function were assessed.

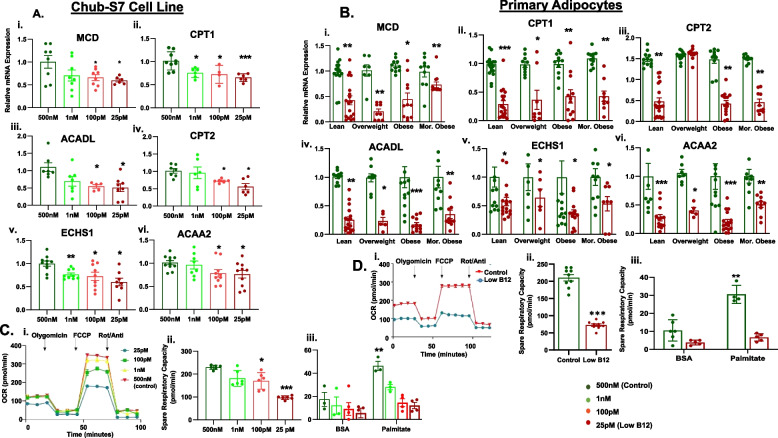
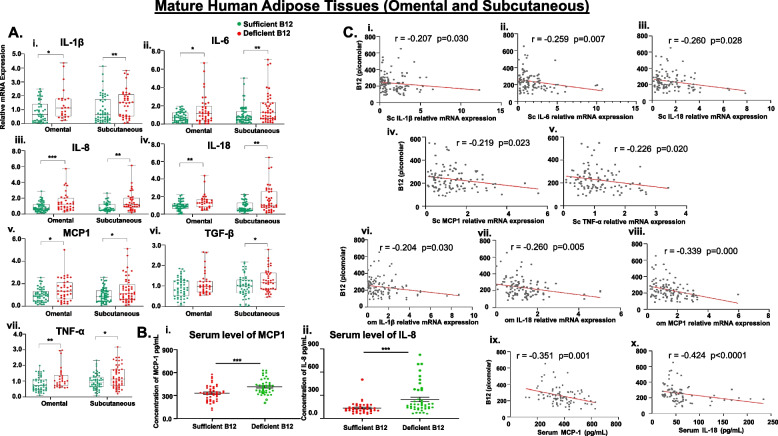
Results: In pregnant women with low B12 levels, BMI and serum TG were significantly higher, and high-density lipoprotein (HDL) was lower (p < 0.05). B12 deficiency in both depots of AT correlated with higher expression of genes in fatty acid (FA) synthesis, elongation, desaturation, TG synthesis, and reduced fatty acid oxidation (FAO) (p < 0.05). In vitro adipocytes with low B12 demonstrated that TG synthesis utilizing radiolabeled FA was higher and mitochondrial function was impaired. We also found that the expression of pro-inflammatory cytokines in AT was increased, and circulatory cytokines inversely associated with serum B12 (p < 0.05).

Conclusions: Our novel data highlights that B12 deficiency dysregulates lipids and induces inflammation in AT and circulation, which could contribute to adipocyte dysfunction exacerbating cardiometabolic risk during pregnancy.

Keywords: Adipose tissue; Lipid metabolism; Low-grade inflammation; Obesity; Pregnancy; Vitamin B12.


Conflict of interest statement

Declarations. Ethics approval and consent to participate: Ethical approval was sought from the Ethics Committee of UHCW (ID: SK06/9309). All the participants provided written and informed consent in accordance with the Declaration of Helsinki. Consent for publication: Not applicable. Competing interests: The authors declare no competing interests.

Figures

Fig. 1
Fig. 1
Effect of low B12 on lipogenesis in human Chub-S7 cell line and primary Sc adipocytes: [A] and [C] Expression of genes involved in FA synthesis (ACACA, FAS), elongation (ELOVL6), desaturation (SCD) and TG synthesis (GPAT2, LIPIN1, DGAT2) in human (i-vii) Chub-S7 cell line (n=6) and (i-vi) primary Sc adipocytes (n=3 per BMI group - subjects with lean, overweight, obesity, morbid obesity), respectively. The Chub-S7 cells were seeded and differentiated with different concentrations of B12 (500nM, 1nM, 100pM, 25pM), and gene expression were measured by RT-qPCR and normalized to 18s rRNA. The primary adipocytes were derived from subcutaneous depots, which were seeded and differentiated with two different concentrations of B12 (500nM, 25pM). The gene expressions normalized to L19 were measured by RT-qPCR. Levels of synthesized TG assessed by radiochemical flux assay in [B] Chub-S7 adipocytes, [D] Primary Sc adipocytes derived from subjects with (i) Lean BMI and (ii) Obesity. The cells were first labelled with 14C-Oleate for 2 h, then followed by total lipids extraction and the resultant radiolabelled TG was separated on a thin layer chromatography (TLC) plate with glyceryltripalmitate as standard, quantified with the scintillation counter (Beckman coulter LS6500, USA) and normalized per milligram protein estimated with Bradford method. Dots depict individual study subjects and data represented as mean ± SEM (standard error of mean) and significance levels indicated as follows; *p<0.05, **p<0.01 compared to control B12 (500nM)
Fig. 2
Fig. 2
Effect of B12 deficiency on lipogenesis in mature human AT (ScWAT and OmWAT) and its correlation with serum B12. [A] Expression of genes involved in FA synthesis (i-vii) (ACACA, FAS), elongation (ELOVL6), desaturation (SCD) and TG synthesis (GPAT2, LIPIN1 and DGAT2) in ScWAT and OmWAT. Total - 115 pregnant women, subjects with sufficient levels of B12 (>150pM) = 63 (green) and Deficient levels of B12 (150pM) = 52 (red)). The gene expression involved in FA and TG biosynthesis was assessed using RT-qPCR and normalized to L19. The data are reported as box charts median (IQR) and significance levels are indicated as *p<0.05, **p<0.01 compared to sufficient B12 (>150pM). [B] (i-ii) Correlation between Sc ACACA and FASN gene expression with serum B12; (iii-viii) Correlation between Om ACACA, FASN, SCD1, GPAT, LIPIN1, DGAT2 gene expression with serum B12. Dots depict individual study subjects and data are presented as Spearman’s R-values: ACACA: Acetyl-CoA Carboxylase Alpha, FASN: Fatty Acid Synthase, ELOVL6: Elongation of very long Fatty Acid Elongase 6, SCD: Stearoyl- CoA Desaturase, GPAT2: Glycerol-3-Phosphate Acyltransferase 2, Mitochondrial, LIPIN1 Phosphatidate Phosphatase, and DGAT2: Diacylglycerol O-Acyltransferase 2
Fig. 3
Fig. 3
Effect of low B12 on FA β-oxidation and mitochondrial function in Chub-S7 cell line and primary Sc-adipocytes. [A] and [B] Expression of genes (MCD, CPT1, ACADL, CPT2, ECHS1, ACAA2) involved in FA β-oxidation in (i-vi) Chub-S7 cell line (n=6) and (i-vi) primary Sc-adipocytes (n=3 per BMI group - subjects with lean, overweight, obesity, morbid obesity), respectively. The Chub-S7 cells were seeded and differentiated with different concentrations of B12 (500nM, 1nM, 100pM, 25pM), and gene expression were measured by RT-qPCR and normalized to 18s rRNA. The primary adipocytes were derived from subcutaneous depots, which were seeded and differentiated with two different concentrations of B12 (500nM, 25pM). The gene expressions normalized to L19 were measured by RT-qPCR. The graphs in [C] Chub-S7 and [D] primary Sc-adipocytes, respectively, show the (i) Oxygen consumption rate (OCR) and (ii) Spare respiratory capacity in cells incubated with a rich-substrate KHB media (containing glucose - 2.5mM, pyruvate - 1mM, L-Glutamine - 2mM, BSA - 0.1%) at pH 7.4 under various B12 conditions. (iii) Represents the spare respiratory capacity following exposure with palmitate (200µM)/ Basal control (BSA - 33.3µM) in a limited-substrate KHB media (containing only L-carnitine - 0.5mM, glucose - 1.25mM) under various conditions of B12. Dots depict individual study subjects and data represented as mean ± SEM and significance levels indicated as *p<0.05, **p<0.01, ***p<0.001, compared to control B12 (500nM)
Fig. 4
Fig. 4
Effect of B12 deficiency on FA β-oxidation in mature human AT (omWAT and scWAT), and its association with serum B12: [A] Expression of genes (i-vi) (MCD, CPT1, CPT2, ACADL, ECHS1, ACAA2) involved in FA β-oxidation in omWAT and scWAT. Total - 115 pregnant women, subjects with sufficient levels of B12 (>150pM) = 63 (green) and Deficient levels of B12 (<150pM) = 52 (red)). Data presented as box charts median (IQR). Significance levels are indicated as *p<0.05, **p<0.01, ***p<0.001 compared to Sufficient B12 (>150pM). [B] (i-vi) Correlation between Sc-FA oxidation genes MCD, CPT1β, ECHS1, CPT2, ACADL, ACAA2, respectively with serum B12, and (vii-x) correlation between Om-FA oxidation genes MCD, CPT1β, CPT2, ACAA2 respectively with serum B12. The dots depict individual study subjects and data presented as Spearman’s R-values. MCD: Malonyl-CoA decarboxylase, CPT1β: Carnitine palmitoyltransferase-1, CPT2: Carnitine palmitoyltransferase-2, ACADL: Acyl-CoA Dehydrogenase Long Chain, ECHS1: Enoyl-CoA Hydratase, Short Chain 1 and ACAA2: Acetyl-CoA Acyltransferase
Fig. 5
Fig. 5
Effect of low B12 on inflammatory cytokines in Chub-S7 cell line and primary Sc-adipocytes [A] and [B] Expression of genes involved in inflammation (IL-1β, IL-6, IL-8, IL-18, MCP-1, TGF-β and TNF-α) in (i-vii) Chub-S7 cell line (n=6) and (i-vii) primary Sc-adipocytes (n=3 per BMI group - subjects with lean, overweight, obesity, morbid obesity), respectively. The Chub-S7 cells were seeded and differentiated with different concentrations of B12 (500nM, 1nM, 100pM, 25pM), and gene expression were measured by RT-qPCR and normalized to 18s rRNA. The primary adipocytes were derived from subcutaneous depots, which were seeded and differentiated with two different concentrations of B12 (500nM, 25pM). The gene expression normalized to L19 were measured by RT-qPCR. Dots depict individual study subjects and data expressed as mean ± SEM and significance levels indicated as follows; *p<0.05, **p<0.01, **p<0.001 compared to control B12 (500nM)
Fig. 6
Fig. 6
Effect of low B12 on inflammatory cytokines in mature human AT, and its association with circulating B12 and biochemical metabolites [A] Expression of genes involved in inflammation (i-vii) IL-1β, IL-6, IL-8, IL-18, MCP-1, TGF-β and TNF-α in OmWAT and ScWAT. Total - 115 pregnant women, subjects with sufficient levels of B12 (>150pM) = 63 (green) and Deficient levels of B12 (<150pM) = 52 (red)). The data are not normally distributed and reported as box charts median (IQR). Significance levels are indicated as follows *p<0.05, **p<0.01, ***p<0.001 compared to Sufficient B12 (>150pM). [B] Circulating levels of (i) MCP1 and (ii) IL-8 levels in serum. The dots depict individual study subjects, the line represents the mean, and the whiskers depict the SEM. [C] (i-v) Correlation between gene expression of Sc inflammatory markers IL-1β, IL-6, IL-18, MCP-1, TNFα and serum B12. (vi-viii) Correlation between Om-inflammatory markers (IL-1β, IL-18, MCP-1) and serum B12, respectively. (ix-x) Correlation between circulating levels of MCP-1 and IL-8 and serum B12, respectively. Dots depict individual study subjects and data presented as Spearman’s R-values. IL-1β: interleukin-1 beta, IL-6: interleukin-6, IL-18: interleukin-18; MCP- 1: monocyte chemoattractant protein-1; TNFα: Tumour necrosis factor-α

Similar articles

References

    1. Langley-Evans SC, Pearce J, Ellis S. Overweight, obesity and excessive weight gain in pregnancy as risk factors for adverse pregnancy outcomes: a narrative review. J of Hum Nutri aDietcs. 2022;35(2):250–64. - PMC - PubMed
    1. Murray CJ, Aravkin AY, Zheng P, Abbafati C, Abbas KM, Abbasi-Kangevari M, Abd-Allah F, Abdelalim A, Abdollahi M, Abdollahpour I. Global burden of 87 risk factors in 204 countries and territories, 1990–2019: a systematic analysis for the global burden of disease study 2019. Lancet. 2020;396(10258):1223–49. - PMC - PubMed
    1. Malnutrition in all its forms. https://www.emro.who.int/nutrition/double-burden-of-nutrition/index.html.
    1. Obesity profile: short statistical commentary May 2024. https://www.gov.uk/government/statistics/update-to-the-obesity-profile-o....
    1. Kanasaki K, Kumagai A. The impact of micronutrient deficiency on pregnancy complications and development origin of health and disease. J Obst Gynae Res. 2021;47(6):1965–72. - PubMed

LinkOut - more resources