. 2025 Apr 22;23(1):191.
doi: 10.1186/s12964-025-02186-z.

Glucose- and glutamine-driven de novo nucleotide synthesis facilitates WSSV replication in shrimp

Affiliations

Glucose- and glutamine-driven de novo nucleotide synthesis facilitates WSSV replication in shrimp

Cong-Yan Chen et al. Cell Commun Signal. .

Abstract

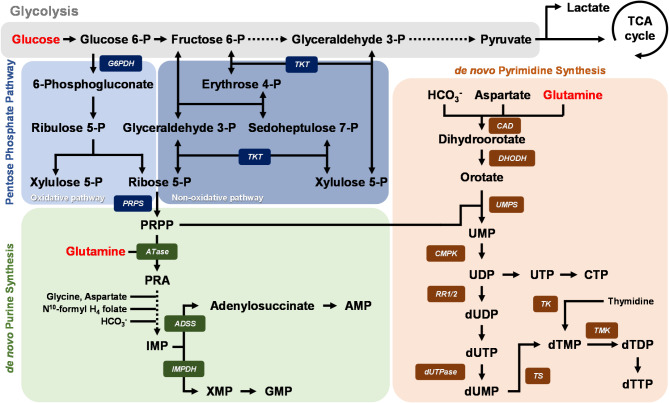
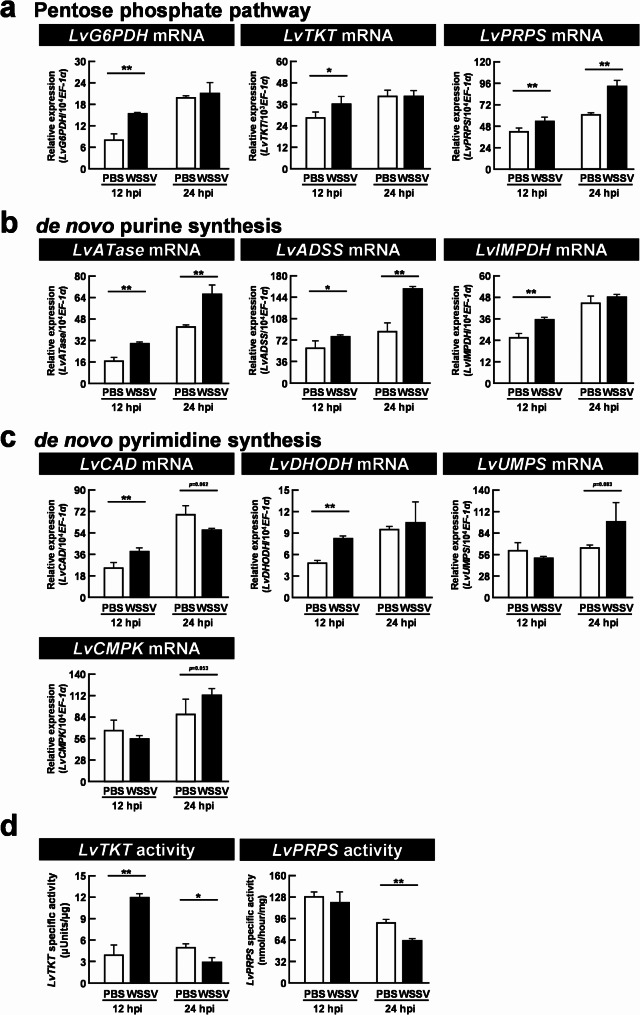
Background: Viruses rely on host metabolism to complete their replication cycle. White spot syndrome virus (WSSV), a major pathogen in shrimp aquaculture, hijacks host metabolic pathways to fulfill its biosynthetic and energetic needs. Previous studies have demonstrated that WSSV promotes aerobic glycolysis (Warburg effect) and glutaminolysis during its replication stage (12 hpi). Therefore, glucose and glutamine serve as crucial metabolites for viral replication. Additionally, de novo nucleotide synthesis, including the pentose phosphate pathway and purine/pyrimidine synthesis, is significantly activated during WSSV infection. However, the precise association between WSSV and host glucose and glutamine metabolism in driving de novo nucleotide synthesis remains unclear. This study aimed to investigate the involvement of glucose and glutamine in nucleotide metabolism during WSSV replication and to elucidate how WSSV reprograms these pathways to facilitate its pathogenesis.

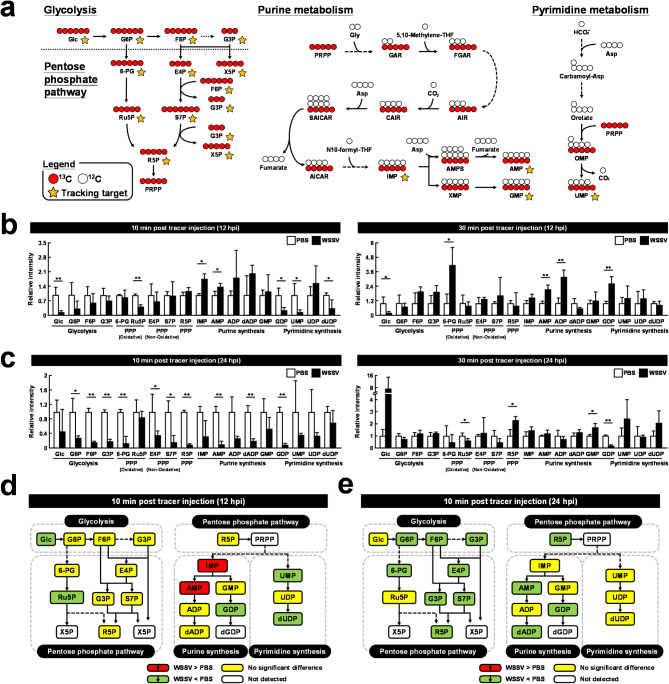
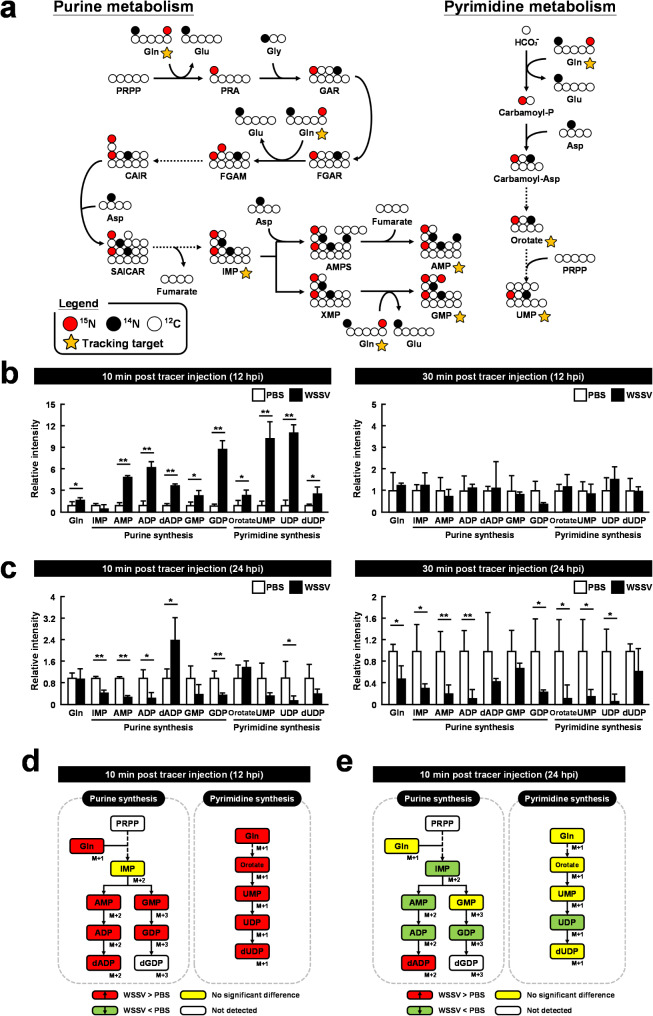
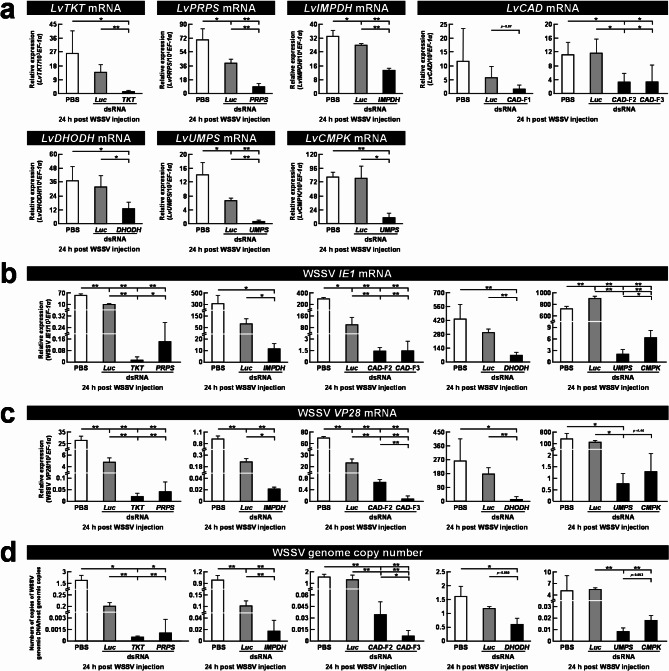
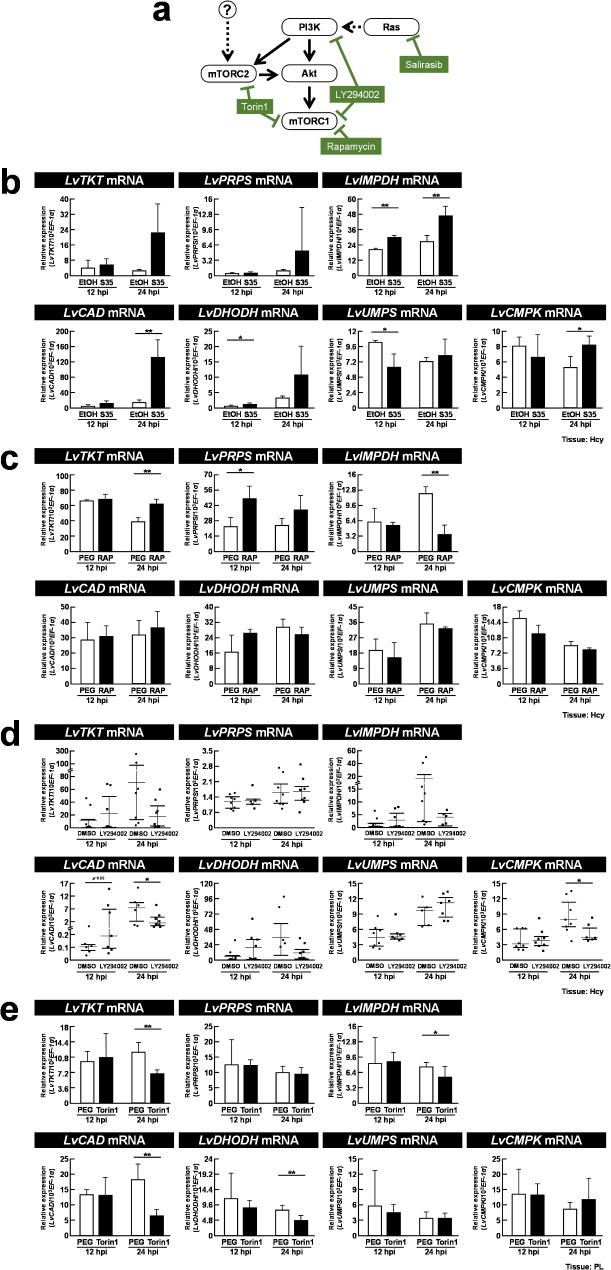
Methods: To assess changes in metabolic flux during WSSV replication, LC-ESI-MS-based isotopically labeled glucose ([U-13C] glucose) and glutamine ([A-15N] glutamine) were used as metabolic tracers in in vivo experiments with white shrimp (Litopenaeus vannamei). The in vivo experiments were also conducted to measure the expression and enzymatic activity of genes involved in nucleotide metabolism. Additionally, in vivo dsRNA-mediated gene silencing was employed to evaluate the roles of these genes in WSSV replication. Pharmacological inhibitors targeting the Ras-PI3K-Akt-mTOR pathway were also applied to investigate its regulatory role in WSSV-induced nucleotide metabolic reprogramming.

Results: The metabolite tracking analysis confirmed that de novo nucleotide synthesis was significantly activated at the WSSV replication stage (12 hpi). Glucose metabolism is preferentially reprogrammed to support purine synthesis, while glutamine uptake is significantly increased and contributes to both purine and pyrimidine synthesis. Consistently, gene expression and enzymatic activity analyses, along with gene silencing experiments, indicated the critical role of de novo nucleotide synthesis in supporting viral replication. However, while the inhibition of the Ras-PI3K-Akt-mTOR pathway suggested its involvement in regulating nucleotide metabolism, no consistent effect on WSSV replication was observed, suggesting the presence of alternative regulatory mechanisms.

Conclusion: This study demonstrates that WSSV infection induces specific metabolic reprogramming of glucose and glutamine utilization to facilitate de novo nucleotide synthesis in shrimp. These metabolic changes provide the necessary precursors for nucleotide synthesis, supporting WSSV replication and pathogenesis. The findings offer novel insights into the metabolic strategies employed by WSSV and suggest potential targets for controlling WSSV outbreaks in shrimp aquaculture.

Keywords: Pentose phosphate pathway; Warburg effect; White shrimp; White spot syndrome virus; de novo nucleotide metabolism; in vivo stable-isotope tracing metabolomics.


Conflict of interest statement

Declarations. Ethics approval and consent to participate: No specific permits were required for the use of experimental shrimp, as they are invertebrates. All handling and treatment procedures strictly adhered to the institutional ethical guidelines. Consent for publication: All authors are consent for publication. Competing interests: The authors declare no competing interests.

Figures

Fig. 1
Fig. 1
Simplified schematic of de novo nucleotide synthesis. de novo nucleotide synthesis can be divided into the pentose phosphate pathway (blue area), the purine synthesis pathway (green area), and the pyrimidine synthesis pathway (orange area). The pentose sugar backbone of nucleic acids is derived from glucose entering glycolysis (gray area), while glutamine contributes to the synthesis of nitrogenous bases in nucleotides
Fig. 2
Fig. 2
Transcriptomic correlation network for de novo nucleotide synthesis. A correlation network was generated using the criterion of at least a 2-fold change in differential expression between the PBS group versus the WSSV group at (a) 1, (b) 6, (c) 12, and (d) 24 h post infection, respectively. A Pearson correlation coefficient threshold as|r| ≥ 0.6. was selected for the transcriptomic network. The contigs are color-coded based on their annotation in the KEGG pathway analysis. Positive and negative correlations between pairs of contigs are indicated by red and green lines, respectively. Further information on the selected highly connected contigs is provided in Supplementary Table 1
Fig. 3
Fig. 3
WSSV increased 13C-labeled metabolites in the de novo nucleotide synthesis pathway at the WSSV replication stage (12 hpi). (a) Schematic indicating how metabolites derived from [U-13C]glucose can be traced through the de novo nucleotide synthesis pathway. White circles represent 12Carbon, red circles represent 13Carbon, and yellow asterisks indicate the targets that were traced. At (b) 12 h and (c) 24 h post injected with WSSV or PBS, shrimp were injected with [U-13C]glucose and hemocytes were collected 10–30 minutes later. Metabolomic analysis of pooled hemocyte samples by LC-ESI-Q-TOF-MS was used to calculate the fold change of each 13C metabolite in the WSSV group compared to the corresponding 13C metabolite in the PBS group. Each bar represents the mean ± SD. Asterisks indicate differences between the WSSV group and the corresponding PBS control group (* p < 0.05, ** p < 0.01). Summary of changes in 13C-labeled metabolites in the nucleotide synthesis pathway at (d) 12 hpi and (e) 24 hpi, 10 minutes after [U-13C]glucose treatment. Changes in the WSSV group relative to the corresponding PBS control are color-coded as follows: red (significant increase), green (significant decrease), yellow (no significant change), and white (not detected)
Fig. 4
Fig. 4
WSSV significantly increased 15N-labeled metabolites in the purine/pyrimidine synthesis pathway during the replication stage (12 hpi), but not during the late stage (24 hpi). (a) Schematic indicating how metabolites derived from [A-15N]glutamine can be traced through the nucleotide synthesis pathway. White circles represent 12Carbon, solid black circles represent 14Nitrogen, red circles represent 15Nitrogen, and yellow asterisks indicate the traced targets. At (b) 12 h and (c) 24 h post injected with WSSV or PBS, shrimp were injected with [A-15N]glutamine and hemocytes were collected 10–30 minutes later. Metabolomic analysis of pooled hemocyte samples by LC-ESI-Q-TOF-MS was used to calculate the fold change of each 15N metabolite in the WSSV group compared to the corresponding 15N metabolite in the PBS group. Each bar represents the mean ± SD. Asterisks indicate differences between the WSSV group and the corresponding PBS control group (* p < 0.05, ** p < 0.01). Summary of changes in 15N-labeled metabolites in the nucleotide synthesis pathway at (d) 12 hpi and (e) 24 hpi, 10 minutes after [A-15N]glutamine treatment. Changes in the WSSV group relative to the corresponding PBS control are color-coded as follows: red (significant increase), green (significant decrease), yellow (no significant change), and white (not detected)
Fig. 5
Fig. 5
WSSV induced mRNA expression and catalytic activity of multiple genes involved in de novo nucleotide synthesis at the WSSV replication stage (12 hpi). Each bar represents mean ± SD gene expression of (a) LvG6PDH, LvTKT, LvPRPS, (b) LvATase, LvADSS, LvIMPDH, (c) LvCAD, LvDHODH, LvUMPS, and LvCMPK in four pooled samples of shrimp hemocytes (3 shrimp/pool) at the WSSV genome replication stage (12 hpi) and late stage (24 hpi). (d) Enzyme activity (Mean ± SD) of LvTKT and LvPRPS in shrimp hemocytes (4 pooled samples; 3 shrimp/pool) at the WSSV genome replication stage (12 hpi) and late stage (24 hpi). Differences between treatment groups are denoted by asterisks (* p < 0.05, ** p < 0.01)
Fig. 6
Fig. 6
Down-regulation of LvTKT, LvPRPS, LvIMPDH, LvCAD, LvDHODH, LvUMPS, and LvCMPK mRNA by specific dsRNA injection and its effect on WSSV IE1, VP28 gene expression and WSSV genome copy number. Gene silencing efficiency at (a) 24 h post WSSV injection. WSSV (b) IE1, (c) VP28 gene expression and (d) genome copy number were evaluated after gene silencing of LvTKT, LvPRPS, LvIMPDH, LvCAD, LvDHODH, LvUMPS, and LvCMPK. Groups treated with PBS only or with non-specific luciferase (Luc) dsRNA were used as control groups. Each bar represents the mean ± SD of mRNA expression. Asterisks indicate differences between the WSSV group and the corresponding control group (* p < 0.05, ** p < 0.01)
Fig. 7
Fig. 7
Ras, PI3K, and mTORC1/2 are involved in the regulation of de novo nucleotide synthesis. (a) Schematic of the Ras and PI3K-Akt-mTOR pathway and the 4 inhibitors used (green boxes). Target gene expression analysis of shrimp pretreated with: (b) Salirasib (S35, 35 µg/g shrimp); (c) Rapamycin (RAP, 0.02 µg/g shrimp), (d) LY294002 (0.625 µg/g shrimp); and (e) Torin1 (20 µg/g shrimp) with samples collected at 12 and 24 h post WSSV injection. The data are presented as mean ± SD, with asterisks indicating significant differences between the inhibitor-treated groups and their corresponding vehicle groups (* p < 0.05, ** p < 0.01). Hcy: hemocyte; PL: pleopod

References

    1. Food and Agriculture Organization of the United Nations. [https://www.fao.org/home/en]. The State of World Fisheries and Aquaculture 2024: Blue Transformation in Action. Rome: FAO; 2024. Available from: https://enaca.org/?id=1337
    1. Walker PJ, Mohan CV. Viral disease emergence in shrimp aquaculture: origins, impact and the effectiveness of health management strategies. Rev Aquac. 2009;1(2):125–54. 10.1111/j.1753-5131.2009.01007.x. - PMC - PubMed
    1. Naylor RL, Hardy RW, Buschmann AH, Bush SR, Cao L, Klinger DH, Little DC, Lubchenco J, Shumway SE, Troell M. A 20-year retrospective review of global aquaculture. Nature. 2021;591(7851):551–63. 10.1038/s41586-021-03308-6. - PubMed
    1. Mayer KA, Stöckl J, Zlabinger GJ, Gualdoni GA. Hijacking the supplies: metabolism as a novel facet of virus-host interaction. Front Immunol. 2019;10:1533. 10.3389/fimmu.2019.01533. - PMC - PubMed
    1. Sumbria D, Berber E, Mathayan M, Rouse BT. Virus infections and host metabolism-can we manage the interactions? Front Immunol. 2021;11:594963. 10.3389/fimmu.2020.594963. - PMC - PubMed

LinkOut - more resources