Variant effect predictor correlation with functional assays is reflective of clinical classification performance
- PMID: 40264194
- PMCID: PMC12016141
- DOI: 10.1186/s13059-025-03575-w
Variant effect predictor correlation with functional assays is reflective of clinical classification performance
Abstract
Background: Understanding the relationship between protein sequence and function is crucial for accurate classification of missense variants. Variant effect predictors (VEPs) play a vital role in deciphering this complex relationship, yet evaluating their performance remains challenging for several reasons, including data circularity, where the same or related data is used for training and assessment. High-throughput experimental strategies like deep mutational scanning (DMS) offer a promising solution.
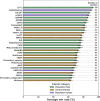
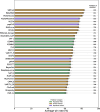
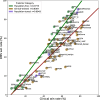
Results: In this study, we extend upon our previous benchmarking approach, assessing the performance of 97 VEPs using missense DMS measurements from 36 different human proteins. In addition, a new pairwise, VEP-centric approach mitigates the impact of missing predictions on overall performance comparison. We observe a strong correspondence between VEP performance in DMS-based benchmarks and clinical variant classification, especially for predictors that have not been directly trained on human clinical variants.
Conclusions: Our results suggest that comparing VEP performance against diverse functional assays represents a reliable strategy for assessing their relative performance in clinical variant classification. However, major challenges in clinical interpretation of VEP scores persist, highlighting the need for further research to fully leverage computational predictors for genetic diagnosis. We also address practical considerations for end users in terms of choice of methodology.
Keywords: ACMG/AMP; Benchmark; Circularity; DMS; MAVE; Multiplexed assay of variant effect; VEP; Variant effect predictor.
© 2025. The Author(s).
Conflict of interest statement
Declarations. Ethics approval and consent to participate.: Not applicable. Consent for publication: Not applicable. Competing interests: The authors declare no competing interests.
Figures


Similar articles
-
Updated benchmarking of variant effect predictors using deep mutational scanning.Mol Syst Biol. 2023 Aug 8;19(8):e11474. doi: 10.15252/msb.202211474. Epub 2023 Jun 13. Mol Syst Biol. 2023. PMID: 37310135 Free PMC article.
-
Using deep mutational scanning to benchmark variant effect predictors and identify disease mutations.Mol Syst Biol. 2020 Jul;16(7):e9380. doi: 10.15252/msb.20199380. Mol Syst Biol. 2020. PMID: 32627955 Free PMC article.
-
Interpreting protein variant effects with computational predictors and deep mutational scanning.Dis Model Mech. 2022 Jun 1;15(6):dmm049510. doi: 10.1242/dmm.049510. Epub 2022 Jun 23. Dis Model Mech. 2022. PMID: 35736673 Free PMC article. Review.
-
Understanding the heterogeneous performance of variant effect predictors across human protein-coding genes.Sci Rep. 2024 Oct 30;14(1):26114. doi: 10.1038/s41598-024-76202-6. Sci Rep. 2024. PMID: 39478110 Free PMC article.
-
Leveraging protein structural information to improve variant effect prediction.Curr Opin Struct Biol. 2025 Jun;92:103023. doi: 10.1016/j.sbi.2025.103023. Epub 2025 Feb 22. Curr Opin Struct Biol. 2025. PMID: 39987793 Review.
Cited by
-
Assessing variant effect predictors and disease mechanisms in intrinsically disordered proteins.PLoS Comput Biol. 2025 Aug 19;21(8):e1013400. doi: 10.1371/journal.pcbi.1013400. eCollection 2025 Aug. PLoS Comput Biol. 2025. PMID: 40828855 Free PMC article.
-
Image-based, pooled phenotyping reveals multidimensional, disease-specific variant effects.bioRxiv [Preprint]. 2025 Jul 5:2025.07.03.663081. doi: 10.1101/2025.07.03.663081. bioRxiv. 2025. PMID: 40631108 Free PMC article. Preprint.
References
-
- Richards S, Aziz N, Bale S, Bick D, Das S, Gastier-Foster J, et al. Standards and guidelines for the interpretation of sequence variants: a joint consensus recommendation of the American College of Medical Genetics and Genomics and the Association for Molecular Pathology. Genet Med. 2015;17:405–23. - PMC - PubMed
MeSH terms
Grants and funding
LinkOut - more resources
Full Text Sources

