. 2025 Apr 22;23(1):193.
doi: 10.1186/s12964-025-02144-9.

Mechanical cues rewire lipid metabolism and support chemoresistance in epithelial ovarian cancer cell lines OVCAR3 and SKOV3

Affiliations

Mechanical cues rewire lipid metabolism and support chemoresistance in epithelial ovarian cancer cell lines OVCAR3 and SKOV3

Martina Karasová et al. Cell Commun Signal. .

Abstract

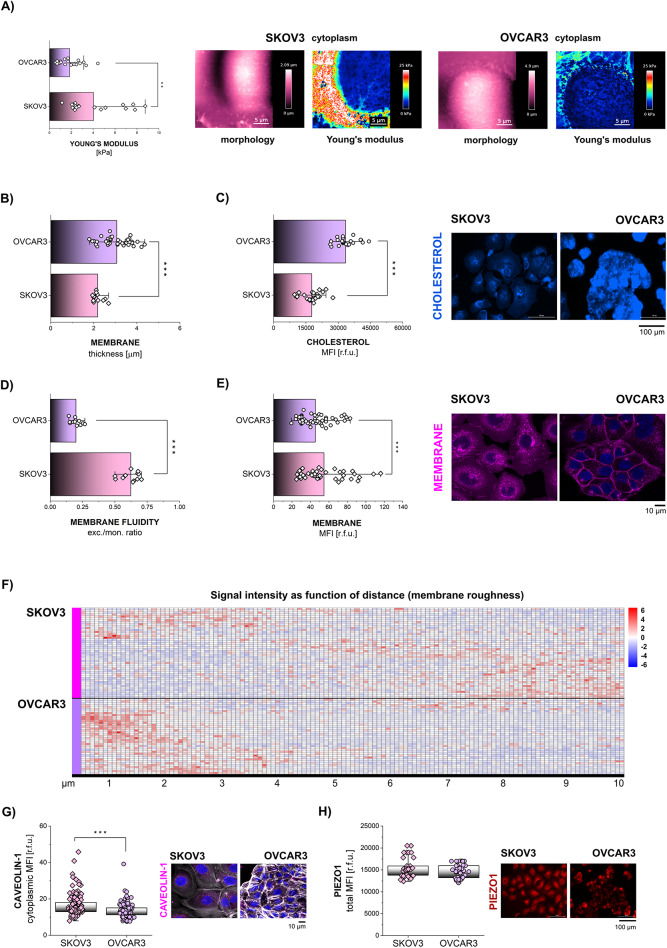
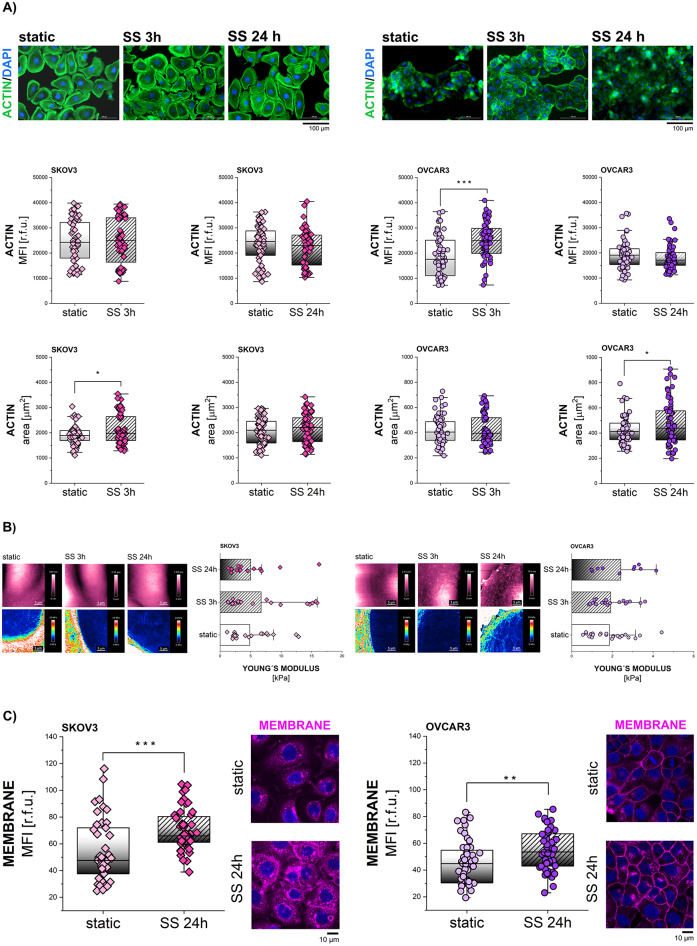
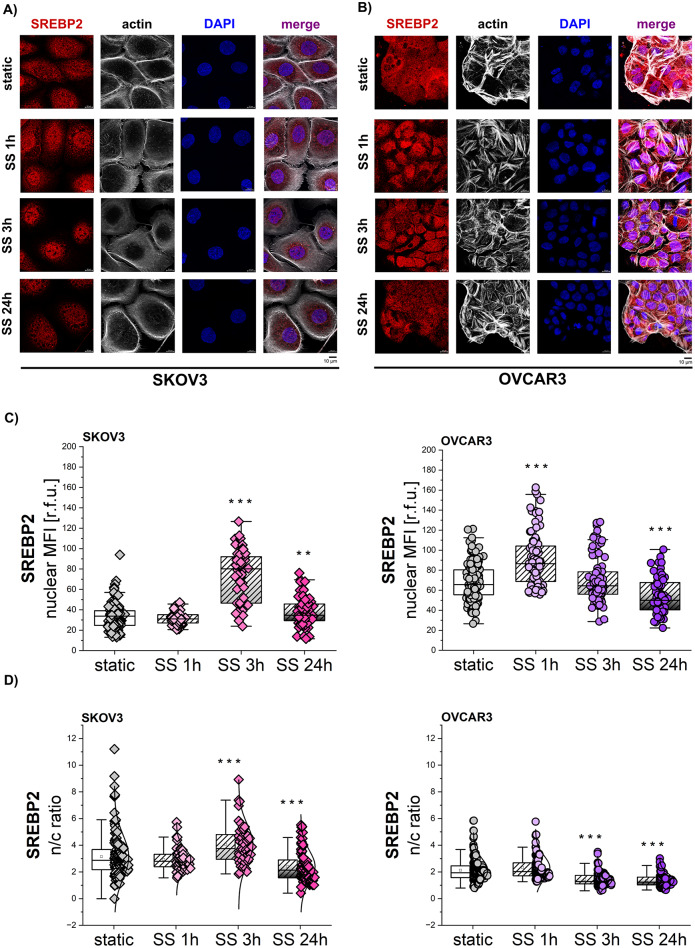
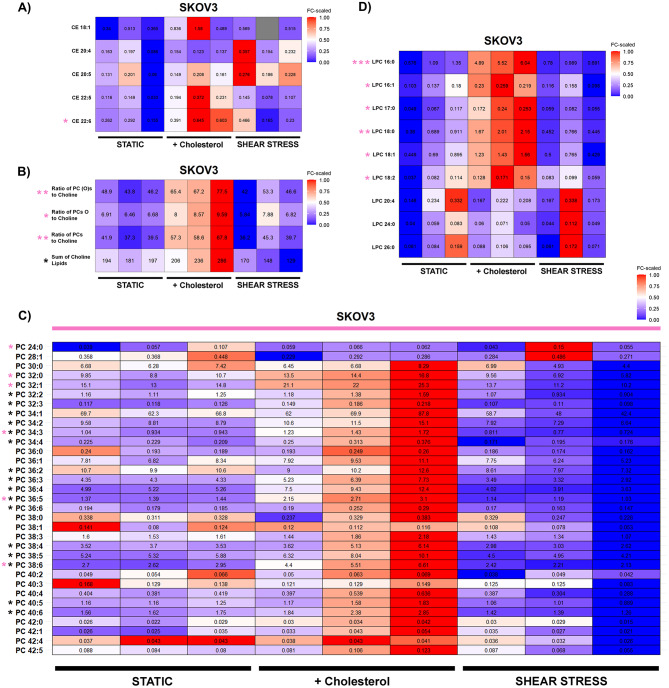
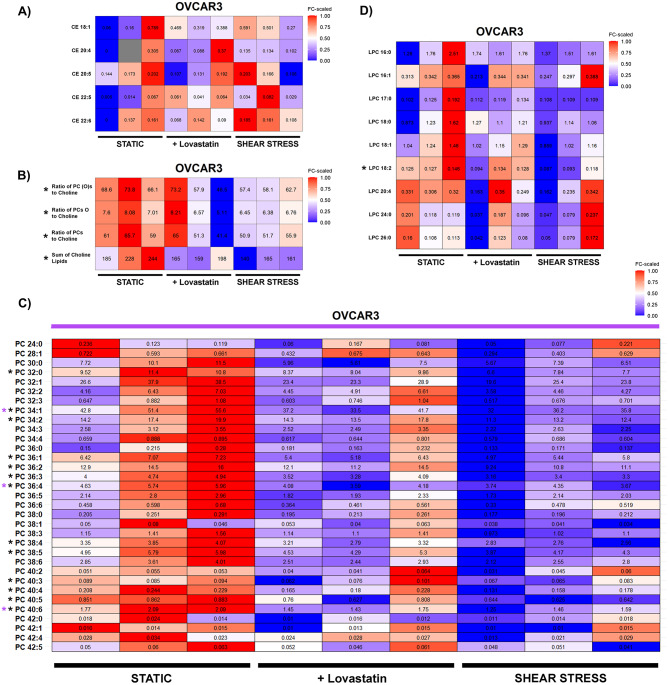
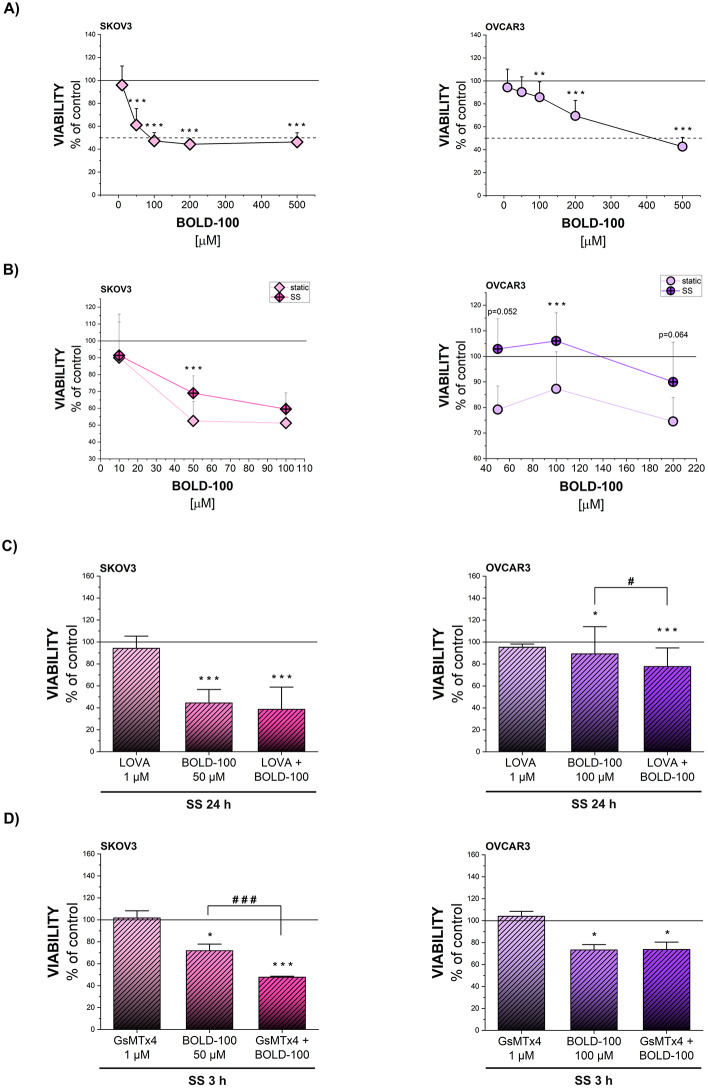
Epithelial ovarian cancer (EOC) is one of the deadliest cancers in women, and acquired chemoresistance is a major contributor of aggressive phenotypes. Overcoming treatment failure and disease recurrence is therefore an ambitious goal. Ovarian cancer develops in a biophysically challenging environment where the cells are constantly exposed to mechanical deformation originating in the abdomen and shear stress caused by the accumulation of ascitic fluid in the peritoneal cavity. Therefore, mechanical stimulation can be seen as an inseparable part of the tumor microenvironment. The role of biomechanics in shaping tumor metabolism is emerging and promises to be a real game changer in the field of cancer biology. Focusing on two different epithelial ovarian cancer cell lines (SKOV3 and OVCAR3), we explored the impact of shear stress on cellular behavior driven by mechanosensitive transcription factors (TFs). Here, we report data linking physical triggers to the alteration of lipid metabolism, ultimately supporting increased chemoresistance. Mechanistically, shear stress induced adaptation of cell membrane and actin cytoskeleton which were accompanied by the regulation of nuclear translocation of SREBP2 and YAP1. This was associated with increased cholesterol uptake/biosynthesis and decreased sensitivity to the ruthenium-based anticancer drug BOLD-100. Overall, the present study contributes to shedding light on the molecular pathways connecting mechanical cues, tumor metabolism and drug responsiveness.

Keywords: BOLD-100; Lipid metabolism; Mechanosensitive transcription factors; Mechanotransduction; Ovarian cancer; SREBP2; YAP1.


Conflict of interest statement

Declarations. Ethics approval and consent to participate: Not applicable. Consent for publication: Yes. Competing interests: The authors declare no competing interests.

Figures

Fig. 1
Fig. 1
Mechanosensory apparatus in EOC: cell membrane (A) Quantification of the Young’s modulus [kPa] median per ROI for cytoplasmic areas of the SKOV3 and OVCAR3 cells with representative AFM maps. The height is shown in pink, the Young’s modulus depicting values between 0–25 kPa is shown in blue-to-red. (B) Plasma membrane thickness [µm] measured at 3 different points per cell. (C) Cholesterol quantification [r.f.u.] with representative images of plasma membrane cholesterol signal depicted in blue. (D) Membrane fluidity [PDA excimers/monomers ratio]. (E) Membrane intensity [r.f.u.] with representative images of PM appearance in magenta, nuclei in blue. (F) Membrane roughness expressed as signal intensity of the PM staining as function of distance. Segments of 10 μm were taken into final heatmap visualization. Rows depict single cells, n > 37 for each cell line. (G) Cytoplasmic expression of Caveolin-1 [r.f.u.] with representative images. Caveolin-1 is depicted in magenta, actin cytoskeleton in white and nuclei in blue. (H) Total protein level of PIEZO1 [r.f.u.] and representative images (depicted in red). All experiments were performed in at least 3 independent biological replicates. Statistical significance calculated with t-test and shown as * p < 0.05, ** p < 0.01, *** p < 0.001
Fig. 2
Fig. 2
Mechanosensory apparatus in EOC: PIEZO1 activity (A) Illustrative curves of intracellular Ca2+ levels as function of time with the first increase after YODA1 (5 µM) treatment highlighted in box (B) Immediate increase (1 min) in intracellular Ca2+ levels in cells treated with YODA1 (5 µM) with or without pre-treatment with YODA1 (1 µM) for 24 h. Increase is expressed as percentage of increase/basal levels ratio. * represents the difference between treatment and respective control, # represents differences between cell lines. (C) Total increase (23 min) in intracellular Ca2+ levels in cells treated with YODA1 (5 µM) with or without pre-treatment with YODA1 (1 µM) for 24 h. Increase is expressed as percentage of increase/basal levels ratio. * represents the difference between treatment and respective control, # represents differences between cell lines. (D) Quantification of PIEZO1 expression [r.f.u.] at the plasma membrane in cells exposed to SS for 3 h and 24 h and in respective static controls. All experiments were performed in at least 3 independent biological replicates. Statistical significance calculated with t-test and one-way ANOVA, and shown as */# p < 0.05, **/## p < 0.01, ***/### p < 0.001
Fig. 3
Fig. 3
Shear stress stimulation in EOC: cell morphometric adjustment. (A) Quantification of actin cytoskeleton of cells exposed to SS (3 h and 24 h) and respective static controls. Actin intensity is expressed as MFI [r.f.u.], cytoplasmic area is expressed in [µm2]. In representative images, actin is depicted in green, nuclei in blue. (B) Quantification of the Young’s modulus median per ROI [kPa] for cytoplasmic areas of the SKOV3 and OVCAR3 cells exposed to SS (3 h and 24 h) and respective static controls. Representative AFM maps show the height depicted in pink, the Young’s modulus representing maps depict values between 0–20 kPa (shown in blue-to-red). (C) Quantification of PM intensity [r.f.u.] in cells exposed to 24 h SS and in respective static controls. In representative images, PM depicted in magenta, nuclei in blue. Statistical significance calculated with t-test and shown as * p < 0.05, ** p < 0.01, *** p < 0.001
Fig. 4
Fig. 4
Shear stress stimulation in EOC: mechanosensitive regulation of SREBP2 A + B) Representative images of SREBP2 depicted in red, actin cytoskeleton in white and nuclei in blue. C) Nuclear protein levels of SREBP2 [r.f.u.] in cells exposed to 1 h, 3 h and 24 h of SS and in respective static controls. D) SREBP2 nuclear/cytoplasmic ratio (n/c ratio) in cells exposed to 1 h, 3 h and 24 h of SS and in respective static controls. All experiments were performed in at least 3 independent biological replicates. Statistical significance calculated with t-test and shown as * p < 0.05, ** p < 0.01, *** p < 0.001
Fig. 5
Fig. 5
Shear stress stimulation in EOC: impact on cholesterol biosynthesis and uptake (A) Quantification of cholesterol level [r.f.u.] in cells exposed to 1 h, 3 h and 24 h of SS and in respective static control. Representative images show cholesterol at plasma membrane depicted in blue. (B) Quantification of cholesterol level [r.f.u.] in cells exposed to 1 h, 3 h and 24 h of SS in presence of LOVA (1 µM) for 1, 3–24 h, respectively. * depicts significant differences between LOVA treatment and solvent control (C) Quantification of LDLR expression [r.f.u.] at the plasma membrane in cells exposed to 3 h and 24 h of SS and in respective static controls. In illustrative images LDLR depicted in red. (D) Quantification of cholesterol level [r.f.u.] in cells exposed to 3 h SS and in respective static controls in presence of 10% serum (control) or 0% serum. * depicts significant differences between 10% serum (control) and 0% serum. # depicts difference between static and SS. Representative images show cholesterol at plasma membrane depicted in blue. All experiments were performed in at least 3 independent biological replicates. Statistical significance calculated with t-test and shown as */# p < 0.05, **/## p < 0.01, ***/### p < 0.001
Fig. 6
Fig. 6
Shear stress stimulation in EOC: mechanosensitive regulation of YAP1. A + B Quantification of YAP1 n/c ratio and nuclear signal in cells exposed to 1 h, 3 h and 24 h of SS expressed as percentage of static control. Representative images show YAP1 depicted in red. Heatmap represents kinetics of changes in nuclear (NUC), cytoplasmic (CYTO), total YAP1 protein level and n/c ratio. Data expressed as percentage of static control. * depicts significant differences between SS and static control, # depicts significant differences between SS 1 h and SS 3 h, SS 24 h, respectively. C + D Quantification of LATS1 and p-LATS1 in nuclear and cytoplasmic compartment of the cells exposed to 1 h, 3 h SS, expressed as percentage of static control. Representative images show LATS1 and p-LATS1 depicted in red. All experiments were performed in at least 3 independent biological replicates. Statistical significance calculated with t-test and shown as */# p < 0.05, **/## p < 0.01, ***/### p < 0.001
Fig. 7
Fig. 7
PIEZO1 and calcium-driven translocation of TFs. A + B Quantification of YAP1 n/c ratio in cells in static conditions or exposed to 1–3 h of SS with or without treatment (Ca2+ free, 1 µM GsMTx4). Representative images show YAP1 depicted in blue. * depicts significant differences between control and treatment. C + D Quantification of SREBP2 n/c ratio in cells in static conditions or exposed to 1–3 h of SS with or without treatment (Ca2+ free, 1 µM GsMTx4). Representative images show SREBP2 depicted in magenta. * depicts significant differences between control and treatment according to t-test (* p < 0.05, ** p < 0.01, *** p < 0.001). All experiments were performed in at least 3 independent biological replicates
Fig. 8
Fig. 8
Mevalonate pathway inhibition regulates SS-induced YAP1 nuclear translocation. (A) Quantification of SREBP2 n/c ratio in cells exposed to 24 h SS with or without presence of LOVA 1 µM. (B) Quantification of YAP1 n/c ratio in cells exposed to 24 h SS with or without presence of LOVA 1 µM. Representative images show SREBP2 depicted in magenta, YAP1 depicted in blue, and actin depicted in white. All experiments were performed in at least 3 independent biological replicates. Statistical significance calculated with t-test and shown as * p < 0.05, ** p < 0.01, *** p < 0.001 between LOVA treatment and solvent control
Fig. 9
Fig. 9
A-D Heatmaps showing graphical representation of metabolome data in SKOV3 cells comparing static controls, static controls treated with cholesterol 10 µg/ml (SKOV3) for 24 h, and cells exposed to SS for 24 h. If not otherwise specified, values represent metabolite concentrations [µM]. (A) cholesterol ester species (CE), (B) Ratios of PCs to choline, (C) phosphatidylcholine species (PC) (D) lyso-phosphatidylcholine species (LPC). Color coding from red-to-blue represents values from high-to-low. Gray entry represents measurement failure. All experiments were performed in at least 3 independent biological replicates. * black indicates statistical significance calculated with t-test between static control and 24 h shear stress, * pink indicates statistical significance calculated with t-test between treatment and control. Significance is shown as * p < 0.05, ** p < 0.01, *** p < 0.001
Fig. 10
Fig. 10
A-D Heatmaps showing graphical representation of metabolome data in OVCAR3 cells comparing static controls, static controls treated with lovastatin 1 µM for 24 h, and cells exposed to SS for 24 h. If not otherwise specified, values represent metabolite concentrations [µM] (A) cholesterol ester species (CE), (B) Ratios of PCs to choline, (C) phosphatidylcholine species (PC) (D) lyso-phosphatidylcholine species (LPC). Color coding from red-to-blue represents values from high-to-low. Gray entry represents measurement failure. All experiments were performed in at least 3 independent biological replicates. * black indicates statistical significance calculated with t-test between static control and 24 h shear stress, * violet indicates statistical significance calculated with t-test between treatment and control. Significance is shown as * p < 0.05, ** p < 0.01, *** p < 0.001
Fig. 11
Fig. 11
Effect of SS on chemoresistance of OC cells to BOLD-100. (A) Viability of cells treated with BOLD-100 in concentration range 10–500 µM for 48 h measured by crystal violet assay. Results expressed as percentage of solvent control. (B) Viability of cells treated with BOLD-100 in concentration range 10–100 µM for 48 h for SKOV3 and 50–200 µM for 48 h for OVCAR3 with or without preconditioning with 24 h SS measured by crystal violet assay. Results expressed as percentage of solvent control for both static and SS conditions. * depicts significant difference between static and SS conditions. (C) Viability of cells exposed to 24 h SS with or without presence of LOVA (1 µM) and afterwards treated with BOLD-100 in concentration 50 µM (SKOV3), 100 µM (OVCAR3) for 48 h, measured by crystal violet assay. * depicts significant difference between solvent control and treatments, # depicts significant difference between BOLD-100 treatment and combination LOVA and BOLD-100. (D) Viability of cells exposed to 3 h SS with or without presence of GsMTx4 (1 µM) and afterwards treated with BOLD-100 in concentration 50 µM (SKOV3), 100 µM (OVCAR3) for 48 h, measured by crystal violet assay. * depicts significant difference between solvent control and treatments, # depicts significant difference between BOLD-100 treatment and combination GsMTx4 and BOLD-100. Statistical significance was calculated with t-test and multiple comparisons by one-way ANOVA test and shown as */# p < 0.05, **/## p < 0.01, ***/### p < 0.001

Similar articles

Cited by

References

    1. Bao L et al. The relationship between cancer and biomechanics. Front Oncol. 2023;13:1273154. - PMC - PubMed
    1. Shieh AC. Biomechanical forces shape the tumor microenvironment. Ann Biomed Eng. 2011;39(5):1379–89. - PubMed
    1. de Visser KE, Joyce JA. The evolving tumor microenvironment: from cancer initiation to metastatic outgrowth. Cancer Cell. 2023;41(3):374–403. - PubMed
    1. Follain G, et al. Fluids and their mechanics in tumour transit: shaping metastasis. Nat Rev Cancer. 2020;20(2):107–24. - PubMed
    1. Barnes BM, et al. Distinct transcriptional programs stratify ovarian cancer cell lines into the five major histological subtypes. Genome Med. 2021;13(1):140. - PMC - PubMed

MeSH terms

Substances

LinkOut - more resources