. 2025 Jul;175(3):300-322.
doi: 10.1111/imm.13931. Epub 2025 Apr 22.

Human γδ T Cell Function Is Impaired Upon Mevalonate Pathway Inhibition

Affiliations

Human γδ T Cell Function Is Impaired Upon Mevalonate Pathway Inhibition

Tsz Kin Suen et al. Immunology. 2025 Jul.

Abstract

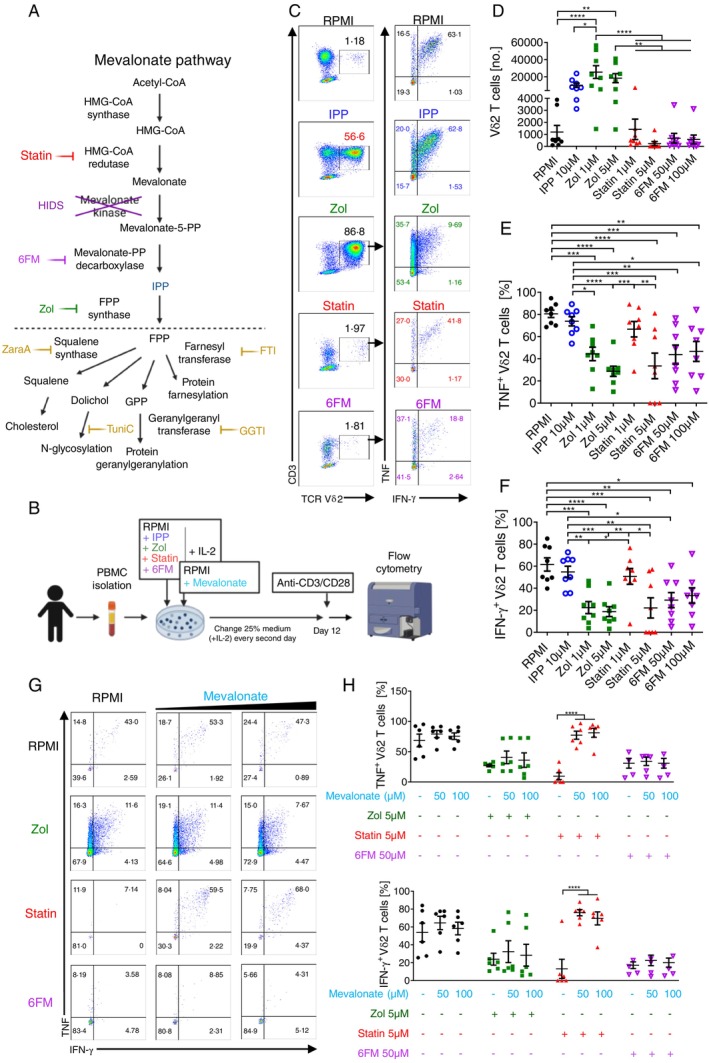
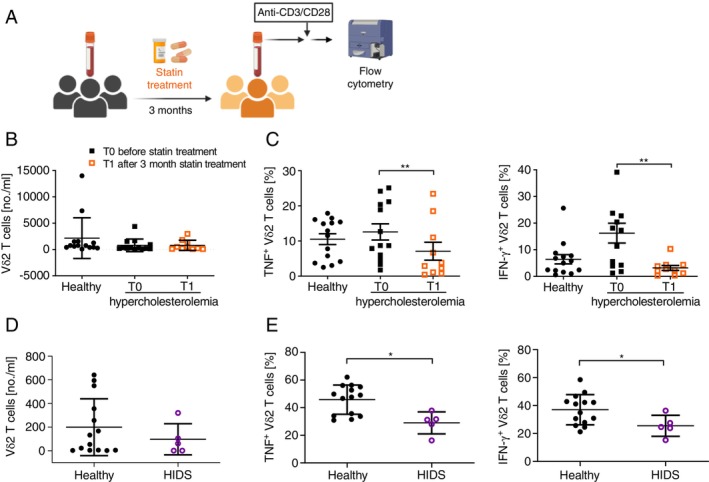
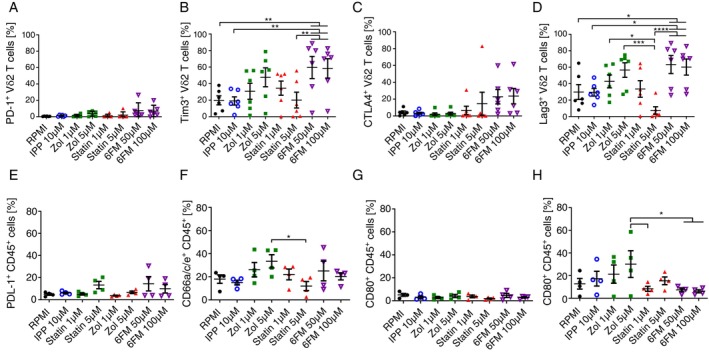
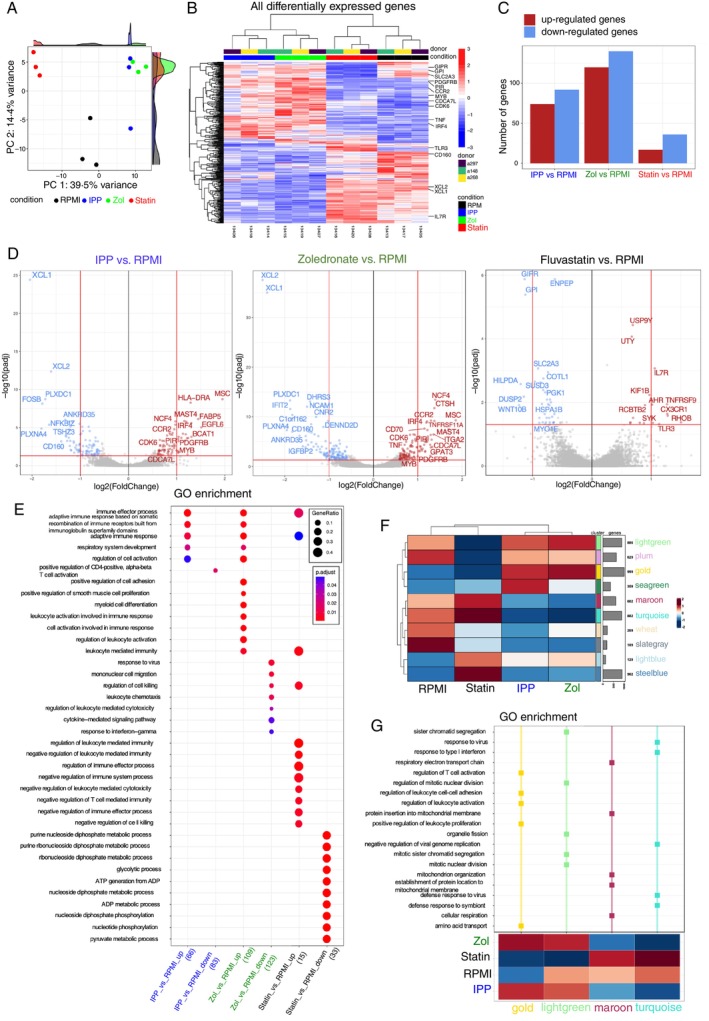
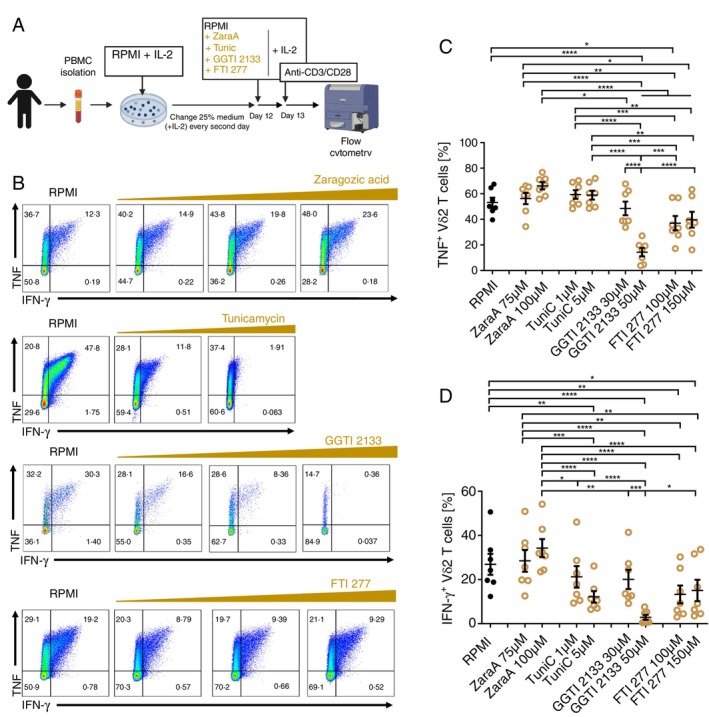
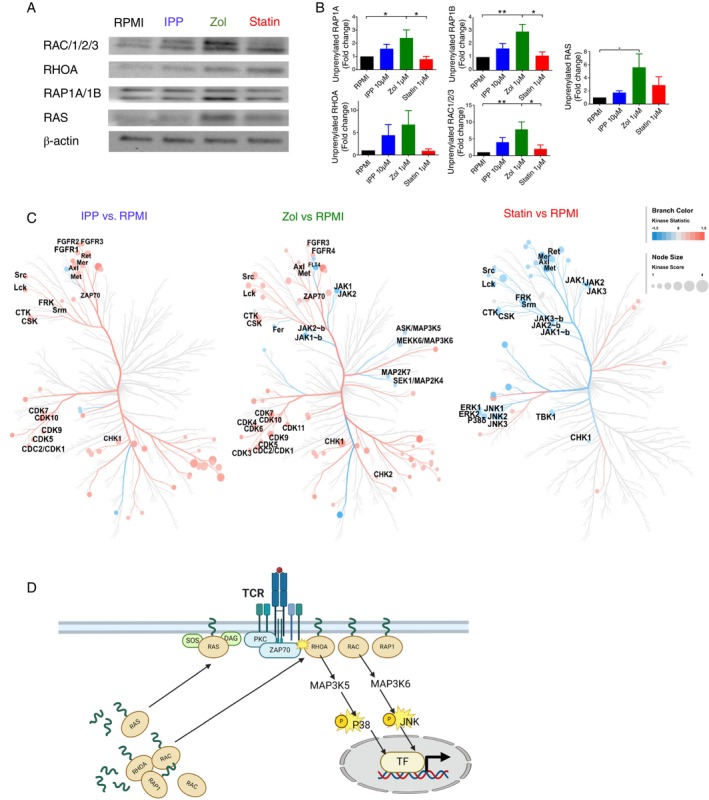
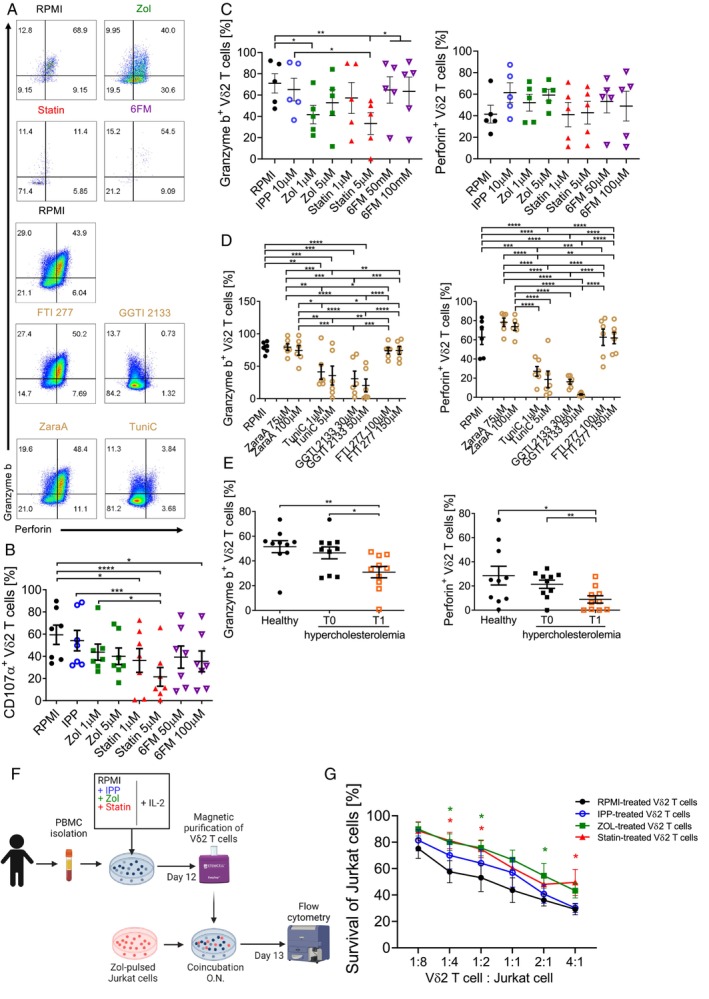
Vδ2 T cells, a predominant human peripheral γδ T cell population, are a promising candidate for the development of immunotherapies against cancer and infected cells. Aminobisphosphonate drugs, such as zoledronate, are commonly used to expand Vδ2 T cells. Yet, such in vitro generated cells have limited efficacy in the clinic. We found that despite inducing excessive proliferation of Vδ2 T cells, zoledronate impaired their effector function and caused the upregulation of the inhibitory receptor TIM3. This effect was due to the inhibition of mevalonate metabolism and dysregulation of downstream biological processes such as protein prenylation and intracellular signalling. In vitro and in vivo inhibition of mevalonate metabolism with zoledronate, statins, and 6-fluoromevalonate, as well as genetic deficiency of the mevalonate kinase, all resulted in compromised cytokine and cytotoxic molecule production by Vδ2 T cells. Impaired Vδ2 T cell function was accompanied by transcriptome and kinome changes. Our findings reveal the importance of mevalonate metabolism for the proper functioning of Vδ2 T cells. This observation provides important considerations for improving their therapeutic use and has repercussions for patients with statin or aminobisphosphonate treatments.

Keywords: T cell; cytokines; flow cytometry; human; protein kinases/phophatases.


Conflict of interest statement

L.A.B.J. and M.G.N. are scientific founders of TTxD and Lemba. The other authors declare no conflicts of interest.

Figures

FIGURE 1
FIGURE 1
In vitro inhibition of mevalonate pathway results in compromised TNF and IFN‐γ production by Vδ2 T cells. (A) Schematic representation of the mevalonate pathway, the inhibitors used in the study and downstream biological processes: Fluvastatin (Statin) inhibits HMG‐CoA reductase; Hyper IgD syndrome (HIDS) is caused by deficiency in mevalonate kinases; 6‐fluoromevalonate (6FM) inhibits mevalonate‐5‐PP decarboxylase; zoledronate (Zol) inhibits FPP synthase; zaragozic acid (ZaraA) inhibits squalene synthase; Tunicamycin (TuniC) alters N‐linked glycosylation of proteins; GGTI 2133 inhibits geranylgeranyl transferase; and FTI 277 (FTI) inhibits farnesyl transferase. (B) Experimental setup for in vitro inhibition of mevalonate pathway and rescue experiment with mevalonic acid. (C–F) Flow cytometry analysis of Vδ2 T cells in 12‐days PBMC cultures treated with indicated inhibitors (Mean ± SEM, n = 8): (C) representative dot plots showing percentage of Vδ2 T cells in PBMC cultures (left column) and percentage of TNF+ and IFN‐γ+ Vδ2 T cells (right column); (D) cumulative numbers of Vδ2 T cells; (E) cumulative percentages of TNF+ and (F) IFN‐γ+ Vδ2 T cells. (G) Representative FACS plots showing percentage of cytokine‐producing Vδ2 T cells in PBMC cultures treated with indicated inhibitors in the presence or absence of mevalonic acid (50 or 100 μM). (H) Cumulative percentage of TNF+ and IFN‐γ+ Vδ2 T cells in PBMC cultures treated with indicated inhibitors in the presence or absence of mevalonic acid (Mean ± SEM, n = 6). Each dot represents one donor in (D–F) and (H), repeated measures one‐way ANOVA followed by Tukey's multiple comparisons test, *p value < 0.05. 6FM: 6‐fluoromevalonate. Created with Biorender. FPP: farnesyl pyrophosphate; GPP: geranyl pyrophosphate; HIDS: hyper IgD syndrome; HMG‐CoA: β‐hydroxy β‐methylglutaryl‐coenyzme A; mevalonate‐5‐PP decarboxylase: mevalonate diphosphate decarboxylase.
FIGURE 2
FIGURE 2
In vivo inhibition of mevalonate pathway results in compromised TNF and IFN‐γ production by Vδ2 T cells. (A) Schematic representation of flow cytometry analysis of peripheral blood from patients with hypercholesterolemia before and after 3‐months of statin treatment (atorvastatin or rosuvastatin). (B) Number of Vδ2 T cells and (C) percentage of TNF+ and IFN‐γ+ Vδ2 T cells in healthy individuals and patients with hypercholesterolemia before and after 3‐months of statin treatment (Mean ± SEM, n = 13: Patients T0; n = 10 patients T1; n = 14: Healthy donors; Mann–Whitney test: Patients and healthy donors; Wilcoxon test: Before and after treatment, *p value < 0.05). (D) Number of Vδ2 T cells and (E) percentage of TNF+ and IFN‐γ+ Vδ2 T cells in healthy individuals and patients with Hyper IgD syndrome, (Mean ± SEM, n = 5: Patients; n = 14: Healthy donors; Mann–Whitney test, *p value < 0.05) Created with Biorender.
FIGURE 3
FIGURE 3
Zoledronate upregulates exhaustion marker TIM3 on Vδ2 T cells. (AH) Flow cytometry analysis of Vδ2 T cells in 12‐days PBMC cultures treated with indicated inhibitors: Cumulative percentage of (A) PD‐1+, (B) TIM3+, (C) LAG3+ and (D) CTLA4+ Vδ2 T cells (Mean ± SEM, n = 6); Cumulative percentage of (E) PDL1+, (F) CD66a/c/e+, (G) CD80+ and (H) CD86+ expression on CD45+ cells (Mean ± SEM, n = 4). Each dot represents one donor (repeated measures one‐way ANOVA followed by Tukey's multiple comparisons test, *p value < 0.05).
FIGURE 4
FIGURE 4
Mevalonate pathway inhibition induces transcriptome changes in Vδ2 T cells. (A–G) RNA‐seq analysis of Vδ2 T cells isolated from 12‐days‐PBMC cultures treated with IPP, zoledronate (Zol), fluvastatin (Statin) or RPMI alone (n = 3). (A) Principal component analysis coloured by experimental conditions: RPMI (black), IPP (blue), Zol (green) and Statin (red). (B) Clustered heatmap showing 479 differentially regulated genes between RPMI, IPP, Zol and Statin conditions. Selected genes are annotated. (C) Number of differentially expressed genes in IPP, Zol and Statin conditions versus RPMI. (D) Volcano plot demonstrating differentially upregulated and downregulated transcripts. Grey points indicate genes with p values > 0.05 and log2fold change > sigFC = −2 and < sigFC = 2. Blue points indicate genes with p values < 0.05 and log2fold change < sigFC = −2. Red points indicate genes with p values < 0.05 and log2fold change > sigFC = 2. (E) Enrichment dot plots for IPP over RPMI, Zol over RPMI and Statin over RPMI treatments, showing most significantly enriched GO terms. The topmost enriched terms with adjusted p values ≤ 0.1 are demonstrated. (F) hCoCena Integrated group fold change (GFC) heat map showing hierarchical clustering and gene modules identified by hCoCena analysis for the RPMI, IPP, zol and statin‐treated groups. Numbers and bar‐plots on the right side reflect the sizes of the modules. (G) Functional enrichment of hCoCena‐derived modules using the GO gene set database. Selected top terms were visualised.
FIGURE 5
FIGURE 5
Inhibition of protein prenylation impairs TNF and IFN‐γ production by Vδ2 T cells. (A) Experimental setup for the in vitro inhibition of downstream mevalonate pathways. PBMCs were first expanded with IPP in the presence of IL‐2 for 12 days. On day 12, the indicated inhibitors: Zaragozic acid (75 and 100 μM), tunicamycin (1 and 5 μM), geranylgeranyl transferase inhibitor (GGTI2133; 30 and 50 μM) and farnesyl transferase inhibitor (FTI277; 100 and 150 μM) were added for overnight incubation. (B–D) Flow cytometry analysis of Vδ2 T cells in PBMC cultures treated as described above (Mean ± SEM, n = 7). (B) Representative dot plots showing percentage of TNF+ and IFN‐γ+ Vδ2 T cells in PBMC cultures; (C) cumulative percentage of TNF+ and (D) IFN‐γ+ Vδ2 T cells in PBMC cultures. Each dot represents one donor (repeated measures one‐way ANOVA followed by Tukey's multiple comparisons test, *p value < 0.05). Created with Biorender.
FIGURE 6
FIGURE 6
In vitro inhibition of the mevalonate pathway leads to dysregulation of signal transduction pathways in Vδ2 T cells. (A) Representative Western Blot image showing enrichment of unprenylated small G proteins: RAC, RHOA, RAP1 and RAS in the cytosol of Vδ2 T cells isolated from 12‐days‐PBMC cultures treated with the indicated inhibitors. (B) Quantification of cytosolic small G proteins in Western Blot using imageJ. Fold change was calculated over RPMI condition (Mean ± SEM, n = 5) (repeated measures one‐way ANOVA followed by Tukey's multiple comparisons test, *p value < 0.05). (C) PamGene analysis of kinase activity in Vδ2 T cells isolated from PBMCs cultured 12 days with IPP, zoledronate, fluvastatin or RPMI alone and restimulated for 10 min with anti‐CD3/CD28 (n = 7): Kinome tree showing kinases with up‐ and down‐regulated activity in Vδ2 T cells. (D) Schematic representation of the molecular mechanisms by which mevalonate metabolism fuels Vδ2 T cell function. Briefly, FPP generated in the mevalonate pathway serves for protein prenylation. Among prenylated proteins are small GTPases which when prenylated anchor to the cell membrane where they interact with various receptors including T cell receptor (TCR). Upon TCR stimulation small GTPases are activated and transduce the signal to the nucleus by activating downstream signalling pathways such as MAPK signalling. This results in transcription factors recruitment to the nucleus and induction of effector gene expression. Mevalonate pathway inhibition results in impaired protein prenylation and consequently compromised signal transduction upon TCR activation resulting in impaired Vδ2 T cell function. Created with Biorender. FPP: farnesyl pyrophosphate; GGPP: Geranylgeranyl pyrophosphate; JNK: c‐Jun N‐terminal kinases; MAP3K: Mitogen‐Activated Protein Kinase Kinase Kinase; Rac: Ras‐related C3 botulinum toxin substrate; RAP1, Ras‐related protein 1; Ras: Rat sarcoma; RHOA: Ras homologue family member A; TF: transcription factor.
FIGURE 7
FIGURE 7
Mevalonate metabolism is important for cytotoxic properties of Vδ2 T cells. (A–D) Flow cytometry analysis of Vδ2 T cells in PBMC cultures treated as previously with indicated inhibitors (Mean ± SEM, (A, C) n = 5; (B): n = 7, (D) n = 6): (A) representative dot plots showing percentage of granzyme B+ and perforin+ Vδ2 T cells; cumulative percentage of (B) CD107a+, (C, D), granzyme B+ (left panel) and perforin+ (right panel) Vδ2 T cells in PBMC cultures after incubation with indicated inhibitors (repeated measures one‐way ANOVA followed by Tukey's multiple comparisons test, *p value < 0.05). (E) Cumulative percentage of granzyme B+ and perforin+ Vδ2 T cells in patients with hypercholesterolemia before and after 3‐months of statin treatment (Mean ± SEM, n = 10: Patients T0, T1; n = 10: healthy donors); (Mann–Whitney test: patients and healthy donors; Wilcoxon test: before and after treatment, *p value < 0.05). (B–E) Each dot represents one donor. (F–G) in vitro Vδ2 T cell cytotoxic assay: (F) schematic representation of the experimental setup: PBMCs were incubated for 12 days with the indicated stimulus or inhibitors in the presence of IL‐2. The Vδ2 T cells were isolated from PBMC cultures by magnetic purification and co‐incubated with Jurkat cell at different cell to cell ratios. (G) Percentage of Jurkat cells survival after co‐incubation with Vδ2 T cells assessed by flow cytometry and normalised to Jurkat cell cultures without Vδ2 T cells (Mean ± SEM, n = 5); (repeated measures one‐way ANOVA followed by Tukey's multiple comparisons test, p value < 0.05). Created with Biorender.

Similar articles

References

    1. Puan K. J., Jin C., Wang H., et al., “Preferential Recognition of a Microbial Metabolite by Human V 2V 2 T Cells,” International Immunology 19, no. 5 (March 2007): 657–673. - PubMed
    1. Eberl M., Hintz M., Reichenberg A., Kollas A. K., Wiesner J., and Jomaa H., “Microbial Isoprenoid Biosynthesis and Human γδ T Cell Activation,” FEBS Letters 544, no. 1–3 (June 2003): 4–10. - PubMed
    1. Morita C. T., Jin C., Sarikonda G., and Wang H., “Nonpeptide Antigens, Presentation Mechanisms, and Immunological Memory of Human Vγ2Vδ2 T Cells: Discriminating Friend From Foe Through the Recognition of Prenyl Pyrophosphate Antigens,” Immunological Reviews 215, no. 1 (February 2007): 59–76. - PubMed
    1. Deseke M. and Prinz I., “Ligand Recognition by the γδ TCR and Discrimination Between Homeostasis and Stress Conditions,” Cellular & Molecular Immunology 17, no. 9 (September 2020): 914–924. - PMC - PubMed
    1. Karunakaran M. M., Subramanian H., Jin Y., et al., “A Distinct Topology of BTN3A IgV and B30.2 Domains Controlled by Juxtamembrane Regions Favors Optimal Human γδ T Cell Phosphoantigen Sensing,” Nature Communications 14, no. 1 (November 2023): 7617. - PMC - PubMed

MeSH terms

Substances