. 2025 Jul;24(7):e70063.
doi: 10.1111/acel.70063. Epub 2025 Apr 23.

The 15-Year Survival Advantage: Immune Resilience as a Salutogenic Force in Healthy Aging

Collaborators, Affiliations

The 15-Year Survival Advantage: Immune Resilience as a Salutogenic Force in Healthy Aging

Muthu Saravanan Manoharan et al. Aging Cell. 2025 Jul.

Abstract

Human aging presents an evolutionary paradox: while aging rates remain constant, healthspan and lifespan vary widely. We address this conundrum via salutogenesis-the active production of health-through immune resilience (IR), the capacity to resist disease despite aging and inflammation. Analyzing ~17,500 individuals across lifespan stages and inflammatory challenges, we identified a core salutogenic mechanism: IR centered on TCF7, a conserved transcription factor maintaining T-cell stemness and regenerative potential. IR integrates innate and adaptive immunity to counter three aging and mortality drivers: chronic inflammation (inflammaging), immune aging, and cellular senescence. By mitigating these aging mechanisms, IR confers survival advantages: At age 40, individuals with poor IR face a 9.7-fold higher mortality rate-a risk equivalent to that of 55.5-year-olds with optimal IR-resulting in a 15.5-year gap in survival. Optimal IR preserves youthful immune profiles at any age, enhances vaccine responses, and reduces burdens of cardiovascular disease, Alzheimer's, and serious infections. Two key salutogenic evolutionary themes emerge: first, female-predominant IR, including TCF7, likely reflects evolutionary pressures favoring reproductive success and caregiving; second, midlife (40-70 years) is a critical window where optimal IR reduces mortality by 69%. After age 70, mortality rates converge between resilient and non-resilient groups, reflecting biological limits on longevity extension. TNFα-blockers restore salutogenesis pathways, indicating IR delays aging-related processes rather than altering aging rates. By reframing aging as a salutogenic-pathogenic balance, we establish TCF7-centered IR as central to healthy longevity. Targeted midlife interventions to enhance IR offer actionable strategies to maximize healthspan before biological constraints limit benefits.

Keywords: Alzheimer's disease; T cell; accelerated aging; cardiac declines with age; inflammation; lifespan; longevity regulation; senescence.


Conflict of interest statement

The authors declare no conflicts of interest.

Figures
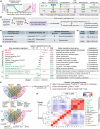
FIGURE 1
FIGURE 1
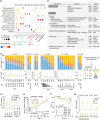
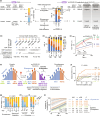
Models and transcriptomic metrics of immune resilience (IR) and the components of the pathogenic triad. (a) Model: Evolution, salutogenesis, salutogenic traits, and aging. + and −, survival‐associated trait (blue) versus mortality‐associated trait (yellow), respectively. (b) Model and hypothesis. Multi‐protective salutogenic trait associated with co‐preservation of optimal IR and higher levels of transcription factor 7 (TCF7 high ; expression level > median value) levels during inflammatory stress. (c) Gene expression signatures tracking the pathogenic triad (termed readouts) associated with lifespan in panel d. (d) Association of the readouts, transcriptomic metrics of IR [Survival‐associated signature (SAS)‐1; Mortality‐associated signature (MAS)‐1], and transcription factors (TF) with lifespan in the Framingham Heart Study (FHS). Age‐ and sex‐adjusted hazard ratios of all‐cause mortality by Cox proportional hazards models. False discovery rates (FDR) by Benjamini‐Hochberg method. {+}, less immune aging (positive salutogenesis); {−}, increased inflammaging or senescent load (negative salutogenesis). *, Higher levels of the IMM‐AGE signature were computed to signify an association with fewer senescent T‐cells (less immune aging and lower mortality; a {+}‐salutogenesis readout), as detailed in Section 4.2 of the Supporting Information. (e) Triad burden scoring. (f) Overlaps of genes in (top) {+}‐salutogenesis readouts and SAS‐1 and (bottom) {−}‐salutogenesis readouts and MAS‐1. Right, attributes of the t‐TCHhigh signature. pSTAT5, phosphorylated STAT5; IL‐7, interleukin 7; PD‐1, programmed cell death protein 1. (g) Correlation and clustering of signatures, TFs, and age in the FHS. Color gradient, Pearson's correlation coefficient (r). The cluster marked as longer lifespan contained gene signatures linked to immunocompetence, and the cluster marked as shorter lifespan contained gene signatures linked to inflammation. Specifically, the green‐colored vs. red‐colored gene signatures associated with longer vs. shorter lifespan respectively, as shown in panel 1d. ** indicates chronological age.
FIGURE 2
FIGURE 2
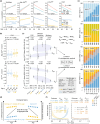
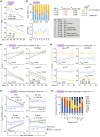
Immune resilience (IR) metrics and associations. (a) Expression of gene signatures and transcription factor genes noted in Figure 1d in single‐cell RNA‐seq‐defined peripheral blood cell populations. MAS‐1, Mortality‐associated signature‐1; SAS‐1, Survival‐associated signature‐1; TCF7, transcription factor 7. (b) Top, distribution of combined SAS‐1 and MAS‐1 expression (median‐based strata: H, high [expression levels > median value]; L, low [expression levels ≤ median value]) in cohorts. Bottom, TCF7 normalized gene expression [NGE, median (IQR)]. Cohorts (accession numbers): Framingham Heart Study (FHS) (phs000007.v30.p11 and phs000363.v17.p11); Down syndrome (Syn.) (GSE183071); common variable immunodeficiency (CVID) (GSE51405); systemic lupus erythematosus (SLE) (GSE65391) by sextiles of lymphocyte (lymph.) levels; HIV, latent tuberculosis infection (LTBI), TB with positive (+) or negative (−) culture (Cul) status (GSE39941); and metabolic syndrome (Met. Syn.) (GSE145412). p, by χ2 and Fisher's exact tests. Ctrl, controls. (c) Cohorts: SAIL, San Antonio Immunologic Resilience Longitudinal. NYU, New York University. VA‐CLC, Veterans Affairs COVID‐19 Longitudinal Cohort. (d–g) Cohort: FHS. (d) Sex‐adjusted hazard ratios (aHR) of mortality by SAS‐1/MAS‐1 profiles and age strata. (e) Sex‐adjusted (adj.) mortality hazards. Shaded areas, 95% confidence bands. The dotted lines indicate that the sex‐adjusted mortality hazards of a 40‐year‐old individual with SAS‐1low‐MAS‐1high and a 55‐year‐old person with SAS‐1high‐MAS‐1low are similar. (f) Time to death in groups defined by SAS‐1/MAS‐1 profiles and age. p, by log‐rank test. Grp, group. (g) Sex‐adjusted HRs of mortality with a 95% confidence interval (CI) in groups defined by SAS‐1/MAS‐1 profiles and age. p in panels d, e, and g by Cox proportional hazards models.
FIGURE 3
FIGURE 3
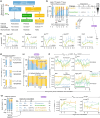
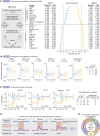
Associations of the transcriptomic metrics of immune resilience (IR), {+} and {−} salutogenesis readouts of the pathogenic triad (readouts), and TCF7 (transcription factor 7). Panels a, b, e, and f from the Framingham Heart Study (FHS). (a) Linear regression modeling of the levels of the readouts (z‐scores) noted in Figure 1c and TCF7 [normalized gene expression (NGE)] with 95% confidence bands across age by (top) sex and (bottom) profiles of the combination of the Survival‐associated signature‐1 (SAS‐1) and Mortality‐associated signature‐1 (MAS‐1) expression levels (median‐based strata: H, high; L, low; H‐L, SAS‐1high‐MAS‐1low; L‐H, SAS‐1low‐MAS‐1high). Grp, group. (b) Median (IQR) expression of indicated readouts. p, by linear model with likelihood ratio test (LRT). (c) Mean difference (diff., β values) with 95% confidence interval (CI) of readouts by age [older (O) vs. younger (Y)] and IR status (SAS‐1low‐MAS‐1high vs. SAS‐1high‐MAS‐1low tracking extreme IR degrader vs. optimal IR status, respectively) in the (left) FHS, (middle) Mexican Americans (E‐TABM‐305; Mex. Amer.), and (right) Brisbane (GSE53195) cohorts computed by linear models. p, by LRT. Median age is for persons in O vs. Y groups with the following cohort‐wise age cut‐offs: FHS: ≥ 76 versus < 56; Mexican Americans: ≥ 50 versus < 25; Brisbane: ≥ 40 versus < 20. (d) Ecological fallacy schema. (e) Distribution of SAS‐1 and MAS‐1 expression strata and SAS‐1/MAS‐1 profiles by octiles of TCF7 (NGE) and age groups. p, by χ 2 test. (f) Odds of the SAS‐1/MAS‐1 profiles (H‐L, SAS‐1high‐MAS‐1low; L‐H, SAS‐1low‐MAS‐1high; H‐H, SAS‐1high‐MAS‐1high; L‐L, SAS‐1low‐MAS‐1low) among younger and older persons by TCF7 (NGE). Shaded regions, 95% confidence bands. p, by logistic regression.
FIGURE 4
FIGURE 4
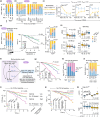
Immune resilience (IR) responses during inflammatory stress. (a) Persons with an optimal IR metric [Survival‐associated signature‐1 (SAS‐1)high‐Mortality‐associated signature‐1 (MAS‐1)low] and higher levels of transcription factor 7 (TCF7) are categorized as IR‐preservers, IR‐reconstituters, and IR‐degraders during inflammatory stress. (b, c) Case study 1: Viral infection during influenza season (GSE68310). (b) Left, Distribution of the SAS‐1/MAS‐1 profiles at the timepoints (T) pre‐, during, and post‐influenza season among those with SAS‐1high‐MAS‐1low (H‐L) profile pre‐infection (T0). ARI, acute respiratory infection. Profiles by combinations of SAS‐1 and MAS‐1 expression levels [median‐based strata: H, high; L, low]. Right, IR groups (Grp) based on SAS‐1/MAS‐1 profiles at T0, T1, and T6. (c) Trajectories (mean ± SE) of the gene signatures tracking the pathogenic triad (readouts in Figure 1c) and normalized gene expression (NGE) of TCF7 by IR groups in panel b. p, by ANOVA at T6. (d–f) Case study 2: Influenza challenge cohort (GSE52428). (d, e) SAS‐1/MAS‐1 profiles (d) pre‐ and post‐virus inoculation and by symptom status [post‐inoculation profiles pooled into a single stacked barplot] and (e) at post‐inoculation timepoints in symptomatic persons with H‐L and L‐H pre‐inoculation. p, by Fisher's exact test. H‐L: SAS‐1high‐MAS‐1low; L‐H: SAS‐1low‐MAS‐1high. (f) Trajectories (mean ± SE) of TCF7 NGE and indicated gene signatures. Asymp, asymptomatic; Symp, symptomatic. ISG, interferon‐stimulated genes. p, by linear generalized estimating equations with ANOVA. (g) Case study 3: Influenza vaccine cohort (SDY67). Left, SAS‐1/MAS‐1 profiles at days 0, 3, and 28 among those with H‐L (SAS‐1high‐MAS‐1low) pre‐vaccination. p, by Fisher's exact test. Middle, IR groups (Grp) based on SAS‐1/MAS‐1 profiles at days 0, 3, and 28 since vaccination. Right, trajectories (mean ± SE) of the readouts in IR groups. p, by Welch's t‐test comparing groups 1 and 2 versus 3 and 4 at day 28.
FIGURE 5
FIGURE 5
Transcriptomic metrics of immune resilience (IR): Associations in varied inflammatory contexts. (a) Case study 4 (GSE188427): Respiratory syncytial virus (RSV) infection cohort. Survival‐associated signature‐1 (SAS‐1)/Mortality‐associated signature‐1 (MAS‐1) profiles (key next to panel e) in controls (Ctrl) and RSV patients (days 1, 30, and 180). p, by χ 2 test. (b, c) Case study 5 (GSE59867): ST‐elevation myocardial infarction (STEMI) cohort. (b) SAS‐1/MAS‐1 profiles (H‐L: SAS‐1high‐MAS‐1low; L‐H: SAS‐1low‐MAS‐1high; median‐based strata: H, high; L, low) in STEMI patients at admission (Adm), discharge (DC), and post‐discharge (left) overall and (right) by subsequent heart failure (HF) status. p, by χ 2 test. Ext. IR‐degrad., extreme IR‐degraders. (c) Trajectories (mean ± SE) of the readouts (noted in Figure 1c) and normalized gene expression (NGE) of transcription factor 7 (TCF7). p, by linear generalized estimating equations. (d, e) Case study 6 (GSE65218): Vitality 90+ study. (d) Left and middle: Distribution of SAS‐1/MAS‐1 profiles and time to death by circulating cell‐free DNA (cfDNA) quartiles (increasing stress). Right, distribution of SAS‐1/MAS‐1 profiles by TCF7 tertiles. p, by χ2, log‐rank, and Fisher's exact tests. (e) Median (IQR) levels of cfDNA and readouts by SAS‐1/MAS‐1 profiles. p, by Kruskal‐Wallis for cfDNA and ANOVA for z‐scores. (f–l) Case 7: Cardiovascular diseases (CVD) and mortality in the Framingham Heart Study. (f) Multi‐protection model. (g) Time to death by CVD and inflammaging proxy (Age_IL6up signature; median‐based strata: H, high; L, low). (h) Age_IL6up strata by age and SAS‐1/MAS‐1 profiles (H‐L: SAS‐1high‐MAS‐1low; L‐H: SAS‐1low‐MAS‐1high). p, by χ2 test. (i) Time to CVD diagnosis and (j) time to death among people without CVD diagnosis at baseline by SAS‐1/MAS‐1 profiles and Age_IL6up strata. Grp, group. p in panels g, i and j, by Cox proportional hazards models adjusted for age, sex, smoking status, diabetes, hypertension, and total cholesterol with likelihood ratio test (LRT). (k) Median (IQR) levels of (top) Age_IL6up signature (z‐scores) and (bottom) TCF7 (NGE) by groups in panel j. p, by ANOVA for z‐score and Kruskal‐Wallis for TCF7. (l) Distribution of SAS‐1/MAS‐1 profiles by indicated outcomes (+, present; −, absent). p, by χ 2 test.
FIGURE 6
FIGURE 6
Immune resilience (IR) status and outcomes during acute COVID‐19 (ac‐COVID‐19). Panels b to h and j from the Veterans Affairs COVID‐19 Longitudinal Cohort (VA‐CLC; case study 8). (a) Parallels between associations of IR metrics in the (left) Framingham Heart Study (FHS; IR metrics: Survival‐associated signature‐1 (SAS‐1)/Mortality‐associated signature‐1 (MAS‐1) profiles) and (right) the VA‐CLC [IR metrics: Immune health grades (IHGs; see panel b) and SAS‐1/MAS‐1 profiles]. ***p < 0.001 (χ 2 test): IHGs in controls without (−) acute COVID‐19 [San Antonio Immunologic Resilience Longitudinal (SAIL) cohort] vs. with (+) acute COVID‐19 (at baseline). H‐L: SAS‐1high‐MAS‐1low; L‐H: SAS‐1low‐MAS‐1high (median‐based strata: H, high; L, low). (b) Derivation of IHG subgrades based on the balance between levels of CD8+ and CD4+ T‐cell counts. (H, high; L, low). (c) IHG distributions in study groups. (d) Baseline IHG by outcomes and sex in VA‐CLC. NH, nonhospitalized; HS, hospitalized survivors; NS, nonsurvivors. Dashed line, %IHG‐I. ***p < 0.001 (Fisher's exact test); ns, non‐significant. (e) Percent of non‐IHG‐I grades (with 95% confidence bands) by sex in controls (SAIL, SardiNIA, and UCSD HIV‐seronegative cohorts combined) and acute COVID‐19 at baseline (VA‐CLC) across age. p, by logistic regression adjusting for age and sex. (f) Time to achieve IHG‐I within 30 days of presentation by baseline IHG. p, by age‐adjusted Cox proportional hazards model. (g–i) SAS‐1/MAS‐1 profiles by (g) baseline IHGs, (h) outcomes, and (i) survivors (S) versus NS [New York University (NYU) cohort]. p, by Fisher's exact test. (j) (Left) Line plots: Probability (with 95% confidence bands) by logistic regression of being hospitalized across age by baseline IHGs. p, by likelihood ratio test. (Right) Age‐adjusted odds ratio (aOR) and significance values from the logistic regression model.
FIGURE 7
FIGURE 7
Immune resilience (IR) status and health profiles before, during, and following COVID‐19 in the Veterans Affairs COVID‐19 Longitudinal Cohort (VA‐CLC) (case study 8). (a) Left, acute and post‐acute mortality windows. Right, sex‐adjusted hazard ratios (aHR) with 95% confidence interval (CI) of acute and post‐acute mortality by baseline immune health grades (IHG) within indicated age strata. p, by Cox proportional hazards models. (b) Age‐adjusted odds (with 95% CI) and hazard ratios (with 95% CI) of outcomes by baseline IHG (Rest, grades other than IHGs I, IIa, IIc, and IVc). ARDS, acute respiratory distress syndrome; nAb, neutralizing antibody (absent, < 30% inhibition in surrogate virus neutralization test); 2+, ≥ 2 pre‐existing comorbidities. p, by logistic regression and Cox proportional hazards models adjusted for age. (c) Median (IQR) levels of the readouts (z‐scores) noted in Figure 1c and normalized gene expression (NGE) of TCF7 (transcription factor 7). Rest, IHGs other than IHG‐I. p, by likelihood ratio test. (d) Linear regression modeling of log2 levels (with 95% confidence bands) of biomarkers across age by baseline IHG. IL‐6, interleukin 6; CRP, C‐reactive protein; NK, natural killer. p, by likelihood ratio test adjusted for age. (e) Age‐adjusted means (with 95% CI) of baseline log2‐transformed CRP levels stratified by preexisting comorbidity (Comorb.) burden and baseline IHG. p, by linear model adjusting for age. (f) Left, Pearson's correlation coefficient (r) of biomarkers, immune traits, and cytokines with TCF7 (NGE) expression. Right, health profiles of IR‐preservers before, during, and following acute COVID‐19. Upper right, transcription factors co‐enriched with optimal IR status (SAS‐1high/MAS‐1low) in the Framingham Heart Study. cDC, conventional dendritic cells; EM, effector memory; HLA, human leukocyte antigen; IgA, immunoglobulin A; MAS‐1, mortality‐associated signature‐1; MZ, marginal zone; MAIT, mucosal‐associated invariant T‐cells; SAS‐1, survival‐associated signature‐1; TNFα, tumor necrosis factor α; *Higher levels of the IMM‐AGE signature were computed to signify an association with fewer senescent T‐cells (less immune aging and lower mortality; a {+}‐salutogenesis readout), as detailed in Section 4.2 of the Supporting Information. ns, non‐significant; *p < 0.05; **p < 0.01; ***p < 0.001.
FIGURE 8
FIGURE 8
Association of immune resilience (IR) metrics with cortical gray matter thickness (CGMT), Alzheimer's disease (AD), and IR metrics monitoring in COVID‐19. (a) Case study 9a. Cohort: Framingham Heart Study. Linear regression modeling of levels (NGE, normalized gene expression with 95% confidence bands) of a transcriptomic correlate (LRNN3) of CGMT stratified by (top) sex and (bottom) IR status defined by Survival‐associated signature‐1 (SAS‐1) and Mortality‐associated signature‐1 (MAS‐1) profiles. H‐L: SAS‐1high‐MAS‐1low (median‐based strata: H, high; L, low); L‐H: SAS‐1low‐MAS‐1high; Grp, group. (b–d) Case study 9b: AD and controls (GSE140829). (b) SAS‐1/MAS‐1 profiles and TCF7 (transcription factor 7) normalized gene expression [NGE, median (IQR)] in controls and persons with AD or mild cognitive impairment. Ext. IR‐degrad., extreme IR‐degraders. p, by χ 2 and Fisher's exact test between study groups in age strata. (c‐d) Linear regression modeling of levels (with 95% confidence bands) of readouts (z‐scores) noted in Figure 1c in (c) controls and persons with AD, and (d) AD patients with H‐L (SAS‐1high‐MAS‐1low) and L‐H (SAS‐1low‐MAS‐1high) profiles. (e, f) Case study 10a: Veterans Affairs COVID‐19 Longitudinal Cohort (VA‐CLC). (e) Biomarker trajectories during 14 days from baseline in patients who remained IR‐preservers (IHG‐I) vs. extreme IR‐degraders (IHG‐IIc/IVc) who improved their IHG status. Two n‐values per group presented in panel e correspond to number of biomarker measurements and number of unique persons, respectively. p, by linear GEE with interaction term and generalized linear hypothesis tests at Day 0 and Day 14. (f) Distribution of IHG during convalescence (Conv.) by baseline IHG. ns, non‐significant; *, p < 0.05; **, p < 0.01; ***, p < 0.001.
FIGURE 9
FIGURE 9
Association of immune resilience (IR) metrics with proteomic biomarkers and biologics. (a, b) Case study 10b: Monogenic immunodeficiencies (MID) multi‐omics cohort (phs002732.v1.p1). (a) Left, Summary schema of proteomic biomarkers analysis findings. Right, Linear slopes (β) of levels of indicated plasma proteomic biomarkers with survival‐associated signature‐1 (SAS‐1) and mortality‐associated signature‐1 (MAS‐1) gene expression signatures. Analysis performed using linear regression adjusting for age and sex. FDR by Benjamini‐Hochberg. (b) Median (IQR) levels of indicated proteomic biomarkers by SAS‐1/MAS‐1 profiles (median‐based strata: H, high; L, low). p, by ANOVA. (c) Case study 11 (GSE191328): Inflammatory bowel disease treated with anti‐inflammatory biologics. Trajectories (mean ± SE) of the levels of readouts (z‐scores) noted in Figure 1c and TCF7 normalized gene expression (NGE) by SAS‐1/MAS‐1 profiles. B, baseline; d, day; w, week. p, by linear generalized estimating equations. (d) Model of robustness, plasticity, and maladaptation to inflammatory stress and residual burden of the pathogenic triad. (e) Genes whose expression in T‐cells is conserved across species.

References

    1. Abdellatif, M. , Rainer P. P., Sedej S., and Kroemer G.. 2023. “Hallmarks of Cardiovascular Ageing.” Nature Reviews. Cardiology 20, no. 11: 754–777. 10.1038/s41569-023-00881-3. - DOI - PubMed
    1. Ahuja, S. K. , Manoharan M. S., Lee G. C., et al. 2023. “Immune Resilience Despite Inflammatory Stress Promotes Longevity and Favorable Health Outcomes Including Resistance to Infection.” Nature Communications 14, no. 1: 3286. 10.1038/s41467-023-38238-6. - DOI - PMC - PubMed
    1. Alpert, A. , Pickman Y., Leipold M., et al. 2019. “A Clinically Meaningful Metric of Immune Age Derived From High‐Dimensional Longitudinal Monitoring.” Nature Medicine 25, no. 3: 487–495. 10.1038/s41591-019-0381-y. - DOI - PMC - PubMed
    1. Arunachalam, P. S. , Scott M. K. D., Hagan T., et al. 2021. “Systems Vaccinology of the BNT162b2 mRNA Vaccine in Humans.” Nature 596, no. 7872: 410–416. 10.1038/s41586-021-03791-x. - DOI - PMC - PubMed
    1. Azambuja, M. I. 2004. “Spanish Flu and Early 20th‐Century Expansion of a Coronary Heart Disease‐Prone Subpopulation.” Texas Heart Institute Journal 31, no. 1: 14–21. https://www.ncbi.nlm.nih.gov/pubmed/15061621. - PMC - PubMed

LinkOut - more resources