. 2025 Apr 8:16:1532306.
doi: 10.3389/fimmu.2025.1532306. eCollection 2025.

Cancer-associated fibroblasts gene signature: a novel approach to survival prediction and immunotherapy guidance in colon cancer

Affiliations

Cancer-associated fibroblasts gene signature: a novel approach to survival prediction and immunotherapy guidance in colon cancer

Wenbing Zhang et al. Front Immunol. .

Abstract

Background: Fibroblasts can regulate tumour development by secreting various factors. For COAD survival prediction and CAFs-based treatment recommendations, it is critical to comprehend the heterogeneity of CAFs and find biomarkers.

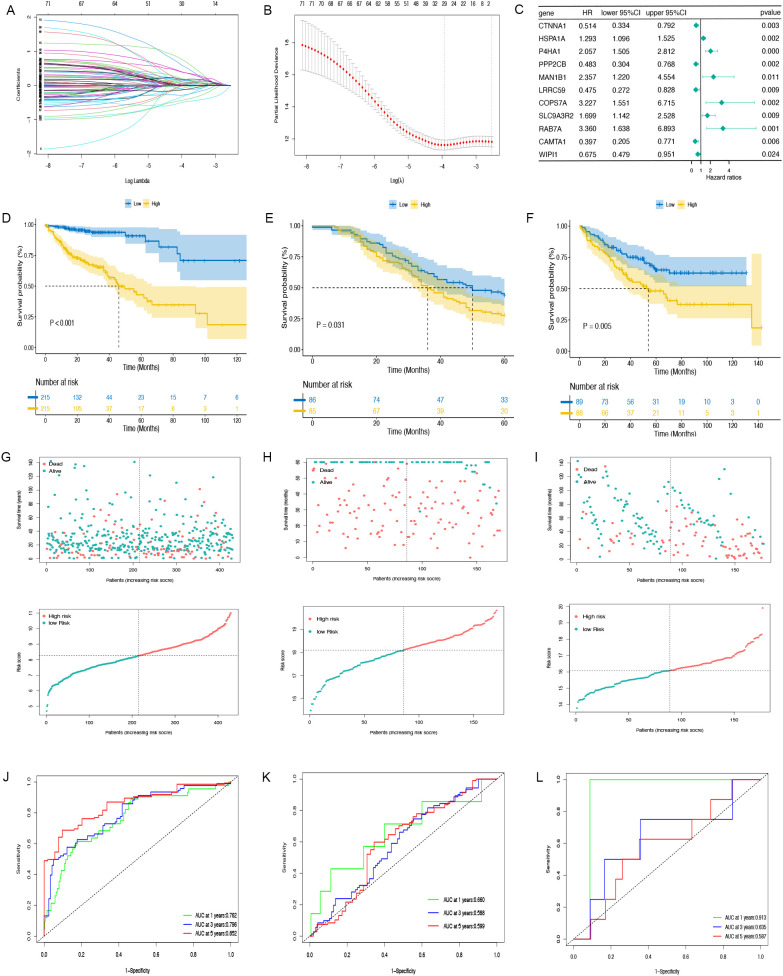
Methods: We identified fibroblast-associated specific marker genes in colon adenocarcinoma by single-cell sequencing analysis. A fibroblasts-related gene signature was developed, and colon adenocarcinoma patients were classified into high-risk and low-risk cohorts based on the median risk score. Additionally, the impact of these risk categories on the tumor microenvironment was evaluated. The ability of CAFGs signature to assess prognosis and guide treatment was validated using external cohorts. Ultimately, we verified MAN1B1 expression and function through in vitro assays.

Results: Relying on the bulk RNA-seq and scRNA-seq data study, we created a predictive profile with 11 CAFGs. The profile effectively differentiated survival differences among cohorts of colon adenocarcinoma patients. The nomogram further effectively predicted the prognosis of COAD patients, with low-risk patients having a better prognosis. A higher immune infiltration rate and lower IC50 values of anticancer drugs were significant in the high-risk group. In cellular experiments, Following MAN1B1 knockdown, in cell assays, the colony formation, migration, and invasion ability of HCT116 and HT29 cell lines decreased.

Conclusion: Our CAFG signature provides important insights into the role of CAF cells in influencing COAD prognosis. It may also serve as a guide for selecting immunotherapy options and predicting chemotherapy responses in COAD patients.

Keywords: MAN1B1; cancer-associated fibroblasts; colon adenocarcinoma; signature; tumor immune microenvironment.


Conflict of interest statement

The authors declare that the research was conducted in the absence of any commercial or financial relationships that could be construed as a potential conflict of interest.

Figures

Figure 1
Figure 1
scRNA-seq analysis to identify fibroblasts marker genes. (A) The top 2000 highly variable genes are highlighted in red dots. (B) PCA was used to decrease dimensionality. (C) The top 20 PCs were identified with the P-value < 0.05. (D) The heatmap indicated the relative gene expression of 15 clusters. Genes with high expression are depicted in yellow, whereas genes with low expression are highlighted in purple. (E) Fifteen clusters were visualized using the UMAP technique. (F) Cell subpopulations identified by marker genes. Different color areas represent different cells.
Figure 2
Figure 2
Analysis of functional enrichment. (A) Function enrichment analysis based on BP, CC, and MF, three different viewpoints. (B) The top 20 pathways of KEGG analysis. The darker the color, the smaller the P value, and the larger the shape, the larger the number.
Figure 3
Figure 3
The prognostic model is constructed and validated. (A, B) LASSO regression analysis. (C) Multivariate Cox regression results are plotted in a forest. (D–F) The Kaplan-Meier curves in TCGA-COAD, GSE159216 and GSE17536 cohorts. (G–I) Distribution of CAFGs risk score and scatter plot of the OS of each patient in TCGA-COAD, GSE159216 and GSE17536 cohorts, respectively. (J–L) The AUC at 1-, 3-, and 5-years of prognostic models in TCGA-COAD, GSE159216 and GSE17536 cohorts.
Figure 4
Figure 4
Nomogram construction and evaluation. The correlations between OS and CAFGs risk scores and other clinical indicators in TCGA-COAD populations were examined using univariate (A) and multivariate (B) Cox regression analyses. (C) The nomogram was applied to predict the 1-, 3-, and 5-year OS and the total score on the bottom scale implies the probability of OS. (D) ROC curves to evaluate the age, M stage and CAFGs risk group accuracy for predicting in patients. (E) ROC curves to evaluate the nomogram accuracy for predicting 1-, 3-, and 5-year OS in patients. (F) Calibration curves of the nomogram for predicting survival rates at 1-, 3-, and 5- years.
Figure 5
Figure 5
Immune infiltration analysis. (A-D) Different expression levels of stroma score, estimate score, immune score and tumour purity between the low- and high-risk groups. (E) The MCPcounter algorithm estimated the expression levels of ten different cell types, including fibroblasts. (F) The association of CAFGs risk score with 28 tumor-infiltrating immune cells. (G) Differential expression levels of the immune checkpoint-related genes between low- and high-risk groups. (ns, no significance, *P < 0.05, **P < 0.01, ***P < 0.001).
Figure 6
Figure 6
Somatic mutation in TCGA-COAD. (A) The general mutation profile. Different colors indicate different mutations. (B) Interaction relationship of major mutation genes. (C) The high-risk group’s gene mutation frequency. (D) The low-risk group’s gene mutation frequency. (E) Variations in TMB expression levels between groups. (F) The Kaplan-Meier curve between low- and high-TMB groups. (G) Kaplan-Meier analysis curves for patients categorized by TMB and CAFGs risk group.
Figure 7
Figure 7
Drug sensitivity assessment. In the TCGA-COAD (A-E), GSE17536 (F-J) and GSE159216 (K-O) cohorts, the IC50 values of Gemcitabine (A, F, K), Gefitinib (B, G, L), Docetaxel (C, H, M), Camptothecin (D, I, N), and Sorafenib (E, J, O) were compared between low-risk and high-risk groups. (*P < 0.05, **P < 0.01, ***P < 0.001, ****P < 0.0001).
Figure 8
Figure 8
The impact of MAN1B1 in HCT116 and HT29. (A) The mRNA expression level of MAN1B1 in pan malignancies. (B) Following MAN1B1 knockdown, qRT-PCR showed a reduction in MAN1B1 expression. (C, D) As demonstrated by the cell colony formation experiment, cell proliferation was suppressed. (E-I) The capacity for invasion and migration dramatically reduced following the MAN1B1 knockdown. (**P < 0.01, ***P < 0.001).

References

    1. Li J, Ma X, Chakravarti D, Shalapour S, DePinho RA. Genetic and biological hallmarks of colorectal cancer. Genes Dev. (2021) 35:787–820. doi: 10.1101/gad.348226.120 - DOI - PMC - PubMed
    1. Wang M, Zhao J, Zhang L, Wei F, Lian Y, Wu Y, et al. . Role of tumor microenvironment in tumorigenesis. J Cancer. (2017) 8:761–73. doi: 10.7150/jca.17648 - DOI - PMC - PubMed
    1. Chen K, Collins G, Wang H, Toh JWT. Pathological features and prognostication in colorectal cancer. Curr Oncol. (2021) 28:5356–83. doi: 10.3390/curroncol28060447 - DOI - PMC - PubMed
    1. Luo H, Xia X, Huang LB, An H, Cao M, Kim GD, et al. . Pan-cancer single-cell analysis reveals the heterogeneity and plasticity of cancer-associated fibroblasts in the tumor microenvironment. Nat Commun. (2022) 13:6619. doi: 10.1038/s41467-022-34395-2 - DOI - PMC - PubMed
    1. Sewell-Loftin MK, Bayer SVH, Crist E, Hughes T, Joison SM, Longmore GD, et al. . Cancer-associated fibroblasts support vascular growth through mechanical force. Sci Rep. (2017) 7:12574. doi: 10.1038/s41598-017-13006-x - DOI - PMC - PubMed

MeSH terms

Substances

LinkOut - more resources