. 2025 Mar 25;28(4):112278.
doi: 10.1016/j.isci.2025.112278. eCollection 2025 Apr 18.

Efficient boosting of Omicron-reactive memory B cells after breakthrough infection protects from repeated exposure

Affiliations

Efficient boosting of Omicron-reactive memory B cells after breakthrough infection protects from repeated exposure

Qingfei Chu et al. iScience. .

Abstract

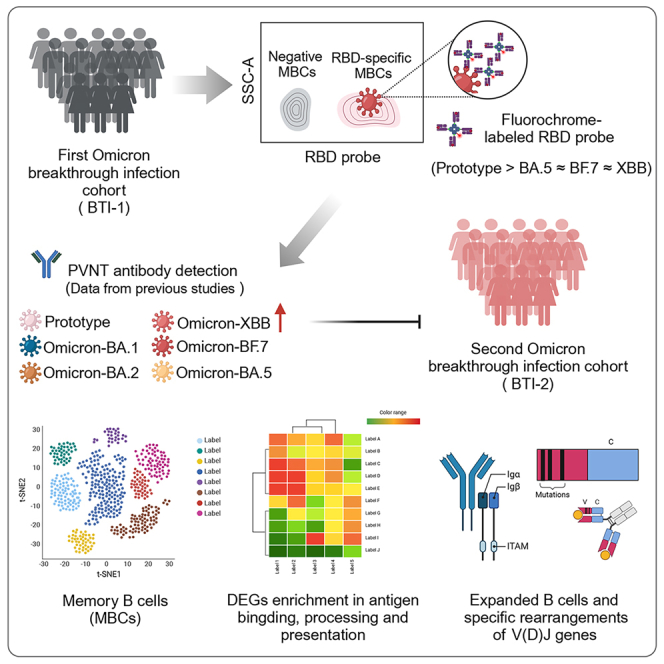
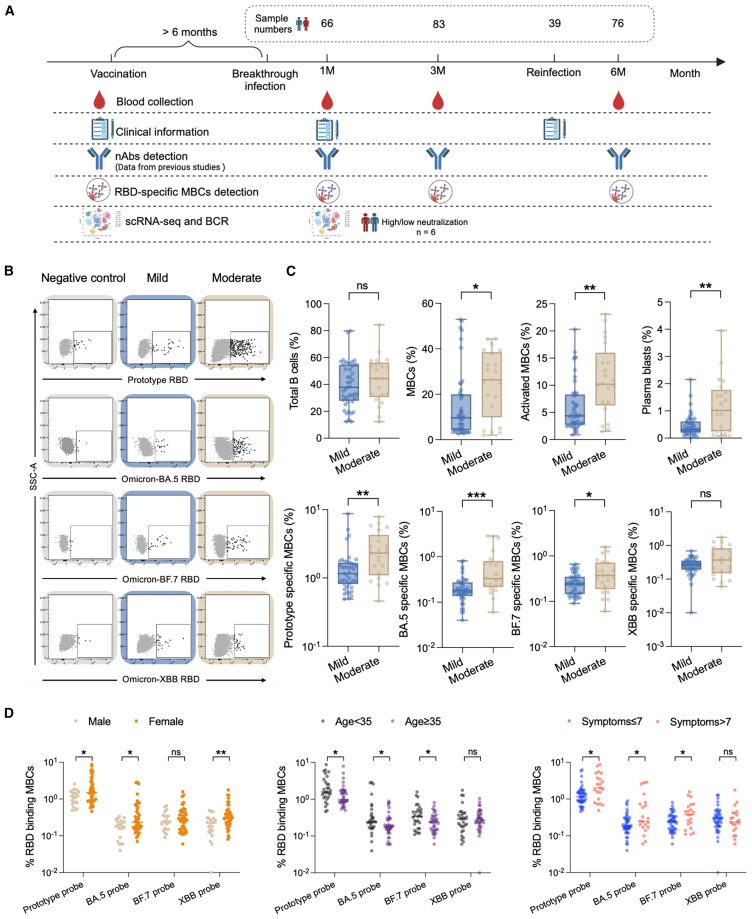
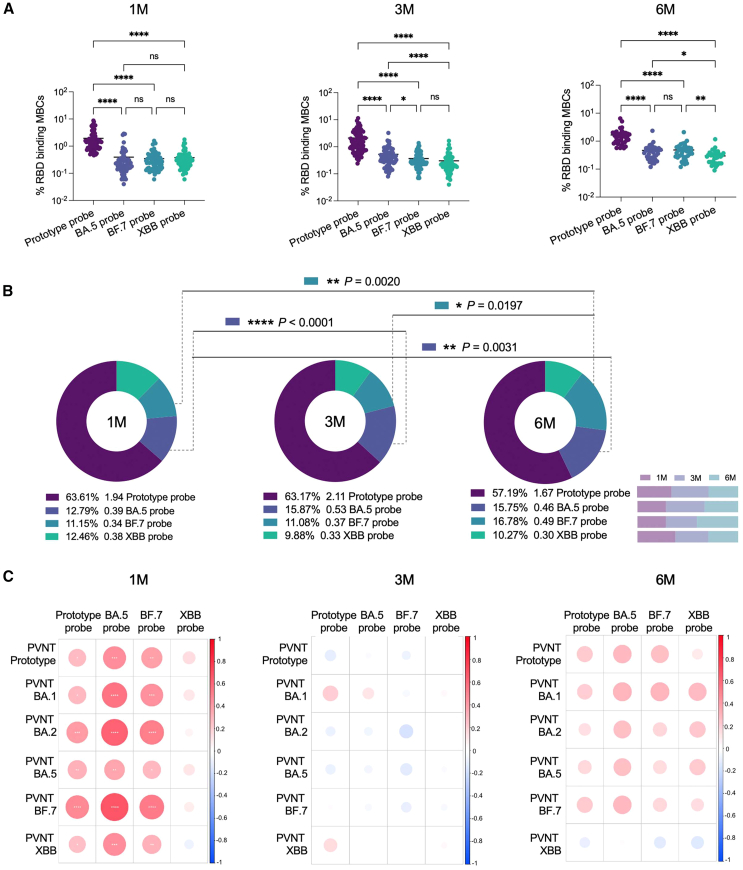
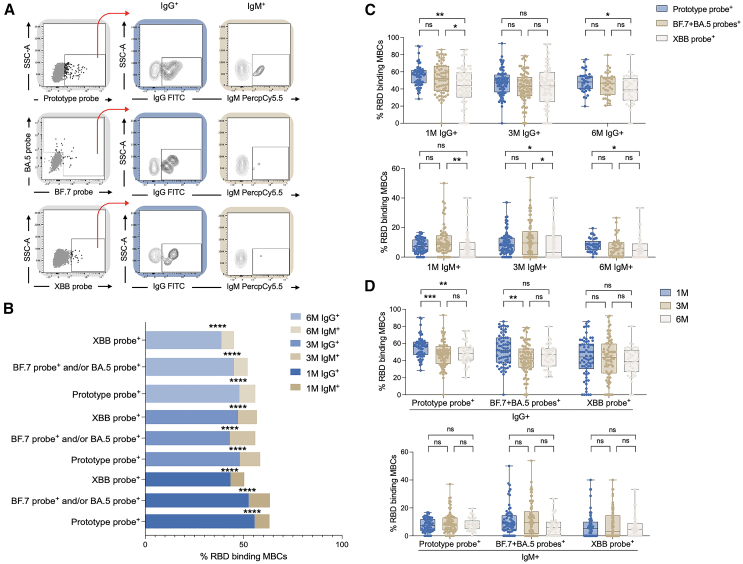
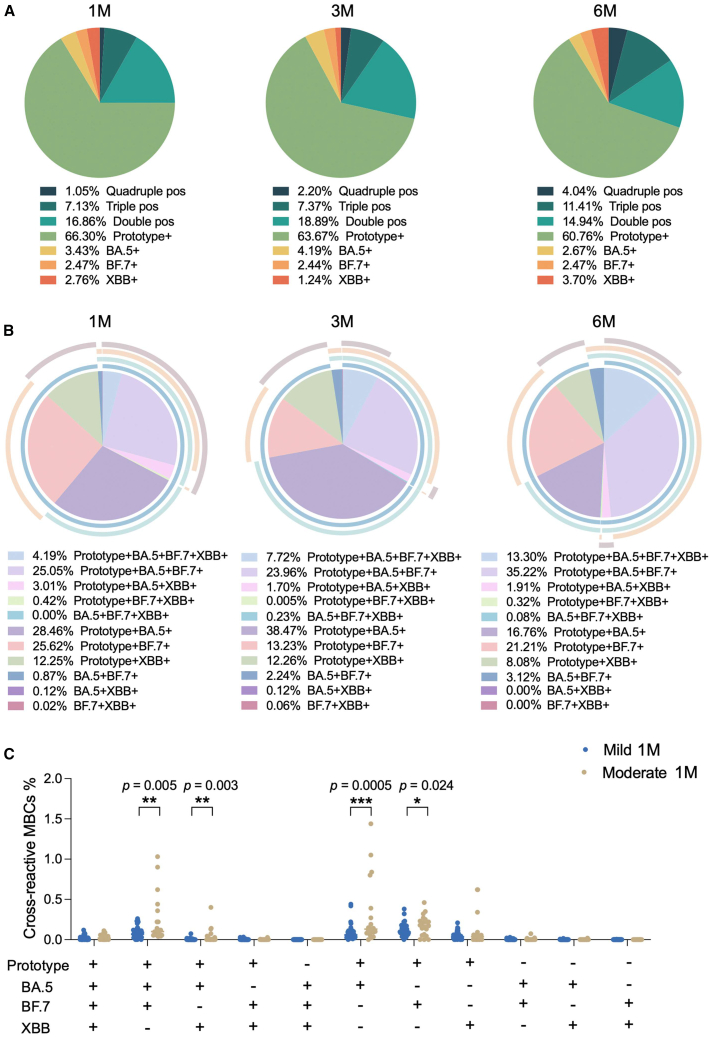
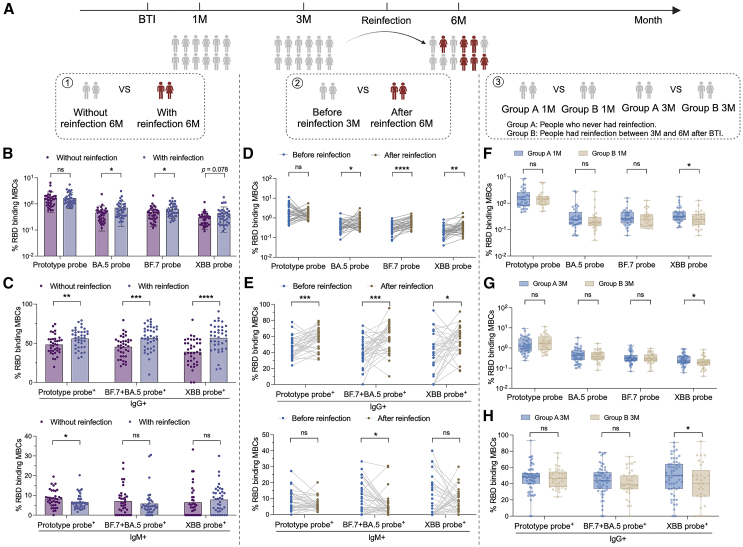
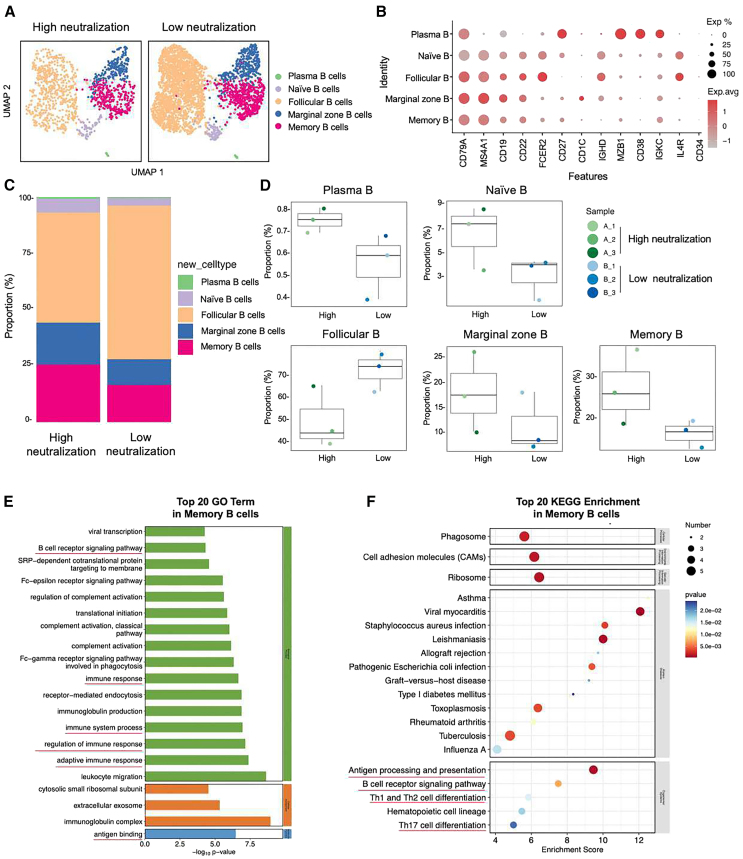
Exploring the impact of persistent mutations in SARS-CoV-2 variants and reduced immunity on breakthrough infections (BTIs) is crucial, particularly in understanding how antigen-specific memory B cells (MBCs) respond to new variants. We followed 107 participants who received the ancestral inactivated vaccine and experienced one or two Omicron BTIs over six months. Using flow cytometry, SARS-CoV-2 antigen probes, single-cell RNA sequencing, and B cell receptor (BCR) profiling, we assessed MBCs and immune diversity. Our findings revealed that although neutralizing antibody levels decreased over time, the number of specific MBCs remained stable and matured progressively. Notably, pre-existing Omicron-specific MBCs played a key role in preventing secondary Omicron infections. Differential gene analysis showed enrichment in antigen processing and immune regulation pathways, while clonal lineage analysis revealed more B cell expansion and V(D)J gene-specific rearrangements in high neutralization samples. These results emphasize MBCs' critical role in long-term immunity and inform future vaccination strategies.

Keywords: Cell biology; Immunology.


Conflict of interest statement

The authors declare no competing interests.

Figures

None
Graphical abstract
Figure 1
Figure 1
Moderate group have higher and broader SARS-CoV-2-specific MBCs responses (A) Flowchart of this study. (B) Schematic diagram of four RBD-specific MBCs (prototype RBD, Omicron-BA.5 RBD, BF.7 RBD, and XBB RBD) in the mild and moderate groups. Samples of healthy donors before the outbreak of COVID-19 were taken as negative control. They have neither been vaccinated with the COVID-19 vaccine nor been infected with SARS-CoV-2. (C) Comparison of total B, MBCs, activated MBCs (CD38+), plasma blasts (CD38hi), and four probe-specific MBCs in the mild and moderate groups at 1 month after BTI. Data are represented as median and interquartile range (IQR). (D) Comparison of the four probe-specific MBCs of different genders, ages and symptoms at 1 month after BTI. Data are represented as median. Comparisons between two groups were performed using the two-tailed non-parametric Mann-Whitney test. p < 0.05; ∗∗p < 0.01; ∗∗∗p < 0.001; ns, no significance.
Figure 2
Figure 2
Progressive maturation of BA.5 RBD+ and BF.7 RBD+ MBCs (A) Scatterplot of comparison of four specific MBCs at 1M, 3M, and 6M after BTI. Data are represented as median. (B) Pie chart of comparison of four specific MBCs at 1M, 3M, and 6M after BTI, and comparison of the changes of specific MBCs over time. The percentages below the pie charts represent the proportion of RBD-specific MBCs. The numbers next to them represent the average. The rightmost number is the probe type. Bar chart shows the changes of specific MBCs with time points. (C) Pearson correlation matrices heatmap of the four probe-specific MBCs at 1M, 3M, and 6M after BTI and the nAbs results obtained at the corresponding time points for prototype, BA.1, BA.2, BA.5, BF.7, and XBB. Statistically significant correlations are indicated with an asterisk (∗). Two-tailed, nonparametric Dunn’s Kruskal-Wallis test was used for multiple comparisons. p < 0.05; ∗∗p < 0.01; ∗∗∗p < 0.001; ∗∗∗∗p < 0.0001. ns, no significance. 1M, 1 month after Omicron BTI; 3M, 3 months after Omicron BTI; 6M, 6 months after Omicron BTI.
Figure 3
Figure 3
Homomorphic conversion of MBCs (A) Schematic diagram of IgG+ and IgM+ RBD-specific MBCs. (B) Comparison of various RBD-specific MBCs of IgG+ and IgM+ at 1M, 3M, and 6M after BTI. (C) Comparison of IgG+ and IgM+ in different RBD-specific MBCs. (D) Changes of IgG+ and IgM+ specific MBCs over time. Data are represented as median and interquartile range (IQR). Comparisons between two groups were performed using the two-tailed non-parametric Mann-Whitney test. Two-tailed, nonparametric Dunn’s Kruskal-Wallis test was used for multiple comparisons. p < 0.05; ∗∗p < 0.01; ∗∗∗p < 0.001; ∗∗∗∗p < 0.0001. ns, no significance.
Figure 4
Figure 4
Cross-reactive MBCs (A) Quadruple-positive, triple-positive, double-positive, and single-positive MBCs at 1M, 3M, and 6M after BTI. (B) Various combinations of cross-reactive MBCs at 1M, 3M, and 6M after BTI. (C) Comparison of cross-reactive MBCs in mild and moderate groups at 1M after BTI. Data are represented as median. Comparisons between two groups were performed using the two-tailed non-parametric Mann-Whitney test. p < 0.05; ∗∗p < 0.01; ∗∗∗p < 0.001.
Figure 5
Figure 5
The role of SARS-CoV-2-specific MBCs in secondary BTI (A) Three analysis logics for secondary BTI. First, at the follow-up time point after secondary BTI, the two groups of people with and without secondary infection were compared. Second, the secondary infection group was compared before and after infection. Third, the immune differences between the people with and without secondary infection were traced back to the previous 1M and 3M. (B) Comparison of specific MBCs between people with and without secondary infection. Data are represented as the mean ± SD. (C) Comparison of IgG+ and IgM+ specific MBCs between people with and without secondary infection. Data are represented as the mean ± SD. (D) Paired comparison of specific MBCs before and after secondary infection. (E) Paired comparison of IgG+ and IgM+ specific MBCs before and after secondary infection. (F) Comparison of specific MBCs between people with secondary infection at 1M and those without secondary infection. Data are represented as median and interquartile range (IQR). (G) Comparison of specific MBCs between people with secondary infection at 3M and those without secondary infection. Data are represented as median and IQR. (H) Comparison of IgG+ and IgM+ specific MBCs between people with secondary infection at 3M and those without secondary infection. Data are represented as median and IQR. Comparisons between two groups were performed using the two-tailed non-parametric Mann-Whitney test and paired parametric t test. p < 0.05; ∗∗p < 0.01; ∗∗∗p < 0.001; ∗∗∗∗p < 0.0001. ns, no significance.
Figure 6
Figure 6
Immune characteristics of SARS-CoV-2 BTI with different levels of nAbs revealed by scRNA-seq (A) UMAP representation of B cells derived from High neutralization (n = 3) and Low neutralization (n = 3). Each dot corresponds to a single cell, colored according to cell type. (B) Dot plot of average expression and percentage of expressed cells of selected canonical markers in each labeled B cell subtype. (C) Bar plot showing B cell compositions at the single sample level. Average proportion of each cell type derived from two groups. (D) Comparison results of five B cell subsets in the two groups. The percentage of each cell cluster is calculated as: (the number of specific cell cluster) ⁄ (the number of B cells). (E) Gene enrichment analyses of the differentially expressed genes (DEGs) in the GO in memory B cells. GO terms are labeled with name and sorted by −log10 (p value). The top 20 enriched GO terms are shown. Green represents DEGs enriched in biological process-related signaling pathways. Orange represents cellular component. Blue represents molecular function. (F) DEGs enrichment analyses in the KEGG in MBCs. The horizontal axis is the enrichment score. Entries with larger bubbles contain more differential protein-coding genes. The color of the bubble changes from blue-white-yellow-red. The smaller the enrichment p value, the greater the significance.

Similar articles

References

    1. Li Y., Qin S., Dong L., Qiao S., Wang X., Yu D., Gao P., Hou Y., Quan S., Li Y., et al. Long-term effects of Omicron BA.2 breakthrough infection on immunity-metabolism balance: a 6-month prospective study. Nat. Commun. 2024;15:2444. doi: 10.1038/s41467-024-46692-z. - DOI - PMC - PubMed
    1. Wang X., Jiang S., Jiang S., Li X., Ai J., Lin K., Lv S., Zhang S., Li M., Li J., et al. Neutralization of SARS-CoV-2 BQ.1.1, CH.1.1, and XBB.1.5 by breakthrough infection sera from previous and recent waves in China. Cell Discov. 2023;9:64. doi: 10.1038/s41421-023-00569-5. - DOI - PMC - PubMed
    1. Yan X., Zhao X., Du Y., Wang H., Liu L., Wang Q., Liu J., Wei S. Dynamics of anti-SARS-CoV-2 IgG antibody responses following breakthrough infection and the predicted protective efficacy: A longitudinal community-based population study in China. Int. J. Infect. Dis. 2024;145 doi: 10.1016/j.ijid.2024.107075. - DOI - PubMed
    1. Guo Y., Zhang G., Yang Q., Xie X., Lu Y., Cheng X., Wang H., Liang J., Tang J., Gao Y., et al. Discovery and characterization of potent pan-variant SARS-CoV-2 neutralizing antibodies from individuals with Omicron breakthrough infection. Nat. Commun. 2023;14:3537. doi: 10.1038/s41467-023-39267-x. - DOI - PMC - PubMed
    1. Jeffery-Smith A., Burton A.R., Lens S., Rees-Spear C., Davies J., Patel M., Gopal R., Muir L., Aiano F., Doores K.J., et al. SARS-CoV-2-specific memory B cells can persist in the elderly who have lost detectable neutralizing antibodies. J. Clin. Investig. 2022;132 doi: 10.1172/jci152042. - DOI - PMC - PubMed

LinkOut - more resources