. 2025 Mar 27;28(4):112295.
doi: 10.1016/j.isci.2025.112295. eCollection 2025 Apr 18.

Fate plasticity of interneuron specification

Affiliations

Fate plasticity of interneuron specification

Mohammed A Mostajo-Radji et al. iScience. .

Abstract

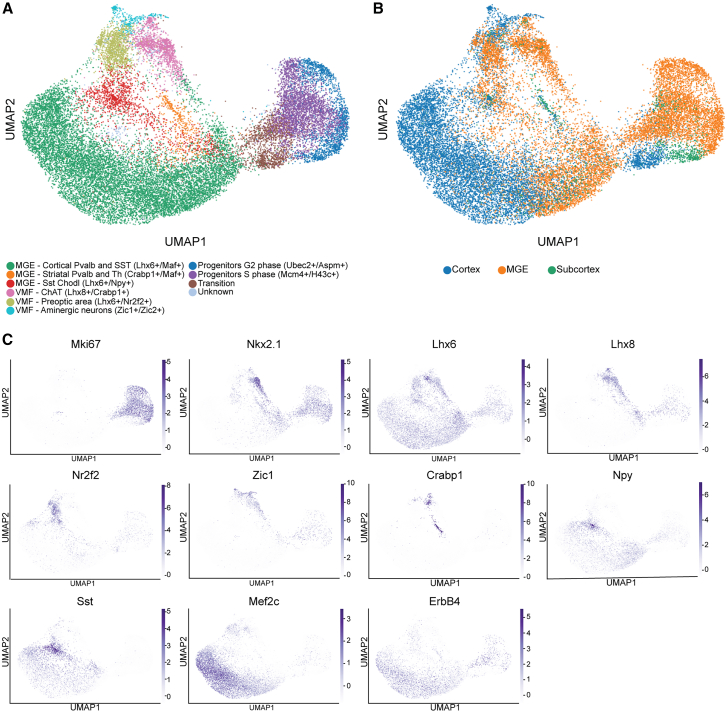
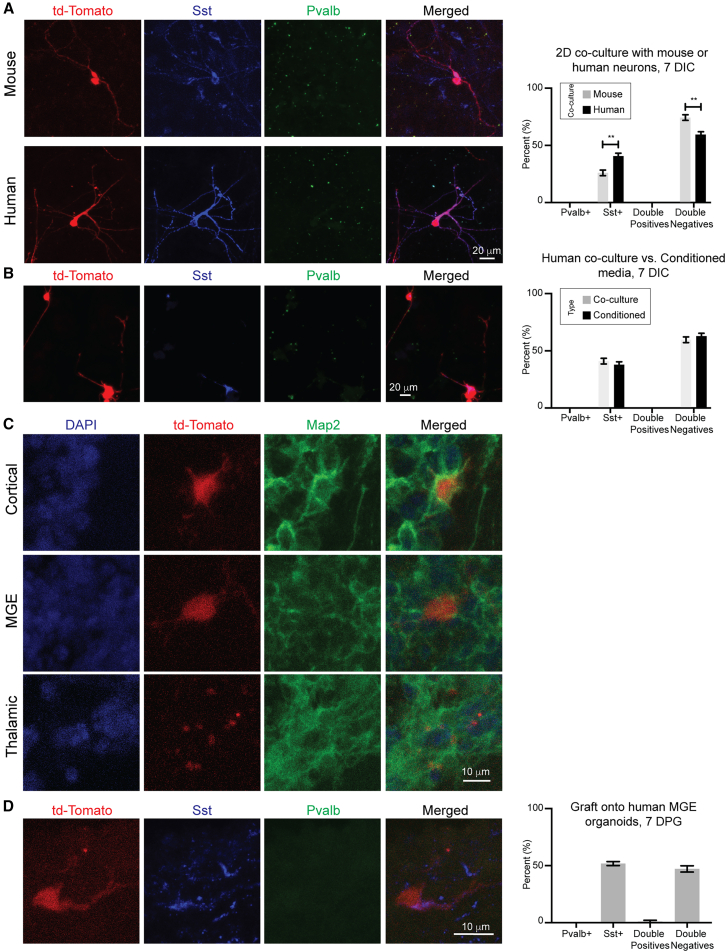
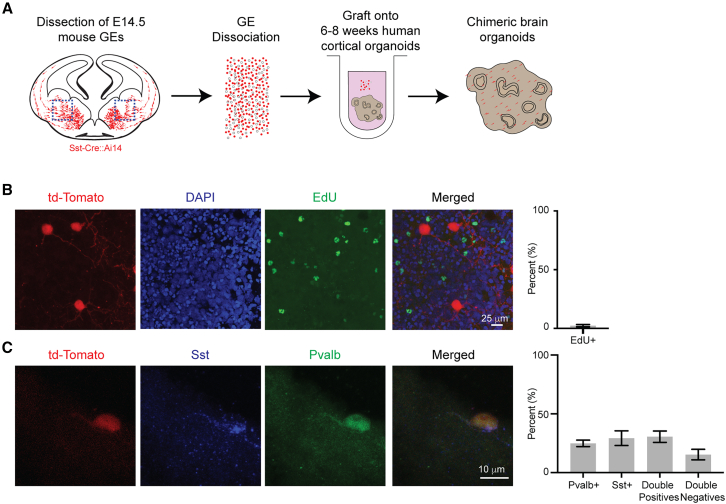
Neuronal subtype generation in the mammalian central nervous system is governed by competing genetic programs. The medial ganglionic eminence (MGE) produces two major cortical interneuron (IN) populations, somatostatin (Sst) and parvalbumin (Pvalb), which develop on different timelines. The extent to which external signals influence these identities remains unclear. Pvalb-positive INs are crucial for cortical circuit regulation but challenging to model in vitro. We grafted mouse MGE progenitors into diverse 2D and 3D co-culture systems, including mouse and human cortical, MGE, and thalamic models. Strikingly, only 3D human corticogenesis models promoted efficient, non-autonomous Pvalb differentiation, characterized by upregulation of Pvalb maturation markers, downregulation of Sst-specific markers, and the formation of perineuronal nets. Additionally, lineage-traced postmitotic Sst-positive INs upregulated Pvalb when grafted onto human cortical models. These findings reveal unexpected fate plasticity in MGE-derived INs, suggesting that their identities can be dynamically shaped by the environment.

Keywords: Biological sciences; Cellular neuroscience; Natural sciences; Neuroscience; Systems neuroscience.


Conflict of interest statement

M.A.M.-R. and A.A.P. are listed as inventors on a patent application concerning the in vitro generation of Pvalb-positive INs. Additionally, M.A.M.-R. and J.L. are inventors on a separate patent application related to machine learning models for neuron classification. L.Z. is an employee of Milecell Biotechnology. D.T. is an employee of Aperture Therapeutics. A.A.-B. and A.R.K. are co-founders and members of the scientific advisory board of Neurona Therapeutics. W.R.M.L. is an employee of Neurona Therapeutics. A.R. is a co-founder and the chief technology officer of Immergo Labs. M.T. is a member of the scientific advisory board of Immergo Labs. M.T. serves as an advisory board member of Open Culture Science, Inc. M.A.M.-R. is an advisor for Atoll Financial Group.

Figures

None
Graphical abstract
Figure 1
Figure 1
Early diversity of MGE and VMF-derived interneurons (A) Single-cell transcriptomic analysis identifies six distinct classes of postmitotic interneurons derived from the MGE and VMF, characterized by the expression of Gad1, Gad2, Dlx genes, Lhx6, and Nkx2.1. Cells are color-coded by cluster in a UMAP representation of the single-cell transcriptomes. (B) Classification of INs based on their region of origin. (C) Expression of key marker genes defining each cluster, plotted on the UMAP. Notably, Pvalb expression was absent across all analyzed cells.
Figure 2
Figure 2
Host-dependent differentiation of mouse MGE progenitors Grafting of mouse MGE progenitors onto mouse and human cortical organotypic cultures generate different IN populations at 7 DPG. (A) Schematic of the experimental design. E13.5 mouse MGE cells were dissociated and grafted onto either GW22 human or E14.5 mouse cortical organotypic cultures to examine IN differentiation at 7 days DPG. (B) Representative image of a GW22 human cortical slice grafted with E13.5 td-Tomato-labeled mouse INs, 7 DPG. Scale bar, 100 μm. (C) Grafting onto E14.5 mouse organotypic cultures predominantly generates Sst-positive INs, while grafting onto GW22 human organotypic cultures primarily induces the differentiation of Pvalb-positive INs. Scale bar, 10 μm. (D) Quantification of IN populations across mouse and human host environments. Unpaired parametric Student’s t test without Welch’s correction: ∗∗ = p < 0.01 and ∗∗∗ = p < 0.001. Error bars represent the standard error of the mean (SEM). n = 535 for cells grafted onto human organotypic slices and 264 for cells grafted onto mouse organotypic slices. (E) Grafting of unlabeled MGE progenitors allows unbiased identification of Pvalb-positive INs. White arrows denote mouse nuclei, and yellow arrows point to adjacent human cells. Scale bars, 100 μm for the low magnification image and 10 μm for the high magnification images. See also Figures S1–S3.
Figure 3
Figure 3
Development of long-term chimeric organoid models (A) Experimental design: The MGE from mouse embryos at E13.5 is microdissected and grafted onto human organoids that are 6–8 weeks old. (B) IN migration at 1 DPG: Longitudinal live imaging captures a representative migratory IN over a 24-h period. The cell soma’s position 1 h after the experiment starts is marked for reference. (C) Lightsheet imaging of a grafted organoid. SYTO 16 dye labels all nuclei within the organoid. (D) INs localize to neuronal regions: grafted INs migrate toward neuronal regions of the organoid, marked by Map2 expression. Top: A whole section of the organoid. Scale bar, 100 μm. Bottom: comparison of Map2-poor and Map2-rich regions. Scale bar, 25 μm. (E) Synaptic marker expression at 5 WPG: The Nkx2.1-Cre::Ai34 mouse line reveals strong Syp presence in grafted INs at 5 WPG, indicating the formation of presynaptic vesicles. Scale bar, 10 μm. (F) Postsynaptic excitatory marker Psd95 puncta are detected in grafted INs (labeled with Nkx2.1-Cre::Ai14) at 5 WPG, suggesting afferent excitatory synapses. Scale bar, 10 μm. (G) Calcium imaging at 4 MPG: using the Nkx2.1-Cre::Ai96 mouse line, axodendritic calcium transients are observed in grafted INs (highlighted by magenta rectangles). Scale bar, 10 μm. (H) Calcium imaging at 5 WPG: using the Fluo-8 AM dye, we labeled both mouse and human neurons. Left: calcium transients observed in non-grafted control organoids. Right: calcium transients in tdTomato-negative cells within grafted organoids. Each colored line represents a distinct region of interest. See also Figure S4 and Videos S1 and S2.
Figure 4
Figure 4
Organoid models recapitulate species-specific biases in Pvalb and Sst expression in grafted INs (A–E) Grafting of mouse INs onto human organoids: (A) Representative image and quantification of grafted INs onto human organoids at 2 DPG. White arrow indicates a Pvalb-positive mouse IN. Scale bar, 10 μm. n = 250 cells. Yellow arrows indicate Pvalb-negative mouse INs. (B) Representative image and quantification of grafted INs at 7 DPG. Scale bar, 10 μm. n = 277 cells. The white arrow indicates a Pvalb-positive mouse IN, and the magenta arrow indicates an IN that did not express td-Tomato, likely representing a neuron that failed to recombine the td-Tomato gene. (C) Comparison of cell types generated at 7 DPG between primary human host cultures (gray) and human organoids (black). Data from Figures 2B and 4B are included. n = 535 for cells grafted onto human organotypic slices and n = 277 for cells grafted onto human organoids. (D) Representative image and quantification of grafted INs onto human organoids at 28 DPG. Scale bar, 10 μm. n = 166 cells. (E) Progressive acquisition of Pvalb expression in INs over time in human organoid hosts. (F–H) Grafting of mouse INs onto mouse organoids: (F) Representative image and quantification of grafted INs onto mouse organoids at 7 DPG. Scale bars, 100 μm for the low magnification images and 20 μm for the high magnification images. n = 189 cells. (G) Comparison of IN populations generated in mouse (gray) versus human (black) organoid hosts at 7 DPG. Data from Figures 4B and 4F. n = 277 cells for grafts onto human organoids and n = 189 cells for grafts onto mouse organoids. (H) Representative image and quantification of grafted INs onto mouse organoids at 28 DPG. Scale bar, 20 μm. n = 248 cells. Unpaired parametric Student’s t test without Welch’s correction: ∗ = p < 0.05; ∗∗∗ = p < 0.001; ∗∗∗∗ = p < 0.0001. Error bars represent SEM. See also Figures S5–S7.
Figure 5
Figure 5
Human cortical organoids influence multiple aspects of Pvalb IN identity (A) Representative images and quantification of Mef2c expression in INs grafted into mouse and human organoids at 7 DPG. Scale bar, 10 μm. n = 282 cells for grafts onto mouse organoids and n = 252 cells for grafts onto human organoids. (B) Representative images and quantification of Nr2f2 expression in INs grafted into mouse and human organoids at 7 DPG. Scale bar, 10 μm. n = 189 cells for grafts onto mouse organoids and n = 327 cells for grafts onto human organoids. (C) Representative images and quantification of ErbB4 expression in INs grafted onto mouse and human organoids at 7 DPG. Scale bar, 10 μm. n = 254 cells for grafts onto mouse organoids and n = 208 cells for grafts onto human organoids. (D) Representative image showing Bdnf and HNA staining in human organoids at 8 WPG. Scale bars, 250 μm for the low magnification image and 10 μm for the high magnification images. All Bdnf-positive cells were HNA-negative, indicating they were not of human origin. n = 323 cells. (E) Labeling of PNNs with biotinylated WFA in human organoids at 5 WPG. Scale bar, 10 μm. (F) Comparison of the soma size of INs grafted into mouse versus human organoid hosts. n = 107 cells for grafts onto mouse organoids and n = 118 for grafts onto human organoids. Unpaired parametric Student’s t test without Welch’s correction: ∗∗∗ = p < 0.001; ∗∗∗∗ = p < 0.0001. Error bars represent SEM. See also Figures S8 and S9.
Figure 6
Figure 6
Non-3D human cortical models do not instruct Pvalb fate (A) Representative images and quantification of INs co-cultured with primary mouse and human cortical cells. Scale bar, 20 μm. n = 364 cells for co-cultures with mouse cells and n = 437 cells for co-cultures with human cells. No Pvalb-positive INs were observed at 7 DIC. (B) Representative images and quantification of INs cultured in media conditioned by primary human cortical cells at 7 DIC. Scale bar, 20 μm. Human co-culture results are the same as in 6A. n = 437 cells for co-cultures with human cells and n = 212 cells for conditioned media. (C) Representative images of INs grafted onto cortical, MGE, and thalamic organoids. MAP2, a pan-neuronal marker, is used for reference. Scale bar, 10 μm. (D) Representative images and quantification of INs grafted into human MGE organoids at 7 DPG. Notably, additional Sst-positive cells from the host organoid were observed. Scale bar, 10 μm. n = 202 cells. Unpaired parametric Student’s t test without Welch’s correction: ∗∗ = p < 0.01. Error bars represent SEM. See also Figures S10–S12.
Figure 7
Figure 7
Inhibition of the mTOR pathway in PNs reduces Pvalb specification (A) Experimental design: Chimeric cortical organoids were treated with either 250 nM Rapamycin or a vehicle (control) starting at the time of grafting and continuing for 14 days. (B) Representative images and quantification of phosphorylated ribosomal protein S6 (pS6) in both control and rapamycin-treated organoids at 14 DPG. White arrows indicate INs positive for both td-Tomato and pS6. Scale bar, 10 μm. n = 245 cells for control organoids and n = 342 cells for rapamycin-treated organoids. (C) Comparison of IN subtypes in control versus Rapamycin-treated organoids. Scale bar, 10 μm. n = 182 for control organoids and n = 210 for rapamycin-treated organoids. Unpaired parametric Student’s t test without Welch’s correction: ∗∗ = p < 0.01; ∗∗∗ = p < 0.001. Error bars represent SEM. See also Figures S13–S17.
Figure 8
Figure 8
Induction of Pvalb in early postmitotic Sst-positive INs (A) Experimental design: The entire ventral telencephalon was dissected, dissociated into single cells, and grafted onto human brain organoids. (B) Representative image and quantification from an EdU incorporation assay, showing the postmitotic state of grafted INs. Scale bar, 25 μm. n = 332 cells. (C) Representative image and quantification of the identity of grafted INs at 14 DPG in human organoids. Scale bar, 10 μm. n = 199 cells. See also Figure S18.
Figure 9
Figure 9
Comparison of Pvalb and Sst upregulation in progenitor vs. postmitotic IN grafts at 14 DPG (A) Schematic representation of the experimental results. Top: grafting mouse E13.5 IN progenitors and early postmitotic INs onto human cortical organoids results in the upregulation of Pvalb in the majority of grafted cells. Bottom: grafting mouse E14.5 lineage-traced Sst INs results in INs expressing either Sst, Pvalb, or co-expressing both markers (Sst/Pvalb double-positive). Note: In both experiments, a minority of INs were double-negative for Sst and Pvalb. (B) Comparison of cell types generated at 14 DPG in organoids grafted with either E13.5 Nkx2.1-Cre::Ai14 (progenitor origin; same as control in Figure 7C) or E14.5 Sst-Cre::Ai14 (postmitotic origin; same as Figure 8C) grafts. n = 182 cells for E13.5 Nkx2.1-Cre::Ai14 and n = 332 cells for E14.5 Sst-Cre::Ai14. Unpaired parametric Student’s t test without Welch’s correction: ∗ = p < 0.05; ∗∗∗∗ = p < 0.0001. Error bars represent SEM.

References

    1. Cadwell C.R., Bhaduri A., Mostajo-Radji M.A., Keefe M.G., Nowakowski T.J. Development and Arealization of the Cerebral Cortex. Neuron. 2019;103:980–1004. doi: 10.1016/j.neuron.2019.07.009. - DOI - PMC - PubMed
    1. Di Bella D.J., Habibi E., Stickels R.R., Scalia G., Brown J., Yadollahpour P., Yang S.M., Abbate C., Biancalani T., Macosko E.Z., et al. Molecular logic of cellular diversification in the mouse cerebral cortex. Nature. 2021;595:554–559. doi: 10.1038/s41586-021-03670-5. - DOI - PMC - PubMed
    1. Allison T., Langerman J., Sabri S., Otero-Garcia M., Lund A., Huang J., Wei X., Samarasinghe R.A., Polioudakis D., Mody I., et al. Defining the nature of human pluripotent stem cell-derived interneurons via single-cell analysis. Stem Cell Rep. 2021;16:2548–2564. doi: 10.1016/j.stemcr.2021.08.006. - DOI - PMC - PubMed
    1. Harb K., Richter M., Neelagandan N., Magrinelli E., Harfoush H., Kuechler K., Henis M., Hermanns-Borgmeyer I., Calderon de Anda F., Duncan K. Pum2 and TDP-43 refine area-specific cytoarchitecture post-mitotically and modulate translation of Sox5, Bcl11b, and Rorb mRNAs in developing mouse neocortex. Elife. 2022;11 doi: 10.7554/eLife.55199. - DOI - PMC - PubMed
    1. Nowakowski T.J., Bhaduri A., Pollen A.A., Alvarado B., Mostajo-Radji M.A., Di Lullo E., Haeussler M., Sandoval-Espinosa C., Liu S.J., Velmeshev D., et al. Spatiotemporal gene expression trajectories reveal developmental hierarchies of the human cortex. Science. 2017;358:1318–1323. doi: 10.1126/science.aap8809. - DOI - PMC - PubMed

LinkOut - more resources