. 2025 Apr 8:19:1489407.
doi: 10.3389/fnins.2025.1489407. eCollection 2025.

Effects of the ketogenic diet on dentate gyrus and CA3 KCC2 expression in male rats with electrical amygdala kindling-induced seizures

Affiliations

Effects of the ketogenic diet on dentate gyrus and CA3 KCC2 expression in male rats with electrical amygdala kindling-induced seizures

Leticia Granados-Rojas et al. Front Neurosci. .

Abstract

Introduction: Ketogenic diet (KD), a high-fat, low-carbohydrate, and adequate protein diet, is a non-pharmacological treatment for refractory epilepsy. However, their mechanism of action is not fully understood. The cation-chloride cotransporter, KCC2, transports chloride out of neurons, thus contributing to the intraneuronal concentration of chloride. Modifications in KCC2 expression by KD feeding could explain the beneficial effect of this diet on epilepsy. This study aimed to determine the impact of KD on KCC2 expression in dentate gyrus layers and Cornu Ammonis 3 (CA3) strata of rats with seizures induced by amygdaloid kindling.

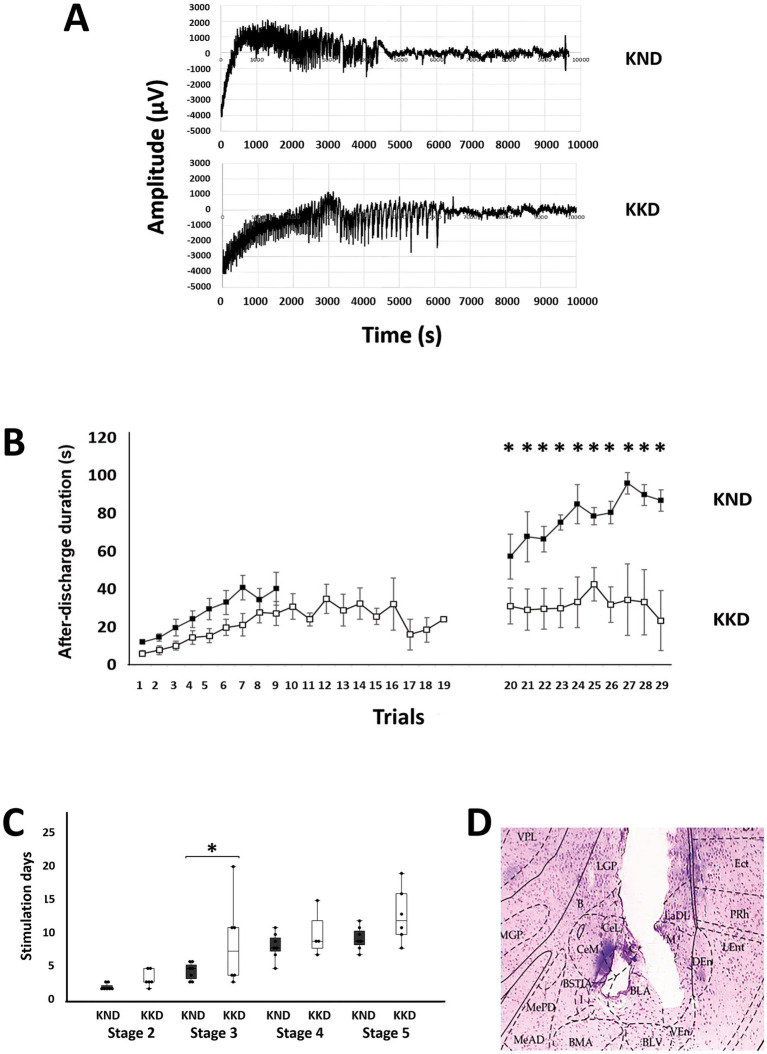
Materials and methods: Male Sprague Dawley rats were fed a normal diet (ND) or KD from postnatal day 24 until the end of the experiment. At 6 weeks after the start of the diets, rats were subjected to an amygdala kindling epilepsy model, sham or remain intact. Glucose and β-hydroxybutyrate concentrations were quantified. The after-discharge duration (ADD), latency, and duration of stages of kindling were evaluated. In addition, KCC2 expression was evaluated using optical density. A Pearson bivariate correlation was used to determine the relationship between KCC2 expression and ADD.

Results: At the end of the experiment, the KD-fed groups showed a reduction in glucose and an increase in β-hydroxybutyrate. KD reduced ADD and increased latency and duration of generalized seizures. In ND-fed animals, kindling reduced KCC2 expression in all three layers of the dentate gyrus; however, in KD-fed animals, no changes were observed. KD treatment increased KCC2 expression in the kindling group. In CA3, the pyramidal and lucidum strata showed an increase of KCC2 in KD-fed groups. Besides, the kindling had lower levels of KCC2 than the sham and intact groups. In all layers of the dentate gyrus and pyramidal and lucidum CA3 strata, the correlation indicated that the higher the KCC2 expression, the shorter the ADD during generalized seizures.

Conclusion: KD reduces ADD in generalized seizures. In addition, KD has a putative neuroprotective effect by preventing the kindling-induced reduction of KCC2 expression in the molecular, granule, and hilar dentate gyrus layers and pyramidal and lucidum CA3 strata. Increased KCC2 expression levels are related to a shorter duration of generalized seizures.

Keywords: CA3; KCC2; dentate gyrus; ketogenic diet; kindling; rat.


Conflict of interest statement

The authors declare that the research was conducted in the absence of any commercial or financial relationships that could be construed as a potential conflict of interest.

Figures

Figure 1
Figure 1
Boxplots with individual data points for each group at the beginning and end of the study of body weight (A), glucose (B), and β-hydroxybutyrate (C). The three-way ANOVA and Bonferroni’s post hoc test indicated a significant body weight increase (p < 0.001) at the end of the experiment compared to the beginning for all groups (A, *). At the end, body weight was significantly lower (p < 0.001) for the kindling groups (KND and KKD) compared to the intact ones (IND and IKD) (A, #). Regarding blood glucose concentration, for all groups, there was a significant reduction (p < 0.001) at the end of the study regarding the beginning (B, *). At the end, the KD-fed groups (IKD, KKD, and SKD) presented significantly lower glucose concentrations (p < 0.01) than ND-fed groups (IND, KND, and SND) (B, #). For blood β-hydroxybutyrate concentration, at the end of the study, the ND-fed groups (IND, KND, and SND) presented a significant decrease (p < 0.001) regarding the beginning (C, *), contrary to the KD-fed groups (IKD, KKD, and SKD) that presented a significant elevation (p < 0.001) (C, #). At the end, the KD-fed groups (IKD, KKD, and SKD) presented significantly higher (p < 0.001) β-hydroxybutyrate concentrations than ND-fed groups (IND, KND, and SND) (C, &). ND, normal diet; KD, ketogenic diet; IND, ND-fed intact; KND, ND-fed with amygdala kindling; SND, ND-fed sham; IKD, KD-fed intact; KKD, KD-fed with amygdala kindling; SKD, KD-fed sham.
Figure 2
Figure 2
Kindling model measurements in the ND-fed group (KND) and the KD-fed group (KKD). (A) Representative recordings of after-discharge activity in the amygdala: at the top, the recording from the KND group; at the bottom, the recording from the KKD group. (B) Graphs representing the duration of after-discharge activity; values are shown as means ± standard error of the mean. Statistical significance in after-discharge was assessed using a repeated measures ANOVA, followed by Bonferroni’s test. On the left, the duration during the first 20 days. On the right, the duration of generalized epileptic activity, with evident differences in the last 10 stimuli (F = 16.187, *p < 0.01). Black squares represent the KND group, and white squares represent the KKD group. (C) Number of stimuli required to reach each Racine stage. Values are shown as boxplots with individual data points for each group. Analyses using Mann–Whitney U tests showed that the latency to reach stage 3 was significantly higher (U = 8.5, p < 0.05) for the KKD group than for the KND. (D) Microphotograph showing the placement of the electrode in the basolateral nucleus of the amygdala, using a Hematoxylin and Eosin staining technique, 40x. VPL, ventral posterolateral thalamic nucleus; LGP, lateral globus pallidus; Ect, entorhinal cortex; PRh, perirhinal cortex; LEnt, lateral entorhinal cortex; DEn, dorsal endopiriform nucleus; VEn, ventral endopiriform nucleus; LaDL, lateral amygdaloid nucleus, dorsolateral part; BLV, basolateral amygdaloid nucleus, ventral part; BLA, basolateral amygdaloid nucleus, anterior part; CeL, central amygdaloid nucleus, lateral division; B, basal nucleus (Meynert); CeM, central amygdaloid nucleus; medial division; BMA, basomedial amygdaloid nucleus, anterior part; MGP, medial globus pallidus.
Figure 3
Figure 3
KCC2 expression in dentate gyrus and CA3. (A) Serial sections of the whole dentate gyrus and CA3 of the right hemisphere. (B) Panoramic view of molecular (ml), granule (gl), and hilar (hl) dentate gyrus layers and oriens (os), pyramidal (ps), lucidum (ls), and radiatum and lacunosum-moleculare (RLMs) CA3 strata. (C) The regions of interest were delimited with lines of different colors to obtain their optical density. Dentate gyrus layers: molecular (yellow line), granular (pink line), and hilar (black line). CA3 strata: oriens (red line), pyramidal (blue line), lucidum (white line), and RLM (bright yellow line). Higher magnification view of molecular (D), granule (E), and hilar (F), dentate gyrus and oriens, pyramidal, lucidum, and RLM CA3 strata (G). KCC2 immunoreactivity was observed in the plasmalemmal region (perisomal) in the granule cell body in the dentate gyrus (E) and in pyramidal cell CA3 (G). CA3 of KD-fed with kindling rat (KKD) (H), ND-fed intact rat (IND) (I), and ND-fed with kindling rat (KND) (J). Dentate gyrus of KKD rat (K), IND rat (L), and KND rat (M). The KCC2 immunoreactivity was lower in the KND group compared to the IND and KKD groups. A-C, H-M, 20x. D-G, 40x.
Figure 4
Figure 4
Boxplots with individual data points of KCC2 expression [KCC2-immunoreactivity optical density (KCC2-IR OD)] for each group in dentate gyrus layers: molecular (A), granule (B), and hilar (C). The two-way ANOVA and Bonferroni’s post hoc test indicated that the ND-fed kindling group (KND) has a lower KCC2 expression when compared to the ND-fed intact group (IND) in molecular (A, *), granule (B, *), and hilar (C, *) layers and when compared to the ND-fed sham group (SND) in molecular (A, #), granule (B, #), and hilar (C, #) layers. However, these changes were not observed in the KD-fed groups (IKD, KKD, and SKD). Only in the granule layer had the KD-fed kindling group (KKD) lower KCC2 expression when compared with the KD-fed intact group (IKD) (B, %). The IKD group had more KCC2 expression than the IND group in granule (B, $) and hilar (C, $) layers. KKD has a higher KCC2 expression than the KND group in molecular (A, &), granule (B, &), and hilar (C, &) layers. In all comparisons, p < 0.001, except for 4B, % with p < 0.01. ND, normal diet; KD, ketogenic diet; SND, ND-fed sham.
Figure 5
Figure 5
Boxplots with individual data points of KCC2 expression [KCC2-immunoreactivity optical density (KCC2-IR OD)] for each group in CA3 strata: oriens (A), pyramidal (B), lucidum (C), and RLM (D). The two-way ANOVA and Tukey’s post hoc test indicated that there were no significant changes in the oriens (A) and RLM strata (D). The KD-fed groups (IKD, KKD, and SKD) had greater KCC2 expression than the ND-fed groups (IND, KND, and SND) in the pyramidal stratum (B, *) and the lucidum stratum (C, *) (p < 0.001). Kindling groups (KND and KKD) had a lower KCC2 expression than the intact groups (IND and IKD) in the pyramidal (B, &, &´) and lucidum (C, &, &´) strata (p < 0.001), and it was also lesser in relation to sham groups (SND and SKD) in pyramidal (A, #, #´) and lucidum (B, #, #´) strata (p < 0.01). A significant difference between sham groups (SND and SKD) and intact groups (IND and IKD) was observed only in the stratum lucidum (C, $, $´) (p < 0.01). ND, normal diet; KD, ketogenic diet; IND, ND-fed intact; KND, ND-fed with amygdala kindling; SND, ND-fed sham; IKD, KD-fed intact; KKD, KD-fed with amygdala kindling; SKD, KD-fed sham.

Similar articles

References

    1. Amaral D. G., Scharfman H. E., Lavenex P. (2007). The dentate gyrus: fundamental neuroanatomical organization (dentate gyrus for dummies). Prog. Brain Res. 163, 3–22. doi: 10.1016/S0079-6123(07)63001-5 - DOI - PMC - PubMed
    1. Amaral D. G., Witter M. P. (1989). The three-dimensional organization of the hippocampal formation: a review of anatomical data. Neuroscience 31, 571–591. doi: 10.1016/0306-4522(89)90424-7. PMID: 2687721, PMID: - DOI - PubMed
    1. Aronica E., Boer K., Redeker S., Spliet W. G. M., van Rijen P. C., Troost D., et al. . (2007). Differential expression patterns of chloride transporters, Na+-K+-2Cl−-cotransporter and K+-cl−-cotransporter, in epilepsy-associated malformations of cortical development. Neuroscience 145, 185–196. doi: 10.1016/j.neuroscience.2006.11.041, PMID: - DOI - PubMed
    1. Belperio G., Corso C., Duarte C. B., Mele M. (2022). Molecular mechanisms of epilepsy: the role of the chloride transporter KCC2. J. Mol. Neurosci. 72, 1500–1515. doi: 10.1007/s12031-022-02041-7, PMID: - DOI - PubMed
    1. Bonislawski D. P., Schwarzbach E., Cohen A. S. (2007). Brain injury impairs dentate gyrus inhibitory efficacy. Neurobiol. Dis. 25, 163–169. doi: 10.1016/j.nbd.2006.09.002, PMID: - DOI - PMC - PubMed

LinkOut - more resources