. 2025 Apr 9;12(4):ofaf188.
doi: 10.1093/ofid/ofaf188. eCollection 2025 Apr.

Patterns of Decline in Measles, Mumps, and Rubella Neutralizing Antibodies and Protection Levels Through 10 Years After a Second and Third Dose of MMR Vaccine

Affiliations

Patterns of Decline in Measles, Mumps, and Rubella Neutralizing Antibodies and Protection Levels Through 10 Years After a Second and Third Dose of MMR Vaccine

Chelsea S Lutz et al. Open Forum Infect Dis. .

Abstract

Background: In the United States, 2 doses of measles-mumps-rubella (MMR)-containing vaccines are recommended routinely during childhood; a third dose may be given under certain circumstances. We present observed seroprotection rates and estimate long-term dynamics of measles, mumps, and rubella neutralizing antibody (nAb) levels among 2- and 3-dose MMR (MMR2 and MMR3, respectively) vaccinees.

Methods: Persons who received MMR2 at age 4-12 years or MMR3 at age 18-31 years were enrolled in 1994-1995 and 2009-2010, respectively. Per cohort, sera were collected before vaccination (baseline) and at various intervals ranging from 1 month to 10 years postvaccination to assess nAb levels. Annual changes in nAb levels per virus and cohort were estimated through 10 years postvaccination using generalized estimating equations. Models were stratified by baseline nAb levels.

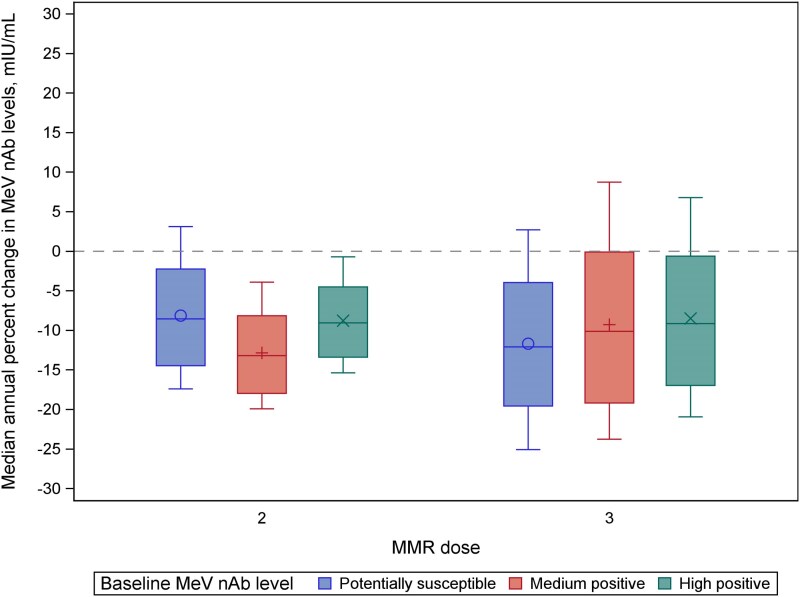
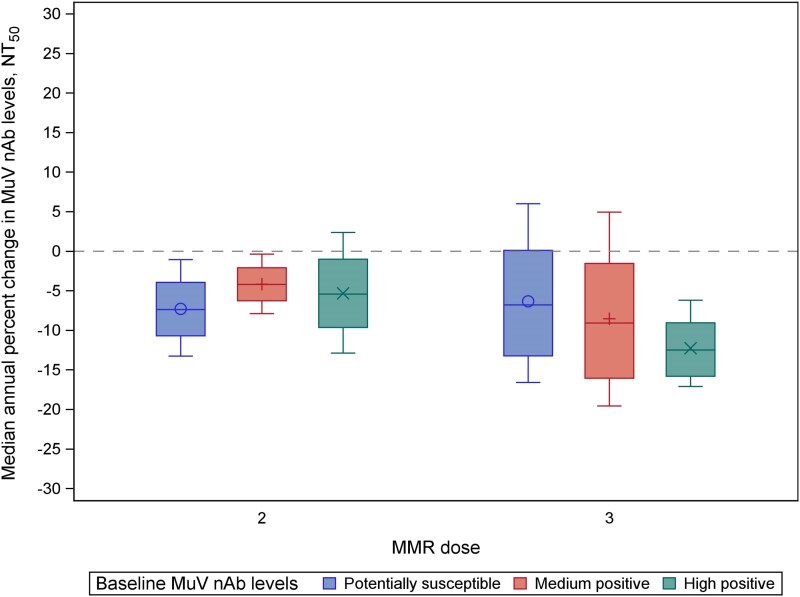
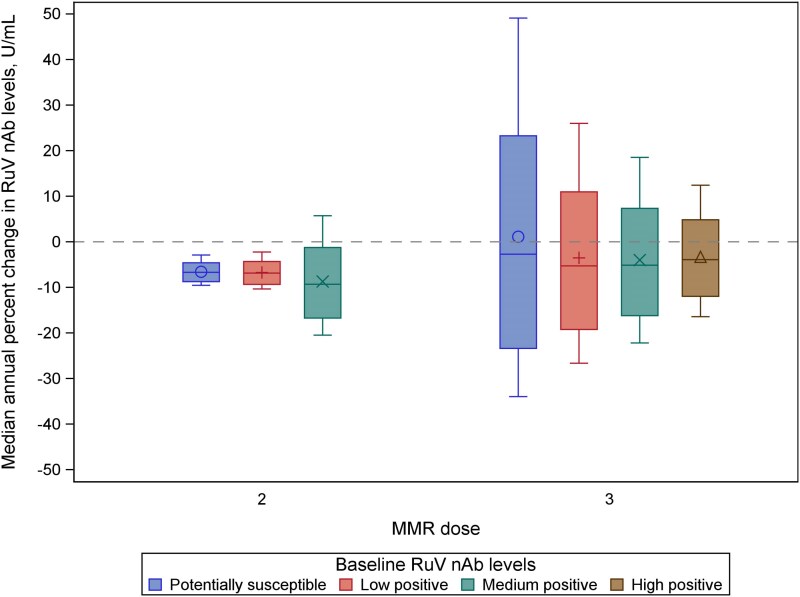
Results: Among MMR2 participants (n = 621), 93.7%, 73.4%, and 83.9% had protective nAb levels against measles, mumps, and rubella, respectively, at the 10-year visit; among MMR3 participants (n = 665), 90.5%, 69.1%, and 100% had protective nAb levels, respectively, at the 9-11-year visit. Estimated nAb levels declined annually across both cohorts, all viruses, and baseline nAb strata, though patterns and magnitude varied. More than one-quarter of participants had mumps nAb levels below the presumed seroprotection threshold at the terminal visits.

Conclusions: These findings indicate that even when MMR antibodies wane, protection against disease is largely retained. Waning of mumps antibodies was greater than for measles and rubella in both 2- and 3-dose vaccinees, likely because a greater proportion failed to mount a robust initial response.

Keywords: MMR vaccine; immunity; measles; mumps; rubella.


Figures

Figure 1.
Figure 1.
Median annual percent change in measles virus (MeV) neutralizing antibody (nAb) levels estimated over 10 years postvaccination for recipients of 2 or 3 doses of measles-mumps-rubella vaccine (MMR2 and MMR3, respectively), by baseline nAb level. Box and whisker plots represent, per dose and baseline MeV nAb level stratum, the median annual percent change from 1 month postvaccination through 10 years postvaccination, estimated by postfitting the estimates from the generalized estimating equation models to estimate new nAb levels by specified timepoints postvaccination (1 month and 1, 2, 3, 4, 5, 6, 7, 8, 9, and 10 years) using the PROC PLM procedure in SAS (version 9.4). The median annual percent change is represented by the middle horizontal line per box; the mean is represented by the circle, plus sign, or X symbol per box; the lower quartile (Q1) is represented by the lower line/boundary of each box; the upper quartile (Q3) is represented by the upper line/boundary of each box. Annual percent change by dose, baseline MeV nAb level stratum, and year(s) postvaccination are shown in Table 2. The dashed gray horizontal line is a reference line set at 0 (ie, no change). “Baseline” indicates after the first MMR dose but before the second dose among MMR2 cohort participants, or after the second dose but before the third dose among MMR3 cohort participants. Potentially susceptible: MeV nAb levels <120 mIU/mL; medium positive: MeV nAb levels 120 mIU/mL to <900 mIU/mL; high positive: MeV nAb levels ≥900 mIU/mL.
Figure 2.
Figure 2.
Annual percent change in estimated mumps virus (MuV) neutralizing antibody (nAb) levels estimated over 10 years postvaccination for recipients of 2 or 3 doses of measles-mumps-rubella vaccine (MMR2 and MMR3, respectively), by baseline nAb levels. Box and whisker plots represent, per dose and baseline MuV nAb level stratum, the median annual percent change from 1 month postvaccination through 10 years postvaccination, estimated by postfitting the estimates from the generalized estimating equation models to estimate new nAb levels by specified timepoints postvaccination (1 month and 1, 2, 3, 4, 5, 6, 7, 8, 9, and 10 years) using the PROC PLM procedure in SAS (version 9.4). The median annual percent change is represented by the middle horizontal line per box; the mean is represented by the circle, plus sign, or X symbol per box; the lower quartile (Q1) is represented by the lower line/boundary of each box; the upper quartile (Q3) is represented by the upper line/boundary of each box. Annual percent change by dose, baseline MuV nAb level stratum, and year(s) postvaccination are shown in Table 2. The dashed gray horizontal line is a reference line set at 0 (ie, no change). “Baseline” indicates after the first MMR dose but before the second dose among MMR2 cohort participants, or after the second dose but before the third dose among MMR3 cohort participants. Potentially susceptible: MuV nAb levels <31 NT50 (50% neutralization titer); low positive: MuV nAb levels 31 NT50 to <80 NT50; high positive: MuV nAb levels ≥80 NT50.
Figure 3.
Figure 3.
Annual percent change in estimated rubella virus (RuV) neutralizing antibody (nAb) levels estimated over 10 years postvaccination for recipients of 2 or 3 doses of measles-mumps-rubella vaccine (MMR2 and MMR3, respectively), by baseline nAb levels. Box and whisker plots represent, per dose and baseline RuV nAb level stratum, the median annual percent change from 1 month postvaccination through 10 years postvaccination, estimated by postfitting the estimates from the generalized estimating equation models to estimate new nAb levels by specified timepoints postvaccination (1 month and 1, 2, 3, 4, 5, 6, 7, 8, 9, and 10 years) using the PROC PLM procedure in SAS (version 9.4). The median annual percent change is represented by the middle horizontal line per box; the mean is represented by the circle, plus sign, X symbol, or triangle per box; the lower quartile (Q1) is represented by the lower line/boundary of each box; the upper quartile (Q3) is represented by the upper line/boundary of each box. Annual percent change by dose, baseline RuV nAb level stratum, and year(s) postvaccination are shown in Table 2. The dashed gray horizontal line is a reference line set at 0 (ie, no change). “Baseline” indicates after the first MMR dose but before the second dose among MMR2 cohort participants, or after the second dose but before the third dose among MMR3 cohort participants. Potentially susceptible: RuV nAb titers <10 U/mL; low positive: RuV nAb levels 10 U/mL to <40 U/mL; medium positive: RuV nAb levels ≥40 U/mL (MMR2; only 9 participants with levels >40) or 40 U/mL to <120 U/mL (MMR3); high positive: RuV nAb levels ≥120 U/mL (MMR3 only).

Similar articles

References

    1. Perrone O, Meissner HC. The importance of MMR immunization in the United States. Pediatrics 2020; 146:e20200251. - PubMed
    1. Gressick K, Nham A, Filardo TD, et al. Measles outbreak associated with a migrant shelter—Chicago, Illinois, February-May 2024. MMWR Morb Mortal Wkly Rep 2024; 73:424–9. - PMC - PubMed
    1. Mathis AD, Raines K, Masters NB, et al. Measles—United States, January 1, 2020–March 28, 2024. MMWR Morb Mortal Wkly Rep 2024; 73:295–300. - PMC - PubMed
    1. Marin M, Marlow M, Moore KL, Patel M. Recommendation of the Advisory Committee on Immunization Practices for use of a third dose of mumps virus–containing vaccine in persons at increased risk for mumps during an outbreak. MMWR Morb Mortal Wkly Rep 2018; 67:33–8. - PMC - PubMed
    1. Centers for Disease Control and Prevention . Update: Mumps outbreak—New York and New Jersey, June 2009–January 2010. MMWR Morb Mortal Wkly Rep 2010; 59:125–9. - PubMed